Identifying the spatiotemporal variations and influencing climate factors of evapotranspiration (ET) and its components (vegetation transpiration (Ec), soil evaporation (Es), and canopy interception evaporation (Ei)) can greatly improve our understanding of water cycle, carbon cycle, and biogeochemical processes in a warming climate. As the world′s largest hydropower project, the construction of the Three Gorges Project (TGP) coupled with the significant land use/land cover change affected the regional water and energy exchange in the Three Gorges Reservoir Area (TGRA). This study aimed to reveal the spatiotemporal variations and influencing climate factors in ET and its components using PML-V2 products in TGRA during 2000–2020. Results showed that the mean annual ET, Ec, Es, and Ei in TGRA were 585.12, 328.49, 173.07, and 83.56 mm, respectively. The temporal variation of ET was dominated by Ec, with no significant change in the time trend. Es decreased (2.92 mm/y) and Ei increased (1.66 mm/y) significantly mainly in the cultivated land. ET, Ec, and Ei showed a similar seasonal variation pattern with a single peak, while Es presented a bimodal pattern. From the pre-impoundment to the first impoundment period, ET and Ec mainly increased in the head of TGRA, meanwhile, Es in urban area increased significantly by 27.8%. In the subsequent impoundment periods, ET and Ec changed slightly while Es sharply decreased. The Ei increased persistently during different impoundment period. The dominant climate factors affecting changes in Ec and Es were air temperature, vapor pressure deficit, and sunshine hours, while the variation of Ei was mainly affected by air temperature, vapor pressure deficit, and precipitation.
1. Introduction
As the world′s largest hydropower project, the Three Gorges Project (TGP) provided protection for flood control, water supply, shipping, and power safety for the contemporary era
[1][24]. TGP was officially launched in 1994 and initially impounded in June 2003. It started storing water step-by-step from 135 m in late 2003, to 156 m and 172 m above sea level in late 2006 and late 2008, respectively. After one year of experimental water impoundment since the end of 2008, TGP was officially operated at full 175 m capacity and then lowered to 145 m during flood season
[2][25]. The impacts of TGP have been discussed by governments and scientists since the 1950s, with ecological impact being one of the most controversial academic issues
[3][4][5][6][26,27,28,29].
2. Analysis on Results
2.1. Model Validation
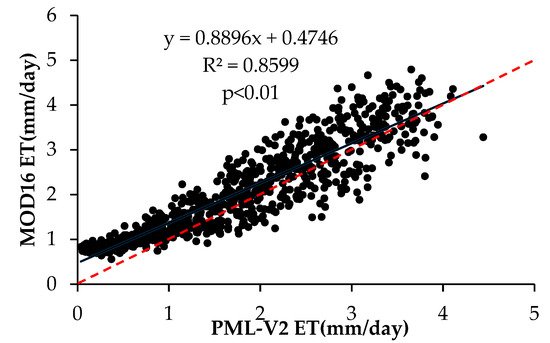
The comparison between the 8-day ET from MOD16 and that from PML-V2 is presented in
Figure 13. Good agreement was found between the two datasets, with the R
2 of 0.86 (
p < 0.01). While most of the scattered points fell above the 1:1 line, indicating that PML-V2 ET underestimated ET compared to MOD16, but the distribution of the scatter points was relatively uniform, indicating that the PML-V2 model could better described the seasonal variation characteristics of ET in TGRA
[7][36]. The verification result suggested that at the 95 global flux sites globally (R
2 = 0.72)
[8][39], and it was also slightly better than the performance of PML-V2 ET in northern China
[9][40]. Overall, the validation result confirmed the reliability of using the PML-V2 data product to reveal the spatial and temporal variation of ET in TGRA.
Figure 13. Scatter plots of MOD16 ET against PML-V2 ET.
2.2. Interannual Variation of ET and Its Components
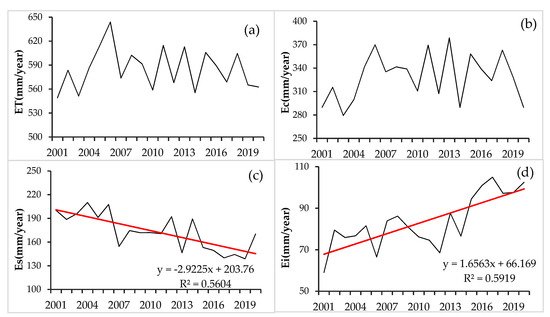
The interannual variation of ET and its components are shown in
Figure 24. The annual ET ranged from 549 to 644 mm across the whole study period, and the mean annual Ec, Es, and Ei were 328.49, 173.07, and 83.56 mm, respectively, which accounted for 56.06%, 29.64%, and 14.3% of ET, respectively. Es showed a significantly decreasing trend from 2001 to 2020 with the rate of −2.92 mm/y (R
2 = 0.56), while Ei showed a significantly increasing trend with the rate of 1.66 mm/y (R
2 = 0.59). The interannual changes of ET and Ec were not significant.
Figure 24. The temporal variation of annual ET(a), Ec(b), Es(c), and Ei(d) from 2001 to 2020.
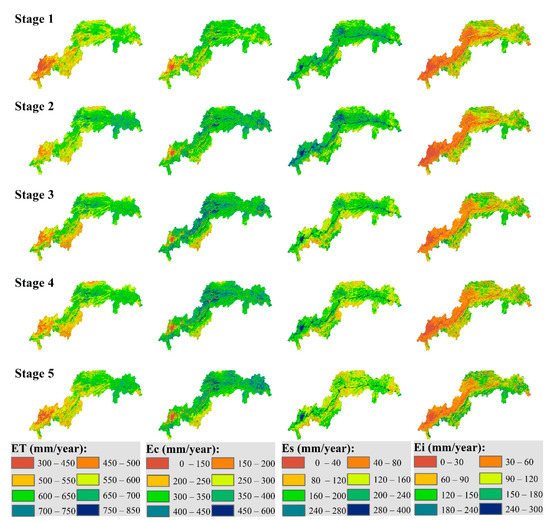
The spatial distribution of annual ET and its components during different impoundment periods are shown in
Figure 35. ET and Ec changed significantly from stage 1 to stage 2, they increased by 7.7% and 12.2% in the whole TGRA, 15.0% and 17.8% in the head of TGRA, and 6.9% and 12.5% in the tail of TGRA, respectively. While in the central part of TGRA, ET and Ec increased slightly, from 548.4 to 579.7 mm and 287.8 to 313.5 mm, respectively. They changed little from stage 2 to stage 5. Es in the urban area increased significantly by 27.8% from stage 1 to stage 2; however, it sharply decreased from 385.9 to 349.9 mm from stage 2 to stage 3, with forest land and cultivated land decreasing by 10.8% and 21.9%, respectively. From stage 3 to stage 5, Es decreased slightly by 6.2% which also mainly occurred in cultivated land. The Ei of the forest land was 102.1 mm, which was higher than 63.7 mm of the cultivated land. Overall, the Ei in TGRA increased significantly by 27.4% from stage 1 to stage 5, and the most obvious change was observed in cultivated land, which increased by 38.7%.
Figure 35. The spatial distribution of annual ET, Ec, Es, and Ei during different impoundment periods.
2.3. Seasonal Patterns of ET and Its Components
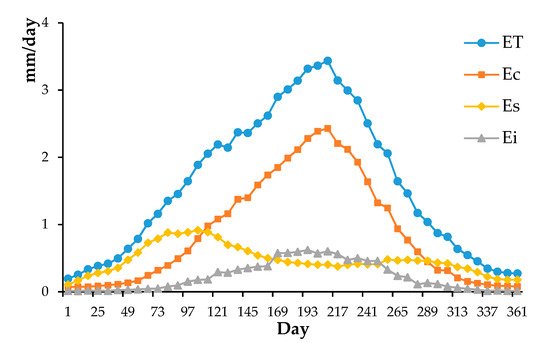
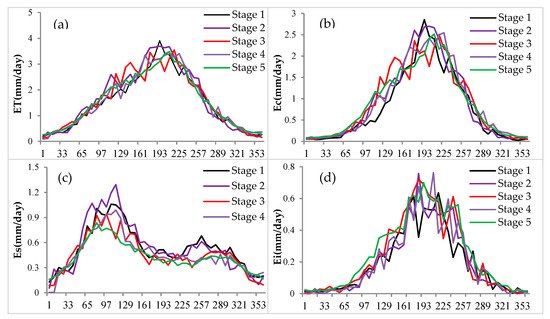
ET, Ec, and Ei presented a similar pattern of seasonal variation with a single peak (
Figure 46); they increased progressively from the beginning of year and reached the maximum on the 209th day, and then decreased progressively to the end of the year. Daily ET and Ec increased at the rate of 0.14 and 0.1 mm/day before the 209th day and decreased at the rate of 0.18 and 0.13 mm/day after the 209th day, respectively. Ei increased exponentially from the 1st to the 169th day, then changed slightly to the 249th day, and decreased exponentially to the end of the year. The peak of Ei was observed at the 193rd day of the year. Es presented a bimodal pattern with two peaks at the 105th day and the 257th day, respectively.
Figure 46. Temporal trends of seasonal variation in Ec, Es, and Ei during 2000–2020.
The seasonal variations of daily ET and its components during different impoundment periods are shown in
Figure 57. Ec from January to May before impoundment (stage 1) was lower than that after impoundment, but there was no significant difference in Ec among different impoundment stages from June to December. The peak of Ec appeared at the 193rd day before impoundment (stage 1), while it delayed to the 201st day, 209th day, and 217 day for stage 2 to stage 4, respectively, and finally returned to the 209th day at stage 5. Es from February to June was in order: stage 2 > stage 1 > stage 3 > stage 4 > stage 5, and there was little difference in Es among different impoundment stages from June to July. The Es at stage 1 was higher than other stages from July to October, while Es at stage 5 was lower than other stages across the year. After impoundment, Ei increased form 0.20 mm/day at stage 1 to 0.25 mm/day at stage 5, and the increase of Ei was greatest from days 169 to 217, with a 14.0% increase.
Figure 57. Temporal trends of daily ET(a), Ec(b), Es(c), and Ei(d) during different impoundment periods.
2.4. Response of ET and Its Components Variation to Climate Change
The employed five climate factors explained 86.57%, 85.63%, 39.80%, and 62.54% variance of ET, Ec, Es, and Ei, respectively. Based on the relationship between climate factors and ET, Ec, Es, and Ei, it can be found that the influence of climate factors on ET, Ec, Es, and Ei varied from site-to-site (
Table 13). As far as ET, Ec, and Es were concerned, the relative importance of meteorological factors was in order: Ta > VPD > SSD > PT > WS. While for Ei, the relative importance of meteorological factors was in order: Ta > VPD > PT > SSD > WS. Overall, the variation of ET, Ec, Es, and Ei in TGRA was dominated by Ta, as can been seen from
Table 2, Ta showed the highest relative importance at each station. The % incMSE of Ta were much higher than the corresponding values of VPD, SSD, PT, and WS, generally indicating that the influence of temperature on the variation of ET and its components was more pronounced than other meteorological factors. The % incMSE of Ta was 0.8096 and 0.4818 for ET and EC, respectively, which was much higher than 0.0557 and 0.0555 for Es and Ei, respectively, suggesting that influence of temperature on the variation of ET and Ec was more significant than that on Es and Ei. Similar results were also observed for VPD.
Table 13. Random forest results (the value of % incMSE) at different sites during 2000–2020.
| |
Station |
Var Explained (%) |
PT |
Ta |
WS |
VPD |
SSD |
| ET |
BD |
| 0.0028 |
| Mean |
| 62.54 |
| 0.0114 |
| 0.0555 |
| 0.0019 |
| 0.0138 |
| 0.0056 |
Random forest results (the value of % incMSE) at different sites during 2000–2020.
Table 2. Detailed information of the studied meteorological stations.
| Name |
Longitude
(°E) |
Latitude
(°N) |
Elevation
(m a.s.l) |
PT
(mm) |
Ta
(°C) |
WS
(m/s) |
SSD
(h) |
VPD |
| 89.84 |
0.0922 |
0.6573 |
0.0204 |
0.3740 |
0.1206 |
| Badong (BD) |
110.22 |
31.02 |
3340 |
1085.44 |
17.53 |
1.77 |
1602.23 |
0.64 |
CS |
86.21 |
0.1097 |
1.0272 |
0.0138 |
0.4316 |
0.1264 |
| Changshou (CS) |
107.04 |
29.50 |
3776 |
1103.62 |
18.15 |
1.31 |
1126.22 |
0.54 |
FD |
88.23 |
0.0930 |
0.7969 |
0.0557 |
0.4015 |
0.1345 |
| Fengdu (FD) |
107.41 |
29.52 |
2180 |
1035.60 |
18.85 |
1.29 |
1265.67 |
0.64 |
FJ |
89.60 |
0.0967 |
0.7408 |
0.0173 |
0.3404 |
0.1123 |
| Fengjie (FJ) |
109.30 |
31.03 |
6073 |
1038.52 |
18.39 |
1.73 |
1372.31 |
0.69 |
JJ |
86.04 |
0.1121 |
0.7987 |
0.0171 |
0.3271 |
0.1782 |
| Jiangjin (JJ) |
106.15 |
29.17 |
2614 |
1009.62 |
18.89 |
1.41 |
1087.69 |
0.41 |
SPB |
73.73 |
0.1085 |
0.8812 |
0.0299 |
0.4329 |
0.1254 |
| Shapingba (SPB) |
106.28 |
29.35 |
2591 |
1134.39 |
18.96 |
1.40 |
989.72 |
0.63 |
WZ |
89.08 |
0.0862 |
0.8290 |
0.0402 |
0.5208 |
0.1885 |
| Wanzhou (WZ) |
108.24 |
30.46 |
1867 |
1177.85 |
18.87 |
0.93 |
1203.34 |
0.41 |
XS |
89.79 |
0.1004 |
0.7454 |
0.0120 |
0.3614 |
0.0831 |
| Xingshan (XS) |
110.46 |
31.14 |
2755 |
962.15 |
17.23 |
1.11 |
1560.64 |
0.46 |
Mean |
86.57 |
0.0999 |
0.8096 |
0.0258 |
0.3987 |
0.1336 |
| Ec |
BD |
90.02 |
0.0288 |
0.3951 |
0.0129 |
0.1837 |
0.0780 |
| CS |
84.73 |
0.0271 |
0.5732 |
0.0141 |
0.2514 |
0.0851 |
| FD |
87.76 |
0.0273 |
0.4418 |
0.0326 |
0.2150 |
0.0940 |
| FJ |
91.16 |
0.0393 |
0.5359 |
0.0161 |
0.1919 |
0.0839 |
| JJ |
83.54 |
0.0374 |
0.4638 |
0.0089 |
0.1410 |
0.0851 |
| SPB |
70.36 |
0.0550 |
0.5373 |
0.0257 |
0.2202 |
0.0723 |
| WZ |
87.54 |
0.0229 |
0.3838 |
0.0148 |
0.1544 |
0.0876 |
| XS |
89.89 |
0.0381 |
0.5237 |
0.0091 |
0.2211 |
0.0678 |
| Mean |
85.63 |
0.0345 |
0.4818 |
0.0168 |
0.1973 |
0.0817 |
| Es |
BD |
35.42 |
0.0083 |
0.0315 |
0.0025 |
0.0255 |
0.0093 |
| CS |
29.66 |
0.0076 |
0.0453 |
0.0007 |
0.0264 |
0.0195 |
| FD |
26.86 |
0.0040 |
0.0321 |
0.0040 |
0.0185 |
0.0086 |
| FJ |
33.67 |
0.0060 |
0.0225 |
0.0019 |
0.0169 |
0.0076 |
| JJ |
53.60 |
0.0232 |
0.0815 |
0.0071 |
0.0571 |
0.0280 |
| SPB |
39.51 |
0.0140 |
0.0756 |
0.0062 |
0.0547 |
0.0120 |
| WZ |
67.26 |
0.0207 |
0.1137 |
0.0133 |
0.0978 |
0.0332 |
XS |
32.43 |
0.0113 |
0.0431 |
0.0025 |
0.0231 |
0.0064 |
| Mean |
39.80 |
0.0119 |
0.0557 |
0.0048 |
0.0400 |
0.0156 |
| Ei |
BD |
65.44 |
0.0188 |
0.1020 |
0.0034 |
0.0233 |
0.0069 |
| CS |
62.63 |
0.0220 |
0.1270 |
0.0051 |
0.0314 |
0.0120 |
| FD |
65.74 |
0.0163 |
0.0957 |
0.0048 |
0.0227 |
0.0097 |
| FJ |
70.16 |
0.0085 |
0.0331 |
0.0003 |
0.0075 |
0.0046 |
| JJ |
60.74 |
0.0027 |
0.0116 |
0.0004 |
0.0040 |
0.0022 |
| SPB |
43.67 |
0.0021 |
0.0156 |
0.0002 |
0.0055 |
0.0038 |
| WZ |
58.74 |
0.0027 |
0.0118 |
0.0004 |
0.0046 |
0.0026 |
| XS |
73.21 |
0.0178 |
0.0473 |
0.0008 |
0.0109 |
3. CDiscurrent Insightsssion
This study used PML-V2 ET and its component products generated at 500 m and 8-day resolution. The validation result showed that it had good performance in modeling ET compared with MOD16 ET (R
2 = 0.86) in TGRA. However, the accuracy of the MOD16 ET product also needs to be evaluated as it underestimated the ET for semiarid area
[10][49] and overestimated for forested areas
[11][12][50,51]. Moreover, the FAO-56 Penman–Monteith model used in MOD16 was limited due to the lack of required weather data in many regions
[13][52], and the heterogeneity of land use
[14][53], uncertainty in measuring soil water status
[15][54], and complex dynamic changes in vegetation
[7][36] also affecting the evaluation of ET, which were ignored in ET models. Moreover, due to the absence of the lysimeters, isotopes, and sap flux in TGRA, the ET components were not verified in this study. Therefore, the sites that measured ET and its components in TGRA are likely to be built and a more accurate validation method is needed to carry out future research.
The average annual ET in TGRA was 585.12 mm, which was higher than the average ET of 406 mm across China
[16][55], and much higher than the ET in arid and semiarid regions in western China, such as the Loess Plateau
[17][56] and Tibetan Plateau
[18][6], while it was much lower than ET in humid regions in eastern China
[16][55].
Ec accounted for 56.06% of ET and it was the most important ET component in TGRA. The contribution of Ec to ET was reasonable compared with the results of 0.20–0.65 for global terrestrial ecosystems
[19][57], 0.52–0.59 for Chinese terrestrial ecosystem
[20][19], while it was much lower than that for the Yangtze River Basin, where the Ec accounted for 65% of ET
[21][58], and was higher than that for the Yellow River Basin, where the proportion of Ec to ET was 48%
[22][59]. Es accounted for 29.64% of ET in TGRA, which was lower than 0.55 across China
[23][60], and much lower than the proportion for the Tibetan Plateau
[18][6] and the Yellow River Basin
[22][59] in semiarid regions in western China, while the proportion was slightly higher than that globally
[24][13]. Ei accounted for the lowest proportion of ET in TGRA (14.3%), which was higher than 9.98% on a global scale
[24][13].
Due to the difference in climatic features, hydrological regimes, vegetation, and soil coupled with the methodology and data, the proportion of ET components varied from region-to-region
[25][20][18,19]. Generally, Ec accounted for the major part of ET globally and in most regions
[24][25][13,18], especially in vegetated systems with low precipitation, Ec was the most important part among the three components
[25][18]. While for areas in deserts and the Plateau with low vegetation coverage, yet high precipitation and temperature, Es was the predominate part
[18][24][6,13]. Ei depended on the precipitation and canopy status. Compared to Ec and Es, it accounted for a little proportion of ET, while it was an indispensable component of surface water balance, particularly for the vegetated areas with higher vegetation coverage and leaf area index
[26][22].
The mean annual ET did not show a significant change in TGRA from 2000 to 2020; this was consistent with the results from previous studies for TGRA
[27][7][28][33,36,37]. For instance, Wang et al.
[7][36] found that the annual ET displayed an insignificant increasing trend from 1993 to 2013. Hao et al.
[27][33] reported an insignificant increasing trend of ET during 2000–2015. Zheng et al.
[28][37] investigated the variation of ET using MOD16 from 2003 to 2016, and the results showed no obvious change trend.
The dominant climate factors affecting the changes in ET, Ec, and Es were Ta and VPD. The result was consistent with that of Pascolini-Campbell et al.
[29][61], who investigated the global ET from 2003 to 2019 and found that land temperature was the main driver of the ET trend. Increases in VPD and temperature combined with the decrease in relative humidity
[30][62] increased the atmospheric demand for evapotranspiration
[31][63].
Since the construction of TGP, the land use/land cover changed significantly in TGRA
[32][30]. The forest and vegetation coverage, the leaf area index increased significantly during the past two decades
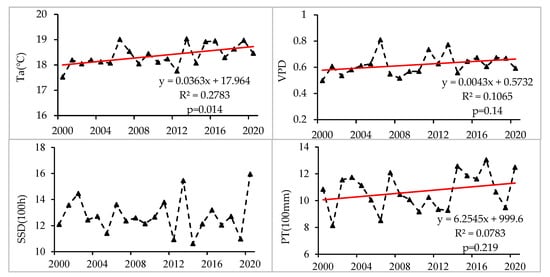
[33][64], which significantly increased Ei from 2000 to 2020. Moreover, Ei was directly related to PT, and PT presented a similar changing trend to that of Ei (
Figure 24 and
Figure 68). Generally, the land use change from cultivated land and grassland to shrubs and forest
[27][33], as well as the increase of Ta and VPD, leading to the increase in the degree of stomatal opening, can enhance the process of vegetation transpiration and increase the Ec
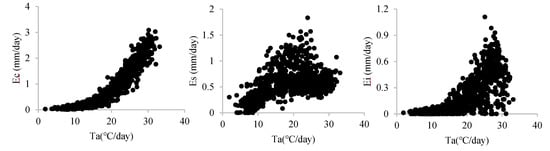
[34][35][65,66]. However, the Ec did not show significant increasing trend; this may be due to the exponential increase of Ec with increasing Ta (
Figure 79). Although Ta showed a weak significant increase and the interannual variation trend of Ta was very similar to that of Ec (
Figure 24 and
Figure 68), the increase and decrease effect of Ta would be magnified to the change of Ec, so the Ec change was more drastic and its linear change trend was not significant.
Figure 68. Interannual variation of the four dominant factors (Ta, VPD, SSD, and PT).
Figure 79. Trends of Ec, Es, and Ei as Ta increase (8-day mean scatter plot).
Previous studies suggested that Es correlated significantly with soil temperature, VPD, and PT
[29][61]. The Ta, VPD, and PT showed increasing trends during the study period (
Figure 68). The increase of Ta and VPD will increase Es to meet the need of atmospheric demand
[36][67]. However, Es decreased significantly with the rate of −2.92 mm/y, this may be due to the increased vegetation coverage and the leaf area index. With the increase of Ta, vegetation growth accelerated, vegetation coverage and the leaf area index increased, so that Es showed an increasing at first and then a decreasing trend, with the increase of Ta (
Figure 79). Moreover, the land use change and ecological restoration could also increase vegetation coverage, which offset the effect of increasing Ta, VPD, and PT
[27][7][33,36]. Therefore, increase of vegetation coverage was the main factor responsible for the decrease of Es in most areas of TGRA.