Your browser does not fully support modern features. Please upgrade for a smoother experience.
Please note this is a comparison between Version 2 by Rita Xu and Version 1 by Gabriella De Vita.
Forkhead box E1 (FOXE1) is a transcription factor involved in thyroid cancer susceptibility. Here we show that FOXE1 expression in thyroid cells correlate with chemokines induction and monocyte chemoattraction, and that reduction of FOXE1 gene dosage in vivo impairs macrophage infiltration in thyroid cancer. Our data reveal that FOXE1 is involved in the cancer-immune cells crosstalk.
- FOXE1
- chemokines
- TAMs
- tumour microenvironment
1. Introduction
The incidence of thyroid cancer is constantly increasing, with the most frequent histotype, papillary thyroid carcinoma (PTC), representing 2% of total diagnosed neoplasms [1] and being one of the most common cancers in women under the age of 50 [2,3][2][3]. Although the differentiated forms, including PTC, have a good 5-year prognosis in 85% of cases [3], 15% remain with a poor prognosis and can either metastasise or progress to an aggressive anaplastic thyroid carcinoma (ATC). Despite mutations in several genes, as well as the expression levels of different markers having been associated with a poor prognosis, there are not yet defined molecular markers that could predict cancer progression [4]. Cancer cells are embedded in a complex microenvironment in which pivotal roles are played by immune cells, the most abundant of which in thyroid cancer are tumour-associated macrophages (TAMs). High TAM density has been indeed associated with larger tumour size and lymph node metastases in PTC [5,6][5][6] as well as with high histologic grade and invasiveness in poorly differentiated thyroid cancer (PDTC) [7,8][7][8]. Moreover, in both PTC and PDTC, TAM density is correlated with reduced survival [5,7][5][7]. The correlation between increasing presence of TAMs and cancer progression and lethality has also been confirmed in ATC, where TAMs could represent more than 50% of the tumour mass [9], although the molecular bases of this correlation are still unclear. It has been shown that advanced thyroid cancer presents massive TAMs infiltration [8,9][8][9] and that defined macrophage subpopulations play different roles in determining the aggressive cancer course [10,11,12][10][11][12]. Infiltrating TAMs could, indeed, belong to the tumour-suppressive (M1) or the pro-tumourigenic (M2) subtype [13]. It has been demonstrated that the increase in M2 macrophages during thyroid cancer progression contributes to cancer aggressiveness by promoting angiogenesis and immune escape, particularly in BRAF-mutated cancer [8,10][8][10].
Recently, several polymorphisms in regulatory and/or coding regions of the transcription factor FOXE1 have been associated with increased susceptibility to PTC [14,15][14][15] and aggressive forms of thyroid cancer [16,17][16][17]. In particular, polymorphisms that increase FOXE1 expression levels have been associated with several bad clinical parameters such as severe histopathological characteristics, reduced degree of differentiation, invasion of lymph nodes and metastases [16,18][16][18]. By using a conditional mouse model of BRAFV600E-inducible thyroid cancer [19] crossed with FOXE1 heterozygous knockout mice, we recently demonstrated that FOXE1 gene dosage affects cancer histology, proliferation and differentiation [20], thus showing for the first time a cause–effect relationship between FOXE1 and the thyroid cancer phenotype. To investigate the gene expression programme induced by FOXE1, here we ectopically express it in FRT rat thyroid cells lacking endogenous FOXE1 expression, showing that the differentially expressed genes are particularly enriched in categories related to immune cells functions. Moreover, FOXE1-expressing cells increase their migratory ability, being also able to induce monocytes chemotaxis. We then checked if FOXE1 was also involved in a similar phenotype in vivo in a thyroid cancer model with heterozygous FOXE1 knockout. Consistent with in vitro data, reduction of FOXE1 gene dosage downregulates the expression of immune-related genes by reducing Tam’s recruitment and impairing their polarisation towards anti-inflammatory and pro-tumourigenic M2 status.
FOXE1 Expression Induces a Migratory Phenotype in FRT Cells
2. FOXE1 Expression Induces a Migratory Phenotype in FRT Cells
Cells in the Fischer rat thyroid epithelial cell line (FRT) are poorly differentiated follicular cells derived from Fischer rat thyroid glands that do not express FOXE1 or other thyroid differentiation markers, except for PAX8 [21]. FOXE1-expressing FRT cells were generated by transfection with a FOXE1-expressing vector. FOXE1 RNA and protein expression were measured in three independent FOXE1 clones (FC) by RT-PCR and Western blot, respectively, observing that FC26, FC19, and FC55 expressed different FOXE1 protein levels. FRT parental cells (from here on reported as ctr) are negative for FOXE1 expression, as expected (Figure 1A). FOXE1 nuclear localisation was confirmed by immunofluorescence (Figure 1B), revealing that the FC55 clone shows the most homogeneous staining. As FOXE1 induces thyroid cell motility both in development and in cancer [22[22][23],23], we analysed the migratory behaviour of FC. Cell motility was then measured by transwell assay: FOXE1-expressing clones and control cells were seeded in the upper transwell chamber in serum-free medium and allowed to migrate. Representative images of the transwell before (total cells) and after (migrating cells) membrane cleaning is reported in Figure 1C, and the quantification of migrated cells per analysed area is reported in Figure 1D, showing a significant increase of cell migration only for the clones FC19 and FC55. These results suggest that FOXE1, at high expression levels, stimulates FRT cell motility.
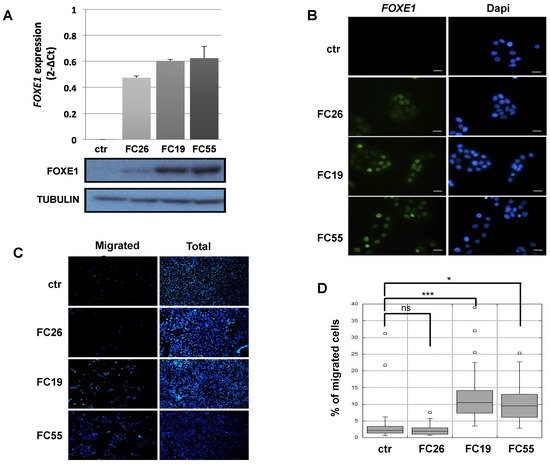
Figure 1. FOXE1 elicits thyroid cell migration of FOXE1-overexpressing clones. (A) FOXE1 expression in ctr cells and different FOXE1 clones (FC) analysed by qRT PCR (upper panel) and Western blot (bottom panel). Tubulin was used to normalise. (B) Immunofluorescence images of the same clones as in A, probed with anti-FOXE1 antibody, showing nuclear FOXE1 localisation. Nuclei are stained with Dapi. 40× magnifications are shown. The scale bar represents 20 um. (C) Transwell assay performed on control cells (ctr) and FOXE1-expressing clones FC26, FC19, FC55. Representative images of the transwell used before (total) and after (migrated) swab cleaning of the inner part of the upper chamber. Cells were stained with Dapi in order to visualise the nuclei. (D) The percentage of migrated on total cells was calculated. One-way ANOVA test was performed on data, and p-values are reported for each clone relative to ctr. * p < 0.05, *** p < 0.001, ns: not significant.
2.2. Transcriptomic Landscape of FOXE1-Expressing FRT Cells
3. Transcriptomic Landscape of FOXE1-Expressing FRT Cells
To investigate the transcriptional programme induced by FOXE1 in thyroid epithelial cells, we selected the FC55 displaying the highest and most homogeneous expression of FOXE1. RNAseq analysis was performed on total RNA from FC55 and control cells. Differentially expressed genes (DEG) were considered with a ±2-fold change and p ≤ 0.05 cut-off and analysed by Gene Ontology (GO). A total of 750 DEG resulted as being regulated ± 2-folds, of which 469 (62.5%) were upregulated and 281 (37.5%) were downregulated (Figure 2A). GO terms enriched in upregulated genes were clustered in functional categories mainly related to signal transduction, macrophage recruitment and differentiation, metal ion homeostasis and transport and extracellular matrix components (Figure 2B). GO terms significantly enriched in downregulated genes were instead mainly related to cell cycle, epigenetic regulation of chromatin, immune cell migration and cholesterol metabolism (Figure 2C). A panel of DEG, grouped for functional categories, was then validated performing quantitative RT-PCR on the three clones FC26, FC19 and FC55 (Figure S1).
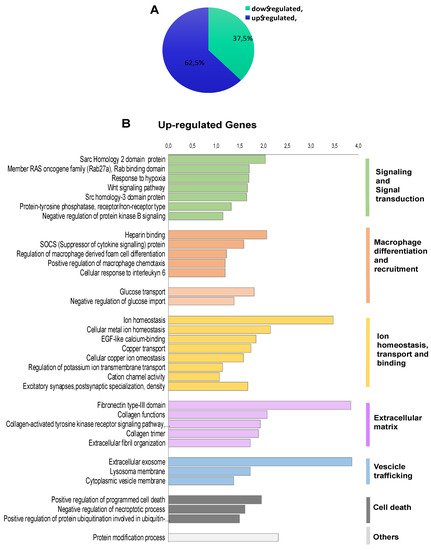
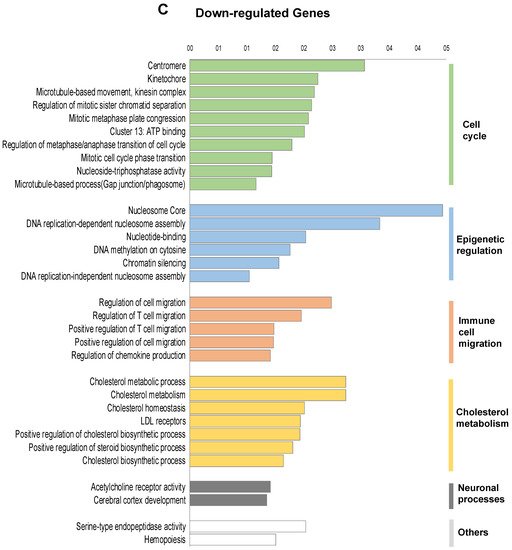
Figure 2. Functional annotation of differentially expressed genes in FOXE1-overxpressing cells. RNAseq analysis was performed on total RNA from FC55 and control cells. (A) Pie chart of differentially expressed genes (DEG), considered with a ±2-fold change (FC) and p ≤ 0.05 cut-off and analysed by Gene Ontology (GO). A total of 750 DEG resulted as being regulated, of which 469 (62.5%) upregulated and 281 (37.5%) downregulated. Functional categories were significantly enriched among genes that were either (B) upregulated or (C) downregulated. Functional categories (highlighted on the right in vertical groups) were obtained by clustering the functional annotation contained in the web-based DAVID database. To perform clustering, we used multiple annotations—namely, gene ontology for biological processes, molecular function and cellular components (GO_DIRECT), pathways, protein interactions, protein domain and tissue expressions. Enrichment scores are plotted only for clusters containing multiple terms with p < 0.05.
2.3. FOXE1 Enhances Chemoattractant Ability of FRT Cells
4. FOXE1 Enhances Chemoattractant Ability of FRT Cells
The observed enrichment of multiple functional categories related to immune cells recruitment, migration and differentiation in FOXE1-induced DEG was largely unexpected. Particularly, several genes involved in macrophages chemotaxis and differentiation were clustered in the upregulated genes list. Among these, the most strongly upregulated was CCL2, a well-established macrophage chemoattractant. In addition, several other genes encoding secreted proteins involved in macrophage recruitment and activation, such as CCL7, CSF1, LGALS3BP and INPP5D [24[24][25][26],25,26], resulted as being upregulated in FC55 by RNA-seq (Figure 3A). Upregulation of these macrophage ligands was validated by quantitative RT-PCR in the FC, revealing a correlation between FOXE1 dosage and the extent of these genes’ upregulation (Figure 3B). To investigate if the induction of these genes could change macrophage recruitment by chemoattractants release in the extracellular medium, we tested the ability of FC to induce monocyte chemotaxis by co-culture assay. FRT and the three FOXE1 clones were cultured in the transwell lower chamber in order to obtain secreted proteins accumulation in the medium. U937 human monocytes were then added in the upper chamber in serum-free medium, and their migration through the transwell porous membrane was measured (Figure 3C). A statistically significant increase of U937 cells migration was observed only when co-cultured with the high FOXE1 expressing clones FC19 and FC55 (Figure 3D), demonstrating a FOXE1 dose-dependent gain in chemoattractant activity.
Figure 3. FOXE1 modulates macrophage-related genes and their migration in vitro. (A) Macrophage-related genes from RNA-seq analysis of FOXE1-expressing FRT. (B) Quantitative RT-PCR analysis of genes in A in FOXE1 clones with low (FC26), moderate (FC19) and high (FC55) FOXE1 expression. The data are shown as ctr-relative expression (2-∆∆Ct). Actin was used to normalise. The starting value of the control, set to 1, is indicated by the dotted line. (C) Ctr cells and FOXE1 clones were seeded in transwell low chamber and U937 cells were added in the upper chamber after 48 h. (D) The percentage of migrating U937 cells was evaluated after 4 h. One-way ANOVA test was performed on data, and p-values are reported for each clone relative to ctr. * p < 0.05, *** p < 0.001, ns: not significant.
2.4. Chemokine Expression and Immune Cell Recruitment Are FOXE1-Dependent in an In Vivo Thyroid Cancer Model
5. Chemokine Expression and Immune Cell Recruitment Are FOXE1-Dependent in an In Vivo Thyroid Cancer Model
It has been demonstrated that conditional activation of oncogenic BRAF in mouse results in the induction of thyroid cancers with increased CCL2 and CSF1 expression, associated with the recruitment of tumour-associated macrophages (TAMs) [12]. Given that FOXE1 expression induces both CCL2 and CSF1, together with other chemoattractants, in thyroid cells in vitro, we asked if FOXE1 could modulate the oncogenic induction of chemokines and hence the infiltration of thyroid cancer by TAMs in vivo. To answer this question, we used a FOXE1+/+ and FOXE1+/- BRAFV600E-dependent thyroid cancer mouse model (BRAF) to induce thyroid cancer in the presence of reduced FOXE1 expression [20]. Mice were treated with doxycycline for one week to develop thyroid cancer [19], and the expression levels of CCL2, CSF-1, LGALS3BP, INPP5D and CCL7, together with that of the chemokine receptors CCR2 and CSF1R, were measured in cancer specimens by quantitative RT-PCR. Tumours developed in BRAF FOXE1+/- background showed significantly reduced expression of all the genes investigated compared with those developed in BRAF FOXE1+/+ mice (Figure 4A,B). In this cancer model, it is known that BRAFV600E activation induces a robust recruitment of M2-polarised TAMs [12]. Tumour infiltration by TAMs was then evaluated on thyroid cancer sections by immunohistochemistry (IHC) for the macrophage markers IBA1 and for GALECTIN-3, this latter being described to regulate alternative macrophage activation towards an M2 pro-tumourigenic state [27,28,29][27][28][29]. As shown in Figure 4C,D, both markers show reduced staining in the BRAF FOXE1+/- cancer samples with respect to the BRAF FOXE1+/+ ones. The expression of two additional M2-related markers, ARGINASE1 (ARG) and INTERLEUKINE10 (IL10) [30[30][31],31], was measured to further evaluate if the reduction of FOXE1 levels could affect the abundance of this macrophage subpopulation within the tumour. BRAF FOXE1+/- cancers showed a weaker expression of both M2 markers with respect to the BRAF FOXE1+/+ ones (Figure 4E). Since cancer-associated fibroblasts (CAFs), together with TAMs, are the main components of the tumour stroma, we looked at α-SMA expression as a CAFs-specific marker. IHC for α-SMA reveals that reducing FOXE1 levels in BRAFV600E-induced thyroid cancer decreases the CAFs stromal expansion observed in FOXE1 wild type background (Figure 4F). As control, we analysed WT and FOXE1+/- mice, that do not develop cancer because they are not transgenic for BRAFV600E [20], observing no statistically significant differences in the expression of chemokines and their receptors (Figure S2A) or in IHC staining for IBA1 (Figure S2B,C).
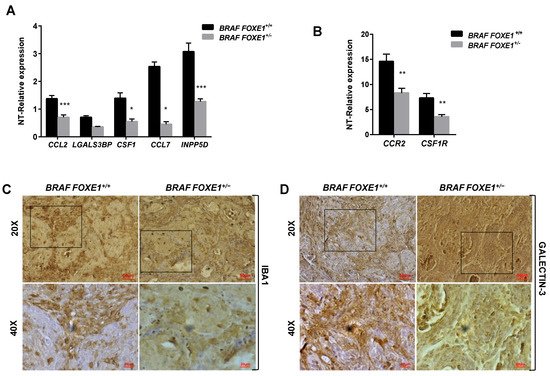
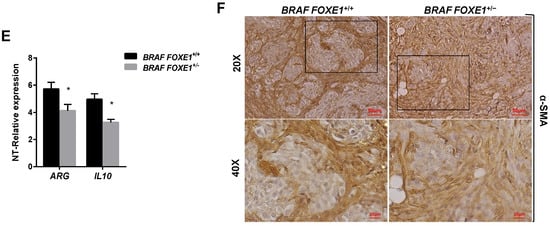
Figure 4. FOXE1 modulates macrophage recruitment in vivo. (A) BRAF FOXE1+/+ and BRAF FOXE1+/- mice were treated with doxycycline for one week to induce BRAFV600E-dependent thyroid cancer. RNA was isolated from pools of thyroids with the same genotype and treatment. Macrophage-related genes and (B) CCR2 and CSF1R expression was analysed by quantitative RT-PCR, and the results are reported as the fold change of BRAF FOXE1+/+- and BRAF FOXE1+/--treated groups on the respective untreated group. * p < 0.05, ** p < 0.01; *** p < 0.001. (C) Thyroid sections were analysed by immunohistochemical staining for macrophage markers IBA1 and (D) GALECTIN3. Nuclei are stained with haematoxylin. 20× (upper panels) and 40× (lower panels) of the 20× boxed area, magnifications are shown. (E) Expression analysis of M2 macrophage subpopulation markers ARGINASE1 (ARG) and INTERLEUKINE10 (IL10) on the same samples as in A. * p < 0.05. (F) Immunohistochemical analysis of α-SMA in thyroid sections from BRAF FOXE1+/+ and BRAF FOXE1+/- doxycycline-treated mice. Nuclei are stained with haematoxylin. 20X (upper panel) and 40X (lower panels) of the area boxed in 20× magnifications are shown. The images are representative of six different images.
References
- Kitahara, C.M.; Sosa, J.A. The changing incidence of thyroid cancer. Nat. Rev. Endocrinol. 2016, 12, 646–653.
- Douglas, E.H.; Rhoads, A.; Thomas, A.; Aloi, J.; Suhl, J.; Lycan, T., Jr.; Oleson, J.; Conway, M.K.; Klubo-Gwiezdzinska, J.; Lynch, C.F.; et al. Incidence and Survival in Reproductive-Aged Women with Differentiated Thyroid Cancer: United States SEER 18 2000–2016. Thyroid 2020, 30, 1781–1791.
- Rahbari, R.; Zhang, L.; Kebebew, E. Thyroid cancer gender disparity. Future Oncol. 2010, 6.
- Handkiewicz-Junak, D.; Czarniecka, A.; Jarzab, B. Molecular prognostic markers in papillary and follicular thyroid cancer. Current status and future directions. Mol. Cell. Endocrinol. 2010, 322, 8–28.
- Kim, S.; Cho, S.W.; Min, H.S.; Kim, K.M.; Yeom, G.Y.; Kim, E.Y.; Lee, K.E.; Yun, Y.G.; Park, D.J.; Park, Y.J. The Expression of Tumor-Associated Macrophages in Papillary Thyroid Carcinoma. Endocrinol. Metab. 2013, 28, 192–198.
- Qing, W.; Fang, W.Y.; Ye, L.; Shen, L.Y.; Zhang, X.F.; Fei, X.C.; Chen, X.; Wang, W.Q.; Li, X.Y.; Xiao, J.C.; et al. Density of tumor-associated macrophages correlates with lymph node metastasis in papillary thyroid carcinoma. Thyroid 2012, 9, 905–910.
- Jung, K.Y.; Cho, S.W.; Kim, Y.A.; Kim, D.; Oh, B.C.; Park, D.J.; Park, Y.J. Cancers with Higher Density of Tumor-Associated Macrophages Were Associated with Poor Survival Rates. J. Pathol. Transl. Med. 2015, 49, 318–324.
- Ryder, M.; Ghossein, R.A.; Ricarte-Filho, J.C.; Knauf, J.A.; Fagin, J.A. Increased density of tumor-associated macrophages is associated with decreased survival in advanced thyroid cancer. Endocr. Relat. Cancer 2008, 15, 1069–1074.
- Caillou, B.; Talbot, M.; Weyemi, U.; Pioche-Durieu, C.; Al Ghuzlan, A.; Bidart, J.M.; Chouaib, S.; Schlumberger, M.; Dupuy, C. Tumor-associated macrophages (TAMs) form an interconnected cellular supportive network in anaplastic thyroid carcinoma. PLoS ONE 2011, 6, e22567.
- Komohara, Y.; Jinushi, M.; Takeya, M. Clinical significance of macrophage heterogeneity in human malignant tumors. Cancer Sci. 2014, 105, 1–8.
- Mantovani, A.; Sozzani, S.; Locati, M.; Allavena, P.; Sica, A. Macrophage polarization: Tumor-associated macrophages as a paradigm for polarized M2 mononuclear phagocytes. Trends Immunol. 2002, 23, 549–555.
- Ryder, M.; Gild, M.; Hohl, T.M.; Pamer, E.; Knauf, J.; Ghossein, R.; Joyce, J.A.; Fagin, J.A. Genetic and pharmacological targeting of CSF-1/CSF-1R inhibits tumor-associated macrophages and impairs BRAF-induced thyroid cancer progression. PLoS ONE 2013, 8, e54302.
- Ohno, S.; Suzuki, N.; Ohno, Y.; Inagawa, H.; Soma, G.I.; Inoue, M. Tumor-associated macrophages: Foe or accomplice of tumors? Anticancer Res. 2003, 23, 4395–4409.
- He, H.; Li, W.; Liyanarachchi, S.; Jendrzejewski, J.; Srinivas, M.; Davuluri, R.V.; Nagy, R.; de la Chapelle, A. Genetic predisposition to papillary thyroid carcinoma: Involvement of FOXE1, TSHR, and a novel lincRNA gene, PTCSC2. J. Clin. Endocrinol. Metab. 2015, 100, E164–E172.
- Tomaz, R.A.; Sousa, I.; Silva, J.G.; Santos, C.; Teixeira, M.R.; Leite, V.; Cavaco, B.M. FOXE1 polymorphisms are associated with familial and sporadic nonmedullary thyroid cancer susceptibility. Clin. Endocrinol. 2012, 77, 926–933.
- Somuncu, E.; Karatas, A.; Ferahman, S.; Saygili, N.; Yilmaz, E.; Ozturk, O.; Kapan, M. The investigation of foxe1 variations in papillary thyroid carcinoma. Int. J. Clin. Exp. Pathol. 2015, 8, 13458–13464.
- Takahashi, M.; Saenko, V.A.; Rogounovitch, T.I.; Kawaguchi, T.; Drozd, V.M.; Takigawa-Imamura, H.; Akulevich, N.M.; Ratanajaraya, C.; Mitsutake, N.; Takamura, N.; et al. The FOXE1 locus is a major genetic determinant for radiation-related thyroid carcinoma in Chernobyl. Hum. Mol. Genet. 2010, 19, 2516–2523.
- Landa, I.; Ruiz-Llorente, S.; Montero-Conde, C.; Inglada-Perez, L.; Schiavi, F.; Leskela, S.; Pita, G.; Milne, R.; Maravall, J.; Ramos, I.; et al. The variant rs1867277 in FOXE1 gene confers thyroid cancer susceptibility through the recruitment of USF1/USF2 transcription factors. PLoS Genet. 2009, 5, e1000637.
- Chakravarty, D.; Santos, E.; Ryder, M.; Knauf, J.A.; Liao, X.H.; West, B.L.; Bollag, G.; Kolesnick, R.; Thin, T.H.; Rosen, N.; et al. Small-molecule MAPK inhibitors restore radioiodine incorporation in mouse thyroid cancers with conditional BRAF activation. J. Clin. Investig. 2011, 121, 4700–4711.
- Credendino, S.C.; Moccia, C.; Amendola, E.; D’Avino, G.; Di Guida, L.; Clery, E.; Greco, A.; Bellevicine, C.; Brunetti, A.; De Felice, M.; et al. Foxe1 Gene Dosage Affects thyroid Cancer Histology and Differentiation in Vivo. Int. J. Mol. Sci. 2020, 22, 25.
- Ambesi-Impiombato, F.S.; Coon, H.G. Thyroid cells in culture. Int. Rev. Cytol. 1979, 10, 163–172.
- De Felice, M.; Ovitt, C.; Biffali, E.; Rodriguez-Mallon, A.; Arra, C.; Anastassiadis, K.; Macchia, P.E.; Mattei, M.G.; Mariano, A.; Scholer, H.; et al. A mouse model for hereditary thyroid dysgenesis and cleft palate. Nat. Genet. 1998, 19, 395–398.
- Morillo-Bernal, J.; Fernández, L.P.; Santisteban, P. FOXE1 regulates migration and invasion in thyroid cancer cells and targets ZEB1. Endocr. Relat. Cancer 2020, 27, 137–151.
- Dobranowski, P.; Sly, L.M. SHIP negatively regulates type II immune responses in mast cells and macrophages. J. Leukoc. Biol. 2018, 103, 1053–1064.
- Loimaranta, V.; Hepojoki, J.; Laaksoaho, O.; Pulliainen, A.T. Galectin-3-binding protein: A multitask glycoprotein with innate immunity functions in viral and bacterial infections. J. Leukoc. Biol. 2018, 104, 777–786.
- Pauls, S.D.; Marshall, A.J. Regulation of immune cell signaling by SHIP1: A phosphatase, scaffold protein, and potential therapeutic target. Eur. J. Immunol. 2017, 47, 932–945.
- MacKinnon, A.C.; Farnworth, S.L.; Hodkinson, P.S.; Henderson, N.C.; Atkinson, K.M.; Leffler, H.; Nilsson, U.J.; Haslett, C.; Forbes, S.J.; Sethi, T. Regulation of alternative macrophage activation by galectin-3. J. Immunol. 2008, 180, 2650–2658.
- Ohsawa, K.; Imai, Y.; Kanazawa, H.; Sasaki, Y.; Kohsaka, S. Involvement of Iba1 in membrane ruffling and phagocytosis of macrophages/microglia. J. Cell Sci. 2000, 113 Pt 17, 3073–3084.
- Sano, H.; Hsu, D.K.; Apgar, J.R.; Yu, L.; Sharma, B.B.; Kuwabara, I.; Izui, S.; Liu, F.T. Critical role of galectin-3 in phagocytosis by macrophages. J. Clin. Investig. 2003, 112, 389–397.
- Chung, H.S.; Lee, B.S.; Ma, J.Y. Ethanol Extract of Mylabris phalerata Inhibits M2 Polarization Induced by Recombinant IL-4 and IL-13 in Murine Macrophages. Evid. Based Complementary Altern. Med. Ecam 2017, 2017, 4218468.
- Zhang, Y.; Choksi, S.; Chen, K.; Pobezinskaya, Y.; Linnoila, I.; Liu, Z.G. ROS play a critical role in the differentiation of alternatively activated macrophages and the occurrence of tumor-associated macrophages. Cell Res. 2013, 23, 898–914.
More