1. Sweat as a Bio-Fluid for Biomonitoring
Sweat can provide abundant biomarker measurements continuously and noninvasively of ions, drugs, metabolites and biomolecules, including potassium, sodium, calcium, chlorine, lactic acid, glucose, ammonia, ethanol, urea, cortisol, and various neuropeptides and cytokines.
Table 1 also summarizes these key analytes in sweat and the detection methods. In addition to the abundant biochemical components in sweat, sweat glands are widely distributed across the human body. Consequently, sweat has become an ideal platform for noninvasive biosensing, which is feasible and safe as well. Sweat from the eccrine sweat gland can be noninvasive and easily obtained. This kind of sweat contains water and various electrolytes and can be directly excreted to the skin surface. Unusual health conditions (such as electrolyte imbalances and stress) and disease are usually reflected by changes in the concentration of existing sweat components or the emergence of new components in sweat. For example, the concentration of alcohol in sweat is highly correlated with the concentration of alcohol in the blood. The increase of urea concentration in sweat may be related to kidney failure. Moreover, because the concentration of chlorine in the sweat of patients who have cystic fibrosis (CF) is abnormally high, the analysis of chlorine in sweat has been regarded as a widely used method for the diagnosis of CF [1].
also summarizes these key analytes in sweat and the detection methods. In addition to the abundant biochemical components in sweat, sweat glands are widely distributed across the human body. Consequently, sweat has become an ideal platform for noninvasive biosensing, which is feasible and safe as well. Sweat from the eccrine sweat gland can be noninvasive and easily obtained. This kind of sweat contains water and various electrolytes and can be directly excreted to the skin surface. Unusual health conditions (such as electrolyte imbalances and stress) and disease are usually reflected by changes in the concentration of existing sweat components or the emergence of new components in sweat. For example, the concentration of alcohol in sweat is highly correlated with the concentration of alcohol in the blood. The increase of urea concentration in sweat may be related to kidney failure. Moreover, because the concentration of chlorine in the sweat of patients who have cystic fibrosis (CF) is abnormally high, the analysis of chlorine in sweat has been regarded as a widely used method for the diagnosis of CF [74].
Table 1.
Key analytes in sweat and the related detection methods.
| Target Analyte |
Concentration in Sweat |
Recognition Element |
Sensing Modality |
Ref. |
| Ions |
Na+ |
10–100 mM |
Na+ |
Potentiometry |
[2][3][4][44,45,93] |
| Cl− |
10–100 mM |
Ag/AgCl |
Potentiometry |
[4][93[5],94] |
| K+ |
1–18.5 mM |
K+ |
Potentiometry |
[2][5][44,94] |
| Ca2+ |
0.41–12.4 mM |
Ca2+ |
Potentiometry |
[6][95] |
| pH |
3–8 |
Polyaniline |
Potentiometry |
[7][96] |
| NH4+ |
0.1–1 mM |
NH4+ |
Potentiometry |
[8][97] |
| Zn2+ |
100–1560 μg L−1 |
Bi |
Square wave stripping voltammetry |
[9][84[10],98] |
| Cd2+ |
<100 μg L−1 |
Bi |
Square wave stripping voltammetry |
[10][98] |
| Pb2+ |
<100 μg L−1 |
Bi, Au |
Square wave stripping voltammetry |
[10][98] |
| Cu2+ |
100–1000 μg L−1 |
Au |
Square wave stripping voltammetry |
[10][98] |
| Hg+ |
<100 μg L−1 |
Au |
Square wave stripping voltammetry |
[10][98] |
| Drugs |
Levodopa |
<10 μM |
Au |
Chronoamperometry |
[11][99] |
| Caffeine |
<40 μM |
Carbon |
Chronoamperometry |
[12][100] |
| Alcohol |
2.5–22.5 mM |
Carbon |
Chronoamperometry |
[13][14][81,101] |
| Metabolites |
Glucose |
10–200 μM |
Glucose oxidase |
Chronoamperometry |
[2][4][15][44,93,102] |
| Lactate |
5–20 mM |
Lactate oxidase |
Chronoamperometry |
[7][96] |
| Uric acid |
2–10 mM |
Carbon |
Cyclic voltammetry |
[16][83] |
| Cortisol |
8–140 μg L−1 |
ZnO, MoS2 |
Electrochemical impedance spectroscopy |
[17][85[18],86] |
| Ascorbic acid |
10–50 μM |
Carbon |
Chronoamperometry |
[16][19][83,87] |
| Biomolecules |
Peptides |
0.1 pM–0.1 μM |
Au |
Chronoamperometry |
[20][103] |
| Antimicrobial peptides |
- |
Carbon |
Resistance |
[21][79] |
2. Sweat-Based Wearable Bioelectronics
Wearable sweat-based sensors have been studied extensively recently for detecting analytes as they relate to human diseases and conditions. A few studies have also developed wearable devices with multi-analyte sensing and circuitry for in-situ analysis and calibration. In this section, we present some of these studies that illustrate the application directions of wearable technology, including health monitoring and disease detection, exercise monitoring, drug metabolism monitoring, and ethanol level measurement.
2.1. Health Monitoring and Disease Detection
The molecular-level view of health is extremely valuable for health and disease monitoring applications. Sweat-based biosensors provide an effective way to achieve health monitoring and disease detection. For example, diabetes is directly related to the metabolite profile of glucose, which can be easily detected through sweat [2][10]. A sweat-based glucose monitoring system was developed using an electrochemical monolithic glucose sensor with pH and temperature correction functions [22]. The device can sense glucose levels in sweat in real time and even includes a drug that uses microneedles to regulate blood glucose. Although continuous blood glucose monitoring is becoming available, the potential of sweat sampling blood glucose monitors can not only reduce the size of current equipment but also achieve painless treatment of diabetes.
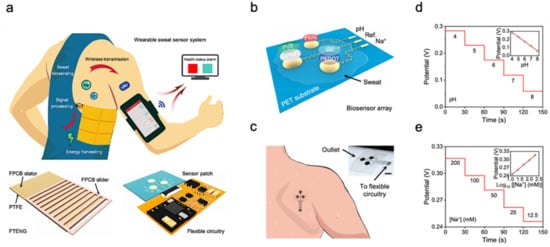
The molecular-level view of health is extremely valuable for health and disease monitoring applications. Sweat-based biosensors provide an effective way to achieve health monitoring and disease detection. For example, diabetes is directly related to the metabolite profile of glucose, which can be easily detected through sweat [44,98]. A sweat-based glucose monitoring system was developed using an electrochemical monolithic glucose sensor with pH and temperature correction functions [53]. The device can sense glucose levels in sweat in real time and even includes a drug that uses microneedles to regulate blood glucose. Although continuous blood glucose monitoring is becoming available, the potential of sweat sampling blood glucose monitors can not only reduce the size of current equipment but also achieve painless treatment of diabetes. Figure 1a shows a wearable molecular level health monitoring tool developed by researchers at Caltech which is self-powered by human motion [23]. The developed device was powered by a flexible triboelectric nanogenerator (TENG) [24][25][26][27][28][29][30]. It measures Na
a shows a wearable molecular level health monitoring tool developed by researchers at Caltech which is self-powered by human motion [107]. The developed device was powered by a flexible triboelectric nanogenerator (TENG) [108,109,110,111,112,113,114]. It measures Na +
and pH of sweat using a potentiometric sensing technique, performs signal processing, and transmits this data to a mobile user interface using Bluetooth to track real-time personal health state.
Figure 1b shows the schematic of a biosensor array containing both pH and sodium ion sensors patterned on a flexible plythylene terephthalate (PET) substrate [6]. The whole design is achieved in a wearable format by integrating it onto a flexible printed circuit board (PCB) that can be worn on the arm or the side of the human torso, as shown in
b shows the schematic of a biosensor array containing both pH and sodium ion sensors patterned on a flexible plythylene terephthalate (PET) substrate [95]. The whole design is achieved in a wearable format by integrating it onto a flexible printed circuit board (PCB) that can be worn on the arm or the side of the human torso, as shown in Figure 1
c. To realize the self-powering device, the authors developed a flexible TENG that can easily be integrated with the rest of the design. TENG bases on the principle of contact electrification and develops a potential difference between plates due to relative sliding between the copper and polytetrafluoroethylene plates. This helps the device power itself by harvesting energy from biomechanical energy induced by human motion. The developed TENG in this device manages to achieve a maximum power output of 0.94 mW for a 4.7 MΩ load, which is very suitable for wearable applications (
Figure 1
d,e). These results suggest that the device developed can be successfully used in molecular-level pH and Na
+ monitoring [5][31]. Additionally, using a TENG to power the device itself enables it to achieve a very small form factor as it doesn’t use bulky batteries. It paves the way for developing innovative self-powering approaches for wearable devices used in human health monitoring.
monitoring [94,115]. Additionally, using a TENG to power the device itself enables it to achieve a very small form factor as it doesn’t use bulky batteries. It paves the way for developing innovative self-powering approaches for wearable devices used in human health monitoring.
Figure 1.
Sweat-based sensors for continuous health monitoring. (
a
) Describes the working of the device and shows the developed FTENG to power device. (
b
) Schematic of the sensor array. (
c
) Schematic of microfluidic sensor patch. (
d
,
e
) Open-circuit potential responses of the pH sensor in standard Mcllvaine’s buffer solutions (
d
) and a sodium ion sensor in NaCl solutions (
e). Reproduced with permission from ref. [23], Copyright from 2020, the American Association for the Advancement of Science.
). Reproduced with permission from ref. [107], Copyright from 2020, the American Association for the Advancement of Science.
Beyond health monitoring, sweat-based sensors can also provide low-cost disease detection and diagnosis. A wearable device was reported for the diagnosis of CF [4]. CF is a kind of hereditary disease which can cause severe damage to the human lungs, digestive system, and other organs. It makes secretions sticky by affecting cells that produce mucus, sweat and digestive juice. These viscous secretions no longer act as lubricants of the passage, but block the tube, catheter, and passageway, especially in the lungs and pancreas, causing serious damage to the human body. This leads to symptoms such as damaged airways, chronic infections, and in serious cases, even respiratory failure. According to the Cystic Fibrosis Foundation Patient Registry, more than 70,000 people worldwide are living with CF. Therefore, CF is a very serious disease that needs to be regularly monitored. The system-level implementation of the developed system is shown in
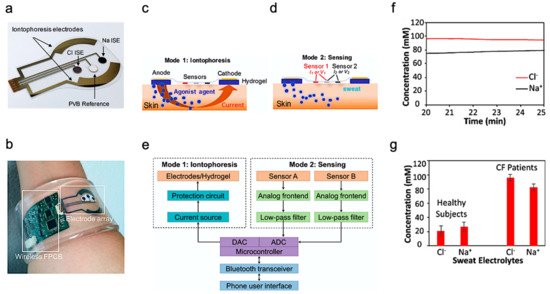
Beyond health monitoring, sweat-based sensors can also provide low-cost disease detection and diagnosis. A wearable device was reported for the diagnosis of CF [93]. CF is a kind of hereditary disease which can cause severe damage to the human lungs, digestive system, and other organs. It makes secretions sticky by affecting cells that produce mucus, sweat and digestive juice. These viscous secretions no longer act as lubricants of the passage, but block the tube, catheter, and passageway, especially in the lungs and pancreas, causing serious damage to the human body. This leads to symptoms such as damaged airways, chronic infections, and in serious cases, even respiratory failure. According to the Cystic Fibrosis Foundation Patient Registry, more than 70,000 people worldwide are living with CF. Therefore, CF is a very serious disease that needs to be regularly monitored. The system-level implementation of the developed system is shown in Figure 2
a,b. The working process of the device is described as follows—iontophoresis is used to induce sweat with various secretion profiles as depicted in Mode 1, which is then used for real-time sensing by the front-end electronics depicted in Mode 2 (
Figure 2
c,d). The processed signal is then transmitted to the communication module of the circuit, which sends the concentration data to the phone and displays it in a format that is easily understood by the user. The flow for signal processing is shown in
Figure 2
e. In this way, the system can measure the levels of sodium ion and chloride ion in the sweat of CF patients stimulated by iontophoresis in real-time (
Figure 2
f).
Figure 2
g shows the comparison results of sweat electrolyte levels achieved by the paper between six healthy subjects and three CF patients.
Figure 2.
Overview of the developed CF monitoring device. (
a
) Electrodes used for iontophoresis and sensing. (
b
) Flexible wearable device on user’s wrist. (
c
,
d
) Description of the working modes of system (
c
) mode 1: Iontophoresis (
d
) mode 2: Sensing. (
e
) Block-level diagram of the developed system. (
f
) Real-time on-body measurement of sweat sodium ion and chloride ion levels of a CF patient after iontophoresis-based sweat stimulation. (
g) Comparison of sweat electrolyte levels between six healthy subjects and three CF patients. Reproduced with permission from ref. [4], Copyright 2017, National Academy of Sciences USA.
) Comparison of sweat electrolyte levels between six healthy subjects and three CF patients. Reproduced with permission from ref. [93], Copyright 2017, National Academy of Sciences USA.
The results from the above study indicate its potential for use as a low-cost diagnosis of CF. Additionally, the demonstration of successfully integrating the design on a flexible substrate opens a plethora of possibilities for the development of wearable bioelectronics for disease diagnosis and monitoring.
2.2. Exercise Monitoring
The most common application of wearable sweat biosensors is exercise monitoring. In the study of Gao et al., a wearable sensor array was introduced where several analytes could be monitored at the same time. The sensor used a flexible integrated sensing array (FISA) and the signal was processed by a flexible PCB (FPCB) [2]. The integrated FISA and FPCB are displayed and function on a subject’s head and wrist, as shown in
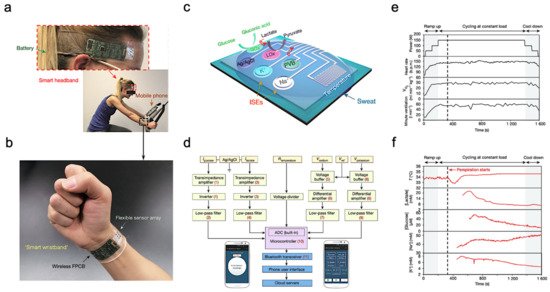
The most common application of wearable sweat biosensors is exercise monitoring. In the study of Gao et al., a wearable sensor array was introduced where several analytes could be monitored at the same time. The sensor used a flexible integrated sensing array (FISA) and the signal was processed by a flexible PCB (FPCB) [44]. The integrated FISA and FPCB are displayed and function on a subject’s head and wrist, as shown in Figure 3
a,b. These sensors need to bear the stresses of everyday wearing and physical exercise. Upon bending FPCB at 1.5 cm and 3 cm bending radii, minimal change in output was observed in FISA response.
Figure 3.
Sweat-based sensors for exercise monitoring. (
a
) Subject wearing forehead and wrist sensors undergoing stationary exercise. (
b
) Flexible integrated sensor array shown on a subject’s wrist as part of a wireless FPCB. (
c
) Schematic of the sensor array. (
d
) System-level block diagram illustrating the flow of information. (
e
) Real-time sweat analysis results of the FISA worn on a subject’s forehead. (
f) Constant-load exercise at 150 W: power output, heart rate (in beats per minute, b.p.m.), oxygen consumption and pulmonary minute ventilation, as measured by external monitoring systems. Reproduced with permission from ref. [2], Copyright from 2016, Nature Publishing Group.
) Constant-load exercise at 150 W: power output, heart rate (in beats per minute, b.p.m.), oxygen consumption and pulmonary minute ventilation, as measured by external monitoring systems. Reproduced with permission from ref. [44], Copyright from 2016, Nature Publishing Group.
Figure 3
c illustrates the structural design and working mechanism of the sensor. The working principle of Amperometric glucose and lactate sensors is immobilizing glucose oxidase and lactate oxidase inside a permeable membrane. Both the shared reference electrode and the counter electrode of the two sensors use Ag/AgCl as the electrode. Current signals proportional to the corresponding metabolites will be generated through these enzymatic sensors automatically and transported between the working electrode and the Ag/AgCl electrode. Ion-selective electrodes (ISEs) were used to measure the Na
+
and K
+
levels. The ion-selective electrode is a type of potentiometric device that combines with a reference electrode coated with polyvinyl butyral (PVB) to stabilize the potential in solutions with different ionic strengths. In addition, a resistance-based temperature sensor is achieved through the fabrication of Cr/Au microwires.
Figure 3
d shows the measured potentiometric data is transmitted through an amplifier, an inverter, an analog-to-digital converter, and a Bluetooth module to be displayed on a cellphone. The sensor was tested on a subject undergoing a stationary cycling exercise as shown in
Figure 3
a. Specifically, the exercise program includes 3 min of accelerated cycling, 20 min of fixed 150 W cycling, and 3 min of cooling down. During exercise, heart rate, oxygen consumption, and pulmonary ventilation were measured. It showed that the values of the measured data increased in proportion with the increase of output power.
Figure 3
e illustrates the real-time measurement of sweat on a subject’s forehead using FISA. It shows that the skin temperature increases at about 400 s and stays almost unchanged after that with continuous perspiration. Meanwhile, lactic acid and glucose concentrations in sweat gradually decrease, as shown in
Figure 3
f. This decrease in lactic acid and glucose can be attributed to the dilution effect caused by the increased per-spiration rate.
Unlike typical use of polymeric substrates, a textile-based platform can increase overall permeability to the affected skin area, which cultivates natural sweating and evaporative cooling [32]. This sensor is constructed from different layers of materials, as shown in
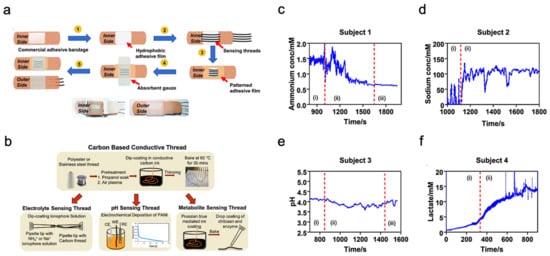
Unlike typical use of polymeric substrates, a textile-based platform can increase overall permeability to the affected skin area, which cultivates natural sweating and evaporative cooling [116]. This sensor is constructed from different layers of materials, as shown in Figure 4
a. A commercial adhesive bandage is used as the base for the sensor, then a hydrophobic adhesive film is placed above to retain sweat samples within the patch. Additionally, specialized sensing threads are implemented in a parallel pattern to the previous layer. An absorbent gauze is applied to further enhance the collection of the sweat sample. Eventually, an adhesive film is placed on top to keep the entire patch intact.
Figure 4.
Sweat-based multimodal sensor patch for exercise monitoring. (
a
) Step-by-step process of fabrication and complete sensor patch prototype. (
b
) Fabrication of specialized sensing threads. (
c
–
f) Measurement results of different biomarkers. Reproduced with permission from ref. [32], Copyright from 2020, Nature Publishing Group.
) Measurement results of different biomarkers. Reproduced with permission from ref. [116], Copyright from 2020, Nature Publishing Group.
The thread bundle incorporated within the sensor patch contains two specialized thread types for analyzing the biomarkers within the sweat sample. These specialized threads are commonly available threads that have undergone additional treatments and processes; the specific fabrication details of the threads are shown in
Figure 4
b. The first thread type in discussion is a carbon-based conductive thread that can sense the electrolyte, pH, and metabolite levels within the sweat sample. These measurements directly relate to biomarkers such as sodium, lactate, and ammonium which can represent real-time physiological status of an individual undergoing strenuous physical activity. The second thread type is a silver-silver chloride thread that acts as a solid-state reference for comparison during analysis. The four graphs shown in
Figure 4
c–f displayed the sensor patch performance when applied onto a participant’s arm while exercising on a stationary bike. Each graph is sectioned by Roman numerals with ”1” as equilibrium state, ”2” as real-time measurement, and ”3” as cool-down period. The results demonstrate the consistency and stability of the sensor patch in collecting data from the biomarkers within the sweat sample.
2.3. Drug Metabolism Monitoring
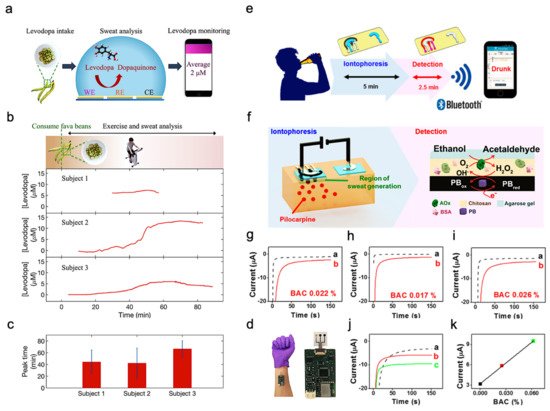
In addition to exercise intensity monitoring, wearable sweat-based sensors for bio-marks monitoring can also be applied as drug metabolism monitoring sensors. For example, Levodopa is used to treat patients suffering from Parkinson’s disease. Various factors can affect an individual’s response to levodopa and therefore it is important to monitor the concentration in blood. Since blood-based monitoring is usually invasive, sweat-based levodopa sensing was investigated using a sensor packaged into a sweatband (S-band) [11]. The sensor has a standard three-electrode (working electrode, reference electrode and counter electrode) design and is fabricated on a PET substrate (
In addition to exercise intensity monitoring, wearable sweat-based sensors for bio-marks monitoring can also be applied as drug metabolism monitoring sensors. For example, Levodopa is used to treat patients suffering from Parkinson’s disease. Various factors can affect an individual’s response to levodopa and therefore it is important to monitor the concentration in blood. Since blood-based monitoring is usually invasive, sweat-based levodopa sensing was investigated using a sensor packaged into a sweatband (S-band) [99]. The sensor has a standard three-electrode (working electrode, reference electrode and counter electrode) design and is fabricated on a PET substrate ( Figure 5
a). Experiments were performed on healthy subjects after consuming fava beans as they happen to contain levodopa. In this way, the function of the S-band can be extensively tested on non-vulnerable subjects, and sweat was elicited from the subjects using iontophoresis. The concentration of levodopa in sweat was continuously monitored after consumption of fava beans and followed by iontophoresis. The S-band can detect the level of levodopa in sweat continuously, which is similar to the level in blood.
Figure 5.
Drug sensing mechanism and ethanol levels measurement. (
a
) Interaction of the sensor with sweat. (
b
) Cycling and sweat analysis. Examples of sweat levodopa concentrations for three different subjects after they consume 450 g of fava beans. (
c
) Averaged time of peak levodopa concentration for three different subjects across multiple exercise trials. (
d) Optical image of the S-band worn on a subject’s wrist. Reproduced with permission from ref. [11], Copyright from 2019, American Chemical Society. (
) Optical image of the S-band worn on a subject’s wrist. Reproduced with permission from ref. [99], Copyright from 2019, American Chemical Society. ( e
) Sweat ethanol sensor used to send alerts to a smart device. (
f
) Schematic diagram of constituents in the iontophoretic system (left) and of the reagent layer and processes involved in the amperometric sensing of ethanol on the working electrode (right). (
g
–
i
) Experiments with consumption of 12 oz of beer measured from three different human subjects before (plot “a”) and after drinking alcohol beverage (plot “b”). (
j
) Chronoamperograms obtained from a: BAC 0%, b: BAC 0.025% and c: BAC 0.062%. (
k) Correlation between current response and the BAC level. Reproduced with permission from ref. [14], Copyright from 2016, American Chemical Society.
) Correlation between current response and the BAC level. Reproduced with permission from ref. [101], Copyright from 2016, American Chemical Society.
Sweating caused by iontophoresis lasts only for a very limited time period, while that caused by exercise generally lasts longer. This is helpful in the experimentation and validation of these sensors.
Figure 5
b shows the response observed from three subjects exercising on a stationary ergometer. In each trial, a subject would consume 450 g of fava beans and undergo multiple exercise trials. Cumulative results are shown in
Figure 5
c, depicting the average time of peak concentration. By analyzing the sweat induced by physical activities and iontophoresis, it is possible to optimize the dose of drugs by monitoring drug metabolism.
Figure 5
d shows the sensor apparatus mounted on a subject’s wrist. The future development directions include the study of pharmacodynamics between drugs, prolonging the duration of iontophoresis sweating, and improving the lifetime of the electrode. As a result, S-band can be used to study the inherent complex drug profiles, optimize drug dosages for people with Parkinson’s disease, and be incorporated into drug delivery systems.
2.4. Ethanol Levels Measurement
Sweat ethanol levels are an indicator of blood alcohol concentration. Ethanol levels were measured using a sweat-based sensor in tattoo form [14].
Sweat ethanol levels are an indicator of blood alcohol concentration. Ethanol levels were measured using a sweat-based sensor in tattoo form [101]. Figure 5
e presents the illustration of a system that uses a sweat ethanol sensor to send alerts to a smart device. A tattoo-like patch based on an enzyme amperometric sweat ethanol sensor was developed with a pilocarpine iontophoresis drug delivery system and connected to intelligent devices through a Bluetooth module. The external current of iontophoresis (0.6 mA) was optimized between the effective delivery of drugs and the comfort of subjects because high current can easily cause skin irritation. The device is more reliable than the commonly used breath meter because it avoids potential errors induced by environmental factors like water vapor, or consumer products like mouthwash. Compared to other transcutaneous devices, it is a faster blood alcohol concentration measurement method because it only takes about 10 min compared with 0.5–2 h on traditional devices. Therefore, it is suggested that ethanol sensors can be used to detect illegal levels of alcohol consumption in car drivers.
This sensor system uses iontophoresis technology with constant current to induce sweat by delivery of the drug pilocarpine through the skin to perform sweat ethanol sensing. The sensor uses an alcohol oxidase enzyme electrode and a printed Prussian blue (PB) electrode transducer. All the electrodes on the wearable temporary tattoo paper are produced by screen printing for mass production and can be removed from the skin easily.
Figure 5
f illustrates these processes starting with iontophoresis followed by amperometric detection. Experiments were performed on three different human subjects using this sensor to validate the response of the system.
Figure 5
g–i shows plots that illustrate the responses of the subjects upon consumption of equal amounts of alcohol. Curve a is the amperometric response before drinking, and curve b is after drinking an alcoholic beverage. The blood alcohol concentrations of these subjects are different due to varying metabolism rates. However, after consuming alcohol, the current change from the sensor is quite apparent. Three control experiments were conducted to make sure there are no false positives.
Figure 5
g shows that zero blood alcohol content (BAC) results in no change in sensor response. And the sensor response after a certain amount of time had elapsed without alcohol consumption. This proves the sensor current response shown was caused by alcohol consumption.
Figure 5
h shows the response if no enzyme is immobilized in the sensor, showing that it is highly specific to sweat ethanol levels.
Figure 5
i shows the sensor response with and without iontophoresis, showing that the method of sweat extraction does not affect the sensor response. Thus, the sensor is highly specific to sweat ethanol levels and does not produce a response with 0 BAC.
Figure 5
j showed the sensor response at different BAC, with (a) being at 0%, (b) at 0.025%, and (c) at 0.062%.
Figure 5
k showed current changes at different BAC.
Additional control experiments were performed to validate the sensor. It has been shown to provide reliable information in real-world settings, which can provide a highly useful instrument to monitor alcohol for road safety. A more interesting implementation could be to fit these devices in such a way that the measured BAC determines whether a vehicle can be started or not. Future systems would involve calibrating the device, ensuring data security, and safeguarding privacy.
2.5. Biomolecules Monitoring
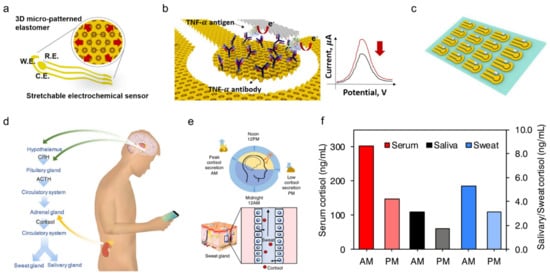
Compared to the three biomarkers mentioned, biomolecules including proteins, cytokines, nucleic acids, or neuropeptides are also important indicators reflecting a subject’s health or infection status. Although they are always present at relatively low concentrations in physiological fluids, they are of great interest for monitoring the chronic wound healing process as well as future diagnosis or management of diseases such as wound healing, Parkinson’s disease, and depression. As an example, a stretchable electrochemical immunosensor was used to detect the protein of the TNF-
α
antibody to monitor wound healing (
Figure 6a) [20]. TNF-
α
was immobilized on the working electrode and detected using a voltammetric technique of differential pulse voltammetry method. Without the addition of TNF-
α
, the Faraday current was recorded at the redox potential that came from the redox of ferricyanide (
Figure 6
b). When TNF-
α
is added, a barrier layer is formed on the surface of the working electrode to inhibit electron transfer to reduce the recorded current. The immunosensor shows decent sensing performance both in buffer solutions with clinical concentration ranges (0.1 pM–0.1 μM) and human serum. Additionally, it can adapt to strains up to 30% due to 3D micro-patterned elastomers as a potential for body-attachable immunosensing (
Figure 6
c).
Figure 6.
Sweat-based sensors for biomolecules monitoring. (
a
) Schematic showing a stretchable chemical immunosensor for TNF-α cytokine sensing. (
b
) Schematic illustration of the TNF-α cytokine proteins immobilized on the working electrode for electrochemical sensing. (
c) Image of fabricated device arrays. Reproduced with permission from ref. [20], Copyright from 2019, Elsevier. (
) Image of fabricated device arrays. Reproduced with permission from ref. [103], Copyright from 2019, Elsevier. ( d
) Schematic illustration of cortisol in sweat and saliva. CRH, corticotropin-releasing hormone; ACTH, adrenocorticotropic hormone. (
e
) Schematic showing the light and dark cycle for regulating circadian rhythm and controlling of cortisol transport to sweat. (
f) Cortisol levels in serum, saliva, and sweat at different times from a healthy subject. Reproduced with permission from ref. [33], Copyright from 2020, Elsevier.
) Cortisol levels in serum, saliva, and sweat at different times from a healthy subject. Reproduced with permission from ref. [27], Copyright from 2020, Elsevier.
Besides, timely and accurate detection of stress is essential for monitoring and managing mental health. Considering that the current questionnaire and other methods are very subjective, a wearable chemical sensor was proposed with a highly sensitive, selective, and miniaturized mHealth device based on a laser flexible graphene sensor to non-invasively monitor the level of the stress hormone of cortisol (
Figure 6
d). It shows a strong correlation between sweat and circulating cortisol and demonstrates that changes in sweat cortisol respond quickly to acute stress stimuli. In addition, it showed a diurnal cycle and sweat cortisol pressure response curve, revealing the potential for dynamic pressure monitoring achieved by the mHealth sensor system (
Figure 6
e). Trends in ante meridiem/post meridiem (AM/PM) cortisol variability modulated by circadian rhythm are observed from a subject with the ratios ranging from 1.35 to 2.00 (
Figure 6f). This platform provides a rapid, reliable, and decentralized health care vigilance at the metabolic level, thereby guiding an accurate snapshot of our physical, mental, and behavioral changes. Other sweat based wearable bioelectronics are also developed to detect pathogenic contamination [34] and antimicrobial peptides [21], and are compatible with the customized display interface for more convenient monitoring of health performance.
f). This platform provides a rapid, reliable, and decentralized health care vigilance at the metabolic level, thereby guiding an accurate snapshot of our physical, mental, and behavioral changes. Other sweat based wearable bioelectronics are also developed to detect pathogenic contamination [117] and antimicrobial peptides [79], and are compatible with the customized display interface for more convenient monitoring of health performance.
