Nowadays, botanical and geographical originality of honey is a major concern among authorities in order to ensure its quality and authenticity, by imposing specific standards that allow honey to be competitive in the market. Traditionally, identification of botanical and geographical origin of honey is performed by melisopalinological analysis. This analysis is a time and cost-consuming process which cannot ensure reliable characterization of the honey floral source since it strongly depends on the capability of the analyzer.
- honey authentication
- SPME
- GC-MS
- IR
- Raman
- chemometrics
- botanical and geographical origin
- adulteration
1. Introduction
The composition of honey depends on collection season, climate conditions, proximity to the forest, characteristics of soil which determine melliferous flora, method of storage, processing, and practices of beekeeping, and even interactions between chemical compounds and enzymes [3,8,9][1][2][3]. However, the aroma and taste of honey, owed to the volatile compounds, are dependent mainly on the botanical and floral origin of honey [9,10,11,12][3][4][5][6].
Nowadays, botanical and geographical originality of honey is a major concern among authorities in order to ensure its quality and authenticity, by imposing specific standards that allow honey to be competitive in the market [3,16][1][7]. Traditionally, identification of botanical and geographical origin of honey is performed by melisopalinological analysis [18,19][8][9]. This analysis is a time and cost-consuming process which cannot ensure reliable characterization of the honey floral source since it strongly depends on the capability of the analyzer [20,21][10][11]. Therefore, it is important to complement this analysis with other, more analytical techniques (physicochemical, organoleptic, chromatographic etc.), or replace it with them. During the past decades, several studies focused on gas chromatography (GC) in order to determine the volatile profile of honey [3,9,11,20,22,23,24,25,26][1][3][5][10][12][13][14][15][16]. The characteristic chemical fingerprint generated by volatile compounds is of major importance regarding consumers’ choice since it provides information about the botanical and geographical origin of honey [27][17].
Another main topic concerning the beekeeping sector, the honey industry, and researchers is the adulteration of honey. According to European Union regulations, the addition or removal of any kind of honey substance is illegal [49][18]. Honey adulteration is achieved by adding lower quality honey and artificial adulterants [50][19]. Honey’s health benefits, and its unique flavor and aroma make it more expensive in comparison to other sweeteners. Therefore, in an attempt to reduce production costs and simultaneously increase profit, honey is a product usually subjected to adulteration [9,15,51][3][20][21]. Starch and inverted syrup fed to bees, addition of sugars such as high fructose, glucose, and saccharose syrups, and low-quality honey added to high-priced honey are considered the most common ways of honey adulteration [15,52][20][22]. Honey adulteration can occur in any step of production or processing. It is also difficult to detect due to the fact that the adulterated honey is similar to the pure one [53][23]. Moreover, the classical methods that certify honey quality, such as physicochemical analyses, are incapable of detecting adulteration accurately. Thus, it is essential to develop and adopt a new process for honey quality control. For the aforementioned reasons, many analytical techniques have been applied, characterized by high effectiveness, accuracy, and sensitivity for the detection of honey adulteration [9][3].
The aim of this work was to present a review (period of 2007–2020) of SPME-GC-MS and spectroscopic techniques in combination with chemometrics for honey authentication. In addition, spectroscopic techniques (IR, Raman) combined with chemometric analysis for the investigation of honey adulteration are briefly discussed.
2. Honey Volatile Compounds Analysis Using SPME-GC-MS
Volatile compounds of honey are related to the floral origin and could be used as biomarkers. SPME followed by GC-MS for determining the volatile profile of honey are used as a tool for the botanical characterization of several different types of honeys [8,11,14,21,27,37,85,86,87,88][2][5][24][11][17][25][26][27][28][29].
Croatian honey samples of Paliurus honey were dominated by nonanal, four isomers of lilac aldehyde, decanal, methyl nonanoate, hexanoic, and 2-ethylhexanoic acids [27][17].
During the past decade, it has been noted that SPME-GC-MS fingerprinting of honey volatiles combined with chemometrics can be considered as non-time and of high potential combination also for routine analyses of honey for their botanical characterization.
Several studies of honey volatile composition that used SPME-GC-MS with chemometrics suggested that their combined usage in order to determine geographical origin of honey is a robust and reliable method of a high predictive ratio.
3. Authentication of Honey Using IR Spectroscopy
Infrared-based spectroscopy can be used for the detection of different adulterants in honey at different ranges of absorption. Chemometrics has been used as an essential tool for chemical fingerprinting of honey ( Table 21 ).
| Type of Spectroscopy | Chemometrics Methods | Type of Adulterants | References |
|---|---|---|---|
| ATR-FTIR | PCA, SIMCA, PLS | Fructose syrup, glucose syrup, sucrose syrup, corn syrup, cane sugar | [97] |
| ATR-FTIR | PCA, DA, PLS | Commercial sugars of aren (Arenga pinnata), coconut, cane sugar | [98] |
| ATR-FTIR and Raman | PCA | Sucrose, reducing sugars | [59] |
| MIR and Raman | PLS, Data fusion | High fructose corn syrup, maltose syrup | [57] |
| NIR | DPLS | High fructose corn syrup | [91] |
| NIR | CARS, PLS- LDA | High fructose corn syrup | [93] |
| NIR | PLS-DA | Glucose syrup, fructose syrup, cheap imported honey | [65] |
| NIR | PCA, PLS | Corn syrup, sucrose syrup, high fructose corn syrup, beet syrup, rice syrup | [94] |
| NIR and MIR | PCA, PLS, DA | Rice syrup, corn syrup | [80] |
| NIR and ATR-FIIR | SVM, Data fusion | Type 1: rice and beet syrup, type 2: high fructose corn syrup, corn syrup, maltose syrup, sucrose syrup | [51] |
| Raman | PCA, PLS, artificial neural network ANN | Glucose, fructose, sucrose, maltose | [58] |
| Raman | Adaptive iteratively reweighted penalized least squares airPLS, PLS, DA | High fructose corn syrup, maltose syrup | [64] |
| Raman | SIMCA | Molasses, date molasses, grape molasses, high fructose corn syrup, corn syrup (dark and light), sucrose, inverted sugar | [63] |
| NIR | HCA, PCA, LDA, PLS | High fructose corn syrup | [55] |
| NIR | HCA, LDA, PLS | Inverted sugar, rice syrup, brown cane sugar, fructose syrup | [50] |
Attenuated total reflectance (ATR)-FTIR spectroscopy coupled with chemometrics was used in a study on stingless bee ( Heterotrigona itama ) honey from Malaysia for its capacity to detect adulteration by five adulterants including fructose, glucose, sucrose, corn syrup, and cane sugar. Applying PCA, all the adulterants were discriminated at the spectral region 1180–750 cm −1 . Especially, the absorption peaks at 1054, 876, and 779 cm −1 were attributed to the increasing percentages of fructose. The characteristic peaks at 1022, 991, and 898 cm −1 were assigned to the presence of glucose, and at 991 and 921 cm −1 to the presence of sucrose. PLSR analysis was also able to quantity honey adulteration in all five cases [97][30]. In another study of honey adulteration with sugar, FTIR spectrometer with an ATR device was applied to honeys produced in different places of Ecuador combined with PCA. This combination showed to be ideal for the quality control of honey [59][31]. The ATR-FTIR technique has been also used alongside chemometrics for the estimation of the adulteration with commercial sugars of aren ( Arenga pinnata ), coconut, and cane sugar of Indonesian honeys. PCA and PLS analyses were applied for differentiation and quantification of the samples, respectively. It was proved that this combination is suitable for the detection of adulteration and measurement of the added sugar at Indonesian honeys [98][32].
Application of vibrational spectroscopic techniques coupled with chemometrics in detection of honey adulteration.
The combination of IR with chemometrics provide satisfactory discrimination and rapid first-line classification of honey based on the botanical and geographical origin.
4. Authentication of Honey Using Raman Spectroscopy
Raman spectroscopy can be successfully used to detect adulteration of honey ( Table 21 ).
Raman technique coupled with multivariate analysis was applied at honeys to identify and quantify sugars (glucose, fructose, maltose, and sucrose contents) and further to characterize them as adulterants. The characteristic spectral bands that correlated to sugars of honey were 314, 341, 415, 530, 617, 744, 776, 790, 838, 856, 911, 933, 1028, and 1106 cm −1 . PCA, partial least squares (PLS), and artificial neural network (ANN) were used to extract differentiation from the spectroscopic data which successfully led to the discrimination of sugar contents in honey [58][33]. Moreover, Raman technique was used by Salvador et al. [59][31] to detect the sugar content and the type of adulteration in commercial honeys of Ecuador. The main observed bands of honeys from Pichincha and Loja provinces were 326, 338, 419, 516, 630, 707, 817, 862, 918, 1062, and 1126 cm −1 . These bands were assigned to the presence of sugar (glucose, fructose, and sucrose) at honey samples. The bands of pure honey at 817 and 862 cm −1 , in the case of adulteration with sucrose, were overlapped with strong absorptions at 822 and 834 cm −1 . Principal component analysis was applied and confirmed the applicability of Raman technique for the detection of adulteration of honey with glucose, fructose, and sucrose.
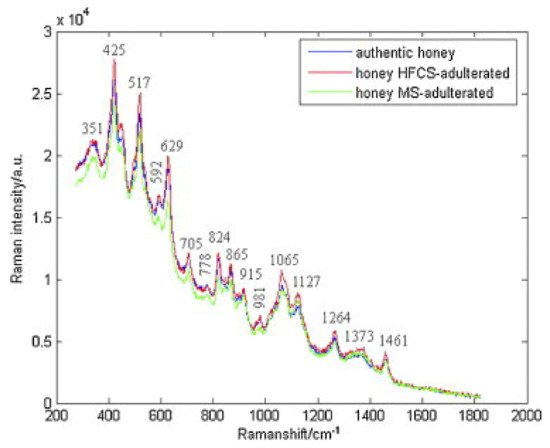
In another study, Raman spectroscopy was also used to detect adulteration of honey with high fructose corn syrup and/or maltose syrup. The characteristic bands corresponding to authentic and adulterated honeys were observed: 351, 425, 517, 592, 629, 705, 778, 824, 865, 915, 981, 1065, 1127, 1264, 1373, and 1461 cm −1 ( Figure 51 ). The spectra data were subjected to adaptive iteratively reweighted penalized least squares (airPLS). Using PLS-LDA, classification of honeys was achieved in both cases of adulterants and in mixtures of them [64][34]. Chemometrics with Raman spectroscopy were successfully employed for the quantification of HFGCS (high fructose syrup) in adulterated honey, as well. At the band of 2791 cm −1 , the absorption was increased by increasing the HFGS concentration, while at 1130 cm −1 , the absorption was reduced due to the decrease in protein and amino acid content in the adulterated honeys. Three data fusion strategies were used and showed high predictability in the adulteration of honey, while the best results were obtained by the high-level data fusion process [57][35].
Raman technique is capable of on-site testing of honey samples to authenticate and verify their label information based on its origin.
References
- Castro-Vázquez, L.; Díaz-Maroto, M.C.; de Torres, C.; Pérez-Coello, M.S. Effect of geographical origin on the chemical and sensory characteristics of chestnut honeys. Food Res. Int. 2010, 43, 2335–2340.
- Ciotlaus, I.; Balea, A.; Pojar-Fenesan, M.; Petean, I. Cromathographic profile of volatiles of multifloral and unifloral honey collected by apis mellifera from Transilvania, Romania. Rev. Chim. 2020, 71, 91–99.
- Devi, A.; Jangir, J.; Anu-Appaiah, K.A. Chemical characterization complemented with chemometrics for the botanical origin identification of unifloral and multifloral honeys from India. Food Res. Int. 2018, 107, 216–226.
- De Lima Morais da Silva, P.; de Lima, L.S.; Caetano, Í.K.; Torres, Y.R. Comparative analysis of the volatile composition of honeys from Brazilian stingless bees by static headspace GC–MS. Food Res. Int. 2017, 102, 536–543.
- Escriche, I.; Visquert, M.; Juan-Borrás, M.; Fito, P. Influence of simulated industrial thermal treatments on the volatile fractions of different varieties of honey. Food Chem. 2009, 112, 329–338.
- Kaškoniene, V.; Venskutonis, P.R.; Čeksteryte, V. Composition of volatile compounds of honey of various floral origin and beebread collected in Lithuania. Food Chem. 2008, 111, 988–997.
- Ballabio, D.; Robotti, E.; Grisoni, F.; Quasso, F.; Bobba, M.; Vercelli, S.; Gosetti, F.; Calabrese, G.; Sangiorgi, E.; Orlandi, M.; et al. Chemical profiling and multivariate data fusion methods for the identification of the botanical origin of honey. Food Chem. 2018, 266, 79–89.
- Patrignani, M.; Fagúndez, G.A.; Tananaki, C.; Thrasyvoulou, A.; Lupano, C.E. Volatile compounds of Argentinean honeys: Correlation with floral and geographical origin. Food Chem. 2018, 246, 32–40.
- Stanimirova, I.; Üstün, B.; Cajka, T.; Riddelova, K.; Hajslova, J.; Buydens, L.M.C.; Walczak, B. Tracing the geographical origin of honeys based on volatile compounds profiles assessment using pattern recognition techniques. Food Chem. 2010, 118, 171–176.
- Castro-Vázquez, L.; Leon-Ruiz, V.; Alañon, M.E.; Pérez-Coello, M.S.; González-Porto, A.V. Floral origin markers for authenticating Lavandin honey (Lavandula angustifolia × latifolia). Discrimination from Lavender honey (Lavandula latifolia). Food Control 2014, 37, 362–370.
- Da Costa, A.C.V.; Sousa, J.M.B.; da Silva, M.A.A.P.; dos Garruti, D.S.; Madruga, M.S. Sensory and volatile profiles of monofloral honeys produced by native stingless bees of the brazilian semiarid region. Food Res. Int. 2018, 105, 110–120.
- Castro-Vázquez, L.; Díaz-Maroto, M.C.; González-Viñas, M.A.; Pérez-Coello, M.S. Differentiation of monofloral citrus, rosemary, eucalyptus, lavender, thyme and heather honeys based on volatile composition and sensory descriptive analysis. Food Chem. 2009, 112, 1022–1030.
- Escriche, I.; Kadar, M.; Juan-Borrás, M.; Domenech, E. Using flavonoids, phenolic compounds and headspace volatile profile for botanical authentication of lemon and orange honeys. Food Res. Int. 2011, 44, 1504–1513.
- Escriche, I.; Sobrino-Gregorio, L.; Conchado, A.; Juan-Borrás, M. Volatile profile in the accurate labelling of monofloral honey. The case of lavender and thyme honey. Food Chem. 2017, 226, 61–68.
- Juan-Borrás, M.; Domenech, E.; Hellebrandova, M.; Escriche, I. Effect of country origin on physicochemical, sugar and volatile composition of acacia, sunflower and tilia honeys. Food Res. Int. 2014, 60, 86–94.
- Soria, A.C.; Martínez-Castro, I.; Sanz, J. Some aspects of dynamic headspace analysis of volatile components in honey. Food Res. Int. 2008, 41, 838–848.
- Jerković, I.; Tuberoso, C.I.G.; Marijanović, Z.; Jelić, M.; Kasum, A. Headspace, volatile and semi-volatile patterns of Paliurus spina-christi unifloral honey as markers of botanical origin. Food Chem. 2009, 112, 239–245.
- WHO; FAO. Codex Alimentarius Commission and Council Directive 2001/110/EC of 20 December 2001 Relating to Honey. In Codex Alimentarius; CXS 12-1981; Codex Alimentarius Commission: Rome, Italy, 2001; pp. 1–8.
- Aliaño-González, M.J.; Ferreiro-González, M.; Espada-Bellido, E.; Palma, M.; Barbero, G.F. A screening method based on Visible-NIR spectroscopy for the identification and quantification of different adulterants in high-quality honey. Talanta 2019, 203, 235–241.
- Aliaño-González, M.J.; Ferreiro-González, M.; Espada-Bellido, E.; Barbero, G.F.; Palma, M. Novel method based on ion mobility spectroscopy for the quantification of adulterants in honeys. Food Control. 2020, 114, 107236.
- Huang, F.; Song, H.; Guo, L.; Guang, P.; Yang, X.; Li, L.; Zhao, H.; Yang, M. Detection of adulteration in Chinese honey using NIR and ATR-FTIR spectral data fusion. Spectrochim. Acta Part A Mol. Biomol. Spectrosc. 2020, 235, 118297.
- Arroyo-Manzanares, N.; García-Nicolás, M.; Castell, A.; Campillo, N.; Viñas, P.; López-García, I.; Hernández-Córdoba, M. Untargeted headspace gas chromatography—Ion mobility spectrometry analysis for detection of adulterated honey. Talanta 2019, 205, 120123.
- Esteki, M.; Simal-Gandara, J.; Shahsavari, Z.; Zandbaaf, S.; Dashtaki, E.; Vander Heyden, Y. A review on the application of chromatographic methods, coupled to chemometrics, for food authentication. Food Control 2018, 93, 165–182.
- Acevedo, F.; Torres, P.; Oomah, B.D.; de Alencar, S.M.; Massarioli, A.P.; Martín-Venegas, R.; Albarral-Ávila, V.; Burgos-Díaz, C.; Ferrer, R.; Rubilar, M. Volatile and non-volatile/semi-volatile compounds and in vitro bioactive properties of Chilean Ulmo (Eucryphia cordifolia Cav.) honey. Food Res. Int. 2017, 94, 20–28.
- Plutowska, B.; Chmiel, T.; Dymerski, T.; Wardencki, W. A headspace solid-phase microextraction method development and its application in the determination of volatiles in honeys by gas chromatography. Food Chem. 2011, 126, 1288–1298.
- Rivellino, S.R.; Hantao, L.W.; Risticevic, S.; Carasek, E.; Pawliszyn, J.; Augusto, F. Detection of extraction artifacts in the analysis of honey volatiles using comprehensive two-dimensional gas chromatography. Food Chem. 2013, 141, 1828–1833.
- Odeh, I.; Abu-Lafi, S.; Dewik, H.; Al-Najjar, I.; Imam, A.; Dembitsky, V.M.; Hanuš, L.O. A variety of volatile compounds as markers in Palestinian honey from Thymus capitatus, Thymelaea hirsuta, and Tolpis virgata. Food Chem. 2007, 101, 1393–1397.
- Pasini, F.; Gardini, S.; Marcazzan, G.L.; Caboni, M.F. Buckwheat honeys: Screening of composition and properties. Food Chem. 2013, 141, 2802–2811.
- Špánik, I.; Pažitná, A.; Šiška, P.; Szolcsányi, P. The determination of botanical origin of honeys based on enantiomer distribution of chiral volatile organic compounds. Food Chem. 2014, 158, 497–503.
- Se, K.W.; Ghoshal, S.K.; Wahab, R.A.; Ibrahim, R.K.R.; Lani, M.N. A simple approach for rapid detection and quantification of adulterants in stingless bees (Heterotrigona itama) honey. Food Res. Int. 2018, 105, 453–460.
- Salvador, L.; Guijarro, M.; Rubio, D.; Aucatoma, B.; Guillén, T.; Jentzsch, P.V.; Ciobotă, V.; Stolker, L.; Ulic, S.; Vásquez, L.; et al. Exploratory monitoring of the quality and authenticity of commercial honey in Ecuador. Foods 2019, 8, 105.
- Riswahyuli, Y.; Rohman, A.; Setyabudi, F.M.C.S.; Raharjo, S. Indonesian wild honey authenticity analysis using attenuated total reflectance-fourier transform infrared (ATR-FTIR) spectroscopy combined with multivariate statistical techniques. Heliyon 2020, 6, e03662.
- Özbalci, B.; Boyaci, I.H.; Topcu, A.; Kadilar, C.; Tamer, U. Rapid analysis of sugars in honey by processing Raman spectrum using chemometric methods and artificial neural networks. Food Chem. 2013, 136, 1444–1452.
- Li, S.; Shan, Y.; Zhu, X.; Zhang, X.; Ling, G. Detection of honey adulteration by high fructose corn syrup and maltose syrup using Raman spectroscopy. J. Food Compos. Anal. 2012, 28, 69–74.
- Li, Y.; Huang, Y.; Xia, J.; Xiong, Y.; Min, S. Quantitative analysis of honey adulteration by spectrum analysis combined with several high-level data fusion strategies. Vib. Spectrosc. 2020, 108, 103060.