Nowadays, botadulterationnical and geographical originality of honey is a major concern among authorities in order to ensure its quality and authenticity, by imposing specific standards that allow the hhoney to be competitive in the market. Traditionally, the identification of adulteratiobotanical and geographical origin of honey is performed by physicochemical methods. However, spectroscopic techniques are considerably more practical when detecting impurities in honey due to fraudulent acts, as these techniques are easy to execute, more rapid, and more reliable than physicochemical methodsmelisopalinological analysis. This analysis is a time and cost-consuming process which cannot ensure reliable characterization of the honey floral source since it strongly depends on the capability of the analyzer.
- honey adulteration
- IR
- Raman
- honey authentication
- SPME
- GC-MS
- chemometrics
- botanical and geographical origin
- adulteration
1. Introduction
The composition of honey depends on collection season, climate conditions, proximity to the forest, characteristics of soil which determine melliferous flora, method of storage, processing, and practices of beekeeping, and even interactions between chemical compounds and enzymes [1][2][3]. However, the aroma and taste of honey, owed to the volatile compounds, are dependent mainly on the botanical and floral origin of honey [3][4][5][6].
Nowadays, botanical and geographical originality of honey is a major concern among authorities in order to ensure its quality and authenticity, by imposing specific standards that allow honey to be competitive in the market [1][7]. Traditionally, identification of botanical and geographical origin of honey is performed by melisopalinological analysis [8][9]. This analysis is a time and cost-consuming process which cannot ensure reliable characterization of the honey floral source since it strongly depends on the capability of the analyzer [10][11]. Therefore, it is important to complement this analysis with other, more analytical techniques (physicochemical, organoleptic, chromatographic etc.), or replace it with them. During the past decades, several studies focused on gas chromatography (GC) in order to determine the volatile profile of honey [1][3][5][10][12][13][14][15][16]. The characteristic chemical fingerprint generated by volatile compounds is of major importance regarding consumers’ choice since it provides information about the botanical and geographical origin of honey [17].
Another main topic concerning the beekeeping sector, the honey industry, and researchers is the adulteration of honey. According to European Union regulations, the addition or removal of any kind of honey substance is illegal [118]. Honey adulteration is achieved by adding lower- quality honey and artificial adulterants [219]. Honey’s health benefits, and its unique flavor and aroma make it more expensive in comparison to other sweeteners. Therefore, in an attempt to reduce production costs and simultaneously increase profit, honey is a product usually subjected to adulteration [3][420][521]. Starch and inverted syrup fed to bees, the addition of sugars such as high fructose, glucose, and saccharose syrups, and low-quality honey added to high-priced honey are considered the most common ways of honey adulteration [420][622]. Honey adulteration can occur in any step of production or processing. It is also difficult to detect due to the fact that the adulterated honey is similar to the pure one [723]. Moreover, the classical methods that certify honey quality, such as physicochemical analyses, are incapable of detecting adulteration accurately. Thus, it is essential to develop and adopt a new process for honey quality control. For the aforementioned reasons, many analytical techniques have been applied, characterized by high effectiveness, accuracy, and sensitivity for the detection of honey adulteration [3].
In recent years, vibrational molecular spectroscopy techniques such as infrared (IR) and Raman are used to identify and quantify the chemical composition of various food products with flexibility, efficiency, and low cost [54]. These techniques also provide an easy, reliable, environmentally friendly, non-destructive, and prompt way for honey quality control [8][2][5][9][10][11][12][13].
2. Detection of Honey Adulteration using IR spectroscopyVolatile Compounds Analysis Using SPME-GC-MS
Infrared-based spectrVoscopy can be used for the detection of different adulterants inlatile compounds of honey at different ranges of absorption. (Table 1).
Chen et al.[14] usere related near-infrared (NIR) spectroscopy on blossom honey to determine adulteration with high fructose corn syrups. The characteristic bands of the blossom honey spectrum were around 6851 cm−1 (O–H stro the floral origin and could betch), 5607 cm−1 (CH2 group), 5201 cm −1 (O–H stretch and bend band), 4782 cm−1 (O–H defd as biormation band, and C–O stretch band), 4686 cm−1 (C–H rkerstretch. and deformation band), and 4182 cm−1 (SPME followed by GCH2-MS stretch and deformation band). For the d determination of high fructose corn syrup in honey, Ferreiro-González et al.ing the volatile [9] applrofied visible (Vis)-NIR spectroscopy. In another study, Fourier transform infrared (FTIR) spectroscopy was used to quantify corn syrup in honey to detect the adulterle of honey are used as a tool for the botanical characterization based on sugar content. Theof several differentiation between pure and adulterated honey was obtained clearly at the spectral range of 1150–650 cm−1, which wa types characteristic of pure honey s [2][5][1524]. Moreover, in a study by Li et al. [11], mid-inf[17][25][26][27][28][29].
Crared (MIR) spectroscopy successfully quantified high fructose syrup (HFGS) iatian honey samples. The absorption maxima of pure of Paliurus honey and HFGS were achieved at 3285, 2930, 1642, 1370–1420, 1200–1350, and 1025 c were dom−1. The characteristic band at 3285 cm−1 (OH– stratetchingd vibrations of water) raises by increasing HFGS concentration due to its high moisture.
NIR spectby nonanal, four isomeroscopy seems to be effective to classify honey in both cases of adulteration, with high fructose corn and maltose syrup. The characteristic peaks of absorbance were the same for pure and adulterated honey: 6891, 5619, 5155, 4778, 4395, and of lilac aldehyde, decanal, methyl nonanoate, hexanoic, and 2-ethylhexanoic acids 4231 cm−1 [1617].
During Tthe same spectroscopic technique (NIR), using three different NIR instruments (a laboratory, as well as portable and mobile instruments), was applied to South Africanpast decade, it has been noted that SPME-GC-MS fingerprinting of honey. Particularly good classification accuracies were obtained between the non-adulterated and adulterated honey and verified the capability of NIR spectroscopy to detect the addition of sugars and cheap imported honey, irrespective of the type of instrument [17]. NIR spectroscopy w volatiles combined with chemometrics can be considered as non-time and of high potential combinas used to detect adulterants (corn, sucrose, high fructose, beet, and rice syrups) in Manuka honeyion also for routine [18].
Aliaño-González et al. [2] ualysed Vis-NIR spectroscopy in order to guarantee the quality of multi-floral Granada Protected Designation of honey for their botanical characterization.
Several studies of Origin (PDO) honey by determining common adulterants (rice and fructose syrups, invert and brown cane sugars). Thirteen significant wavelengths (465.5 nm, 499.0 nm, 559.5 nm, 675.5 nm, 736.0 nm, 1104.5 nm, 1170.5 nm, 1253.0 nm, 1324.5 nm, 1423.5 nm, 1467.5 nm, 1544.5 nm, and 1958.0 nm) were selected for the discrimination. Most of the bands are characteristic regions (550–600 nm, 1190 nm, and 1700–1900 nm) of the Vis-NIR spectra.
Ivolatile composition that used SPME-GC-MS with chemometrics suggested that their combined usage in another study, FT-MIR technique was employed to characterize and quantify sugar adulterated honey from different varieties. Specifically, the addition of sucrose syrup was detected by the increase in absorbance in the region of 1800–650 cm−1 rder to determine geographical origin of honey is a robust and thre Full-Width-at-Half-Maximum (FWHM) was found at 1056 cm−1 for all honliabley samples, related to C–O, C–C, and O–H stretching and was increased by increasing the concentration of the adulterant [19]method of a high predictive ratio. FT-M
3. Authentication of Honey Using IR Spectroscopy
IR analysis was also carried out for pure and adulteratefrared-based Trigona spp. and Apis spp. honey by Mail et al. [20]. The characteristic peaks of Trigona sroscopp. and Apis spp. honey were 3272, 2934, 1643, 1416, 1345, 1256, cand 1026 cm−1. In th be cause of Apis honey, the characteristic spectra were changed in all the regions with the addition of vinegar, even at low percentage due to the dilution by the amounts of water in the vinegar. The adulterated Trigona spp. hd for the detection of different adulterants in honey with water also shift away from pure honey at most of the spectral regions. Thus, the spectroscopic data showed that this technique could rapidly detect the adulterants in both different ranges of absorption. Chemometrics has been used as an essential tool for chemical fingerprinting of honey types( Table 1 ).
| Type of Spectroscopy | Chemometrics Methods | Type of Adulterants | References |
|---|---|---|---|
| ATR-FTIR | PCA, SIMCA, PLS | Fructose syrup, glucose syrup, sucrose syrup, corn syrup, cane sugar | [97] |
| ATR-FTIR | PCA, DA, PLS | Commercial sugars of aren (Arenga pinnata), coconut, cane sugar | [98] |
| ATR-FTIR and Raman | PCA | Sucrose, reducing sugars | [59] |
| MIR and Raman | PLS, Data fusion | High fructose corn syrup, maltose syrup | [57] |
| NIR | DPLS | High fructose corn syrup | [91] |
| NIR | CARS, PLS- LDA | High fructose corn syrup | [93] |
| NIR | PLS-DA | Glucose syrup, fructose syrup, cheap imported honey | [65] |
| NIR | PCA, PLS | Corn syrup, sucrose syrup, high fructose corn syrup, beet syrup, rice syrup | [94] |
| NIR and MIR | PCA, PLS, DA | Rice syrup, corn syrup | [80] |
| NIR and ATR-FIIR | SVM, Data fusion | Type 1: rice and beet syrup, type 2: high fructose corn syrup, corn syrup, maltose syrup, sucrose syrup | [51] |
| Raman | PCA, PLS, artificial neural network ANN | Glucose, fructose, sucrose, maltose | [58] |
| Raman | Adaptive iteratively reweighted penalized least squares airPLS, PLS, DA | High fructose corn syrup, maltose syrup | [64] |
| Raman | SIMCA | Molasses, date molasses, grape molasses, high fructose corn syrup, corn syrup (dark and light), sucrose, inverted sugar | [63] |
| NIR | HCA, PCA, LDA, PLS | High fructose corn syrup | [55] |
| NIR | HCA, LDA, PLS | Inverted sugar, rice syrup, brown cane sugar, fructose syrup | [50] |
Attenuated total reflectance (ATR)-FTIR spectroscopy coupled with chemometrics was used in a study on stingless bee (Heterotrigona itama Heterotrigona itama ) honey from Malaysia for its capacity to detect adulteration by five adulterants including fructose, glucose, sucrose, corn syrup, and cane sugar. Applying PCA, all the adulterants were discriminated at the spectral region 1180–750 cm −1 . Especially, the absorption peaks at 1054, 876, and 779 cm−1 −1 were attributed to the increasing percentages of fructose. The characteristic peaks at 1022, 991, and 898 cm−1 −1 were assigned to the presence of glucose, and at 991 and 921 cm−1 −1 to the presence of sucrose. PLSR analysis was also able to quantity honey adulteration in all five cases [2130]. In another study of honey adulteration with sugar, FTIR spectrometer with an ATR device was applied to honeys produced in different places of Ecuador combined with PCA. This combination showed to be ideal for the quality control of honey [1331]. The ATR-FTIR technique has been also used alongside chemometrics for the estimation of the adulteration with commercial sugars of aren (Arenga pinnata Arenga pinnata ), coconut, and cane sugar of Indonesian honeys. [22].
PureCA (105 samples) and adulterant (154 samples) honey and PLS analyses were analyzed by NIR and MIR spectroscopies to detect adulterpplied for differentiation and quantification by rice and corn syrups [23]of the samples, respectively. Int another study, natural and syrup-adulterated honey from China were analyzed using both spectroscopies, NIR and ATR-FTIR. Two types owas proved that this combination is suitable for the detection of adulterants were studied: type 1, rice and beet syrup, and type 2, high fructosetion and measurement of the added sugar at Indonesian honeys [32].
Applicatiorn, corn, maltose, and sucrose syrup. Between NIR and ATR-FTIR, more characteristic peaks were observed in the second technique. The spectral region at 750–1500 cm−1 wn of vibrational spectroscopic techniques coupled with chemometrics in detection of honey as redulated to tteration.
The combinabsorption of major monosaccharides (such as fructose and glucose) and disaccharides (such as sucrose) and the region at 750–900 cm−1 wIR with chemometrics provide satisfactory discrimination and rapid first-line classification of honey based attributed to anomalous peaks corresponding to the characteristic absorptions of sugars [5] (Table 1)on the botanical and geographical origin.
| Type of Spectroscopy | Type of Adulterants | References |
|---|---|---|
| ATR-FTIR | Fructose syrup, glucose syrup, sucrose syrup, corn syrup, cane sugar | [21] |
| ATR-FTIR | Commercial sugars of aren (Arenga pinnata), coconut, cane sugar | [22] |
| ATR-FTIR and Raman | Sucrose, reducing sugars | [13] |
| MIR and Raman | High fructose corn syrup, maltose syrup | [11] |
| NIR | High fructose corn syrup | [14] |
| NIR | High fructose corn syrup | [16] |
| NIR | Glucose syrup, fructose syrup, cheap imported honey | [17] |
| NIR | Corn syrup, sucrose syrup, high fructose corn syrup, beet syrup, rice syrup | [18] |
| NIR and MIR | Rice syrup, corn syrup | [23] |
| NIR and ATR-FIIR | Type 1: rice and beet syrup, type 2: high fructose corn syrup, corn syrup, maltose syrup, sucrose syrup | [5] |
| Raman | Glucose, fructose, sucrose, maltose | [12] |
| Raman | High fructose corn syrup, maltose syrup | [24] |
| Raman | Molasses, date molasses, grape molasses, high fructose corn syrup, corn syrup (dark and light), sucrose, inverted sugar | [25] |
| NIR | High fructose corn syrup | [9] |
| NIR | Inverted sugar, rice syrup, brown cane sugar, fructose syrup | [2] |
34. DAuthetecntication of Honey Adulteration uUsing Raman sSpectroscopy
Raman spectroscopy can be successfully used to detect adulteration of honey (Table Table 1 1).
Raman technique coupled with multivas riate analysis was applied at honeys to identify and quantify sugars (glucose, fructose, maltose, and sucrose contents) and further to characterize them as adulterants. The characteristic spectral bands that correlated to sugars of honey were 314, 341, 415, 530, 617, 744, 776, 790, 838, 856, 911, 933, 1028, and 1106 cm−1 −1 . PCA, partial least squares (PLS), and artificial neural network (ANN) were used to extract differentiation from the spectroscopic data which successfully led to the discrimination of sugar contents in honey [1233]. Moreover, Raman technique was used by Salvador et al. [1331] to detect the sugar content and the type of adulteration in commercial honeys of Ecuador. The main observed bands of honeys from Pichincha and Loja provinces were 326, 338, 419, 516, 630, 707, 817, 862, 918, 1062, and 1126 cm−1 −1 . These bands were assigned to the presence of sugar (glucose, fructose, and sucrose) inat honey samples. The bands of pure honey at 817 and 862 cm−1 −1 , in the case of adulteration with sucrose, were overlapped with strong absorptions at 822 and 834 cm−1 −1 . Principal component analysis was applied and confirmed the applicability of Raman technique for the detection of adulteration of honey with glucose, fructose, and sucrose.
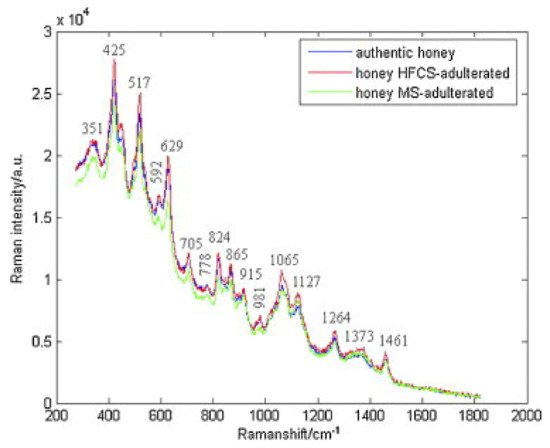
In another study, Raman spectroscopy was also used to detect adulteration of honey with high fructose corn syrup and/or maltose syrup. The characteristic bands corresponding to authentic and adulterated honeys were observed: 351, 425, 517, 592, 629, 705, 778, 824, 865, 915, 981, 1065, 1127, 1264, 1373, and 1461 cm−1 −1 ( Figure 1 [24]). RamanThe spectroscopy was successfully employed for the quantification of HFGCS (high fructose syrup) in adulterated honey, as well. At the band of 2791 cm−1, the a data were subjected to adabsorption was increased by increasing the HFGS concentration, while at 1130 cm−1, the abve iteratively reweighted penalized leasorption was reduced due to the decrease in protein and amino acid content in the adulterated honey squares (airPLS). Using PLS-LDA, classification of honeys [11].
Non-invwasive techniques using a handheld and compact benchtop Raman system were employed to detect honey achieved in both cases of adulteration by molasses, date molasses, grape molasses, high fructose corn syrup, corn syrup (dark and light), sucrose, and invertednts and in mixtures of them sugar[34]. TChe characteristicmometrics with Raman spectroscopic bands found at 424, 517, 629, 706, 824, 1067, 1127, 1265, 1373, and 1461 cm−1 y were suconcerning the presence of sugarscessfully [25].
4. Other Techniques
The technique of isotope ratio mass spectrometry (IRMS) is used to detect honey adulteration based on the difference of 13C/12C cployed for the quantificarbon isotopes. The botanical origin of honey is from C3 plants, while the sugar cane, corn, and other plants from which syrups are used in the ion of HFGCS (high fructose syrup) in adulteration ofed honey belong to the C4 plants. The difference is that they follow different photosynthetic pathways resulting in differentiation in the metabolic pathways of the compounds containin, as well. At the band of 2791 cm −1 , the absorption was increased by increasing the 13C isotope. Therefore it is possible toHFGS detect the addition of cheap syrups from C4 plants due to the difference δ13C which roncentranges from -22 to -33δ ‰ for honey from C3 plantsion, while for syrups from C4 plants range from -10 to -20δ ‰. Also when sugar (C4 plants) is added to pure honey the δ13C valat 1130 cm −1 , the absorption was redue changes, with the indication -23.5 ‰ indicating the existence of adulteration[26][27].
Nued due to the declear magnetic resonance spectroscopy (NMR) provides information on the structural and chemical properties of food ingredients. It is used to certify the geographical and botanical origin of honey as well as to aease in protein and amino acid content in the adulterated honey with syrups of different origins. The NMR experiments performed are one-dimensional (1D NMR) with 1H and 13C spectra and two-dimensional (2D NMR) such as heteronuclear two-dimensional spectroscopy (1H-13C HMBC). Nucls. Three data fusion strategies wear magnetic resonance spectroscopy is a technique that provides us with many possibilities, however, the equipment and maintenance required are of high cost so it is used mainly for research purposes or by large industries[28][29][30].
DNA-basede used and showed high predictability in techniques are reliable and are used to certify the geographical and botanical origie adulteration of honey as well as to detect microorganisms and allergens in honey. The approaches that have been performed are the DNA barcode with the combination of universal primers and mass parallel sequencing, the targeting of ADH1 genes to detect the botanical origin of flower honey, the extraction of DNA from pollen, the detection of fungi and DNA-based bacteria, the isolation of cetyltrimethylammonium bromide (CTAB) precipitation buffer, while the best results were obtained by the high-level data fusion process DNA [35].
Rand the detection of markers for the polymerase chain reaction (PCR). Finally, entomological identification of the origin of honey has been performed based on the mitochondrial 16S rRNA of the bee[31][32][33].
5. Conclusion
Hn technique is capable of on-site testing of honey consumption gradually raises mainly because of its health benefits. However, an important issue that consumers, producers, industries, and researchers must deal with is the cases of adulteration. Consequently, it is urgent to develop low-cost, simple, and reliable techniques that will ensure the quality of honey. Thus spectroscopic methods, namely IR and Raman, can evaluate the quality of honey and are able to detect adulteration, mainly with sugar syrupsamples to authenticate and verify their label information based on its origin.
References
- Organization, W.H. Codex Alimentarius Commission and Council Directive 2001/110/EC of 20 December 2001 relating to honey. CODEX Aliment. 2001, CXS 12-1981, 1–8.Castro-Vázquez, L.; Díaz-Maroto, M.C.; de Torres, C.; Pérez-Coello, M.S. Effect of geographical origin on the chemical and sensory characteristics of chestnut honeys. Food Res. Int. 2010, 43, 2335–2340.
- Ma José Aliaño-González; Marta Ferreiro-González; Estrella Espada-Bellido; Miguel Palma; Gerardo F. Barbero; A screening method based on Visible-NIR spectroscopy for the identification and quantification of different adulterants in high-quality honey. Talanta 2019, 203, 235-241, 10.1016/j.talanta.2019.05.067.Ciotlaus, I.; Balea, A.; Pojar-Fenesan, M.; Petean, I. Cromathographic profile of volatiles of multifloral and unifloral honey collected by apis mellifera from Transilvania, Romania. Rev. Chim. 2020, 71, 91–99.
- Apramita Devi; Jitender Jangir; Anu-Appaiah K.A.; K.A. Anu Appaiah; Chemical characterization complemented with chemometrics for the botanical origin identification of unifloral and multifloral honeys from India. Food Research International 2018, 107, 216-226, 10.1016/j.foodres.2018.02.017.Devi, A.; Jangir, J.; Anu-Appaiah, K.A. Chemical characterization complemented with chemometrics for the botanical origin identification of unifloral and multifloral honeys from India. Food Res. Int. 2018, 107, 216–226.
- María José Aliaño-González; Marta Ferreiro-González; Estrella Espada-Bellido; Gerardo F. Barbero; Miguel Palma; Novel method based on ion mobility spectroscopy for the quantification of adulterants in honeys. Food Control 2020, 114, 107236, 10.1016/j.foodcont.2020.107236.De Lima Morais da Silva, P.; de Lima, L.S.; Caetano, Í.K.; Torres, Y.R. Comparative analysis of the volatile composition of honeys from Brazilian stingless bees by static headspace GC–MS. Food Res. Int. 2017, 102, 536–543.
- Furong Huang; Han Song; Liu Guo; Peiwen Guang; Xinhao Yang; Liqun Li; Hongxia Zhao; Maoxun Yang; Detection of adulteration in Chinese honey using NIR and ATR-FTIR spectral data fusion. Spectrochimica Acta Part A: Molecular and Biomolecular Spectroscopy 2020, 235, 118297, 10.1016/j.saa.2020.118297.Escriche, I.; Visquert, M.; Juan-Borrás, M.; Fito, P. Influence of simulated industrial thermal treatments on the volatile fractions of different varieties of honey. Food Chem. 2009, 112, 329–338.
- Natalia Arroyo-Manzanares; María García-Nicolás; Ana Castell; Natalia Campillo; Pilar Viñas; Ignacio Lopez-Garcia; Manuel Hernández-Córdoba; Untargeted headspace gas chromatography – Ion mobility spectrometry analysis for detection of adulterated honey. Talanta 2019, 205, 120123, 10.1016/j.talanta.2019.120123.Kaškoniene, V.; Venskutonis, P.R.; Čeksteryte, V. Composition of volatile compounds of honey of various floral origin and beebread collected in Lithuania. Food Chem. 2008, 111, 988–997.
- M. Esteki; J. Simal-Gandara; Z. Shahsavari; S. Zandbaaf; E. Dashtaki; Yvan Vander Heyden; A review on the application of chromatographic methods, coupled to chemometrics, for food authentication. Food Control 2018, 93, 165-182, 10.1016/j.foodcont.2018.06.015.Ballabio, D.; Robotti, E.; Grisoni, F.; Quasso, F.; Bobba, M.; Vercelli, S.; Gosetti, F.; Calabrese, G.; Sangiorgi, E.; Orlandi, M.; et al. Chemical profiling and multivariate data fusion methods for the identification of the botanical origin of honey. Food Chem. 2018, 266, 79–89.
- Davide Ballabio; Elisa Robotti; Francesca Grisoni; Fabio Quasso; Marco Bobba; Serena Vercelli; Fabio Gosetti; Giorgio Calabrese; Emanuele Sangiorgi; Marco Orlandi; et al.Emilio Marengo Chemical profiling and multivariate data fusion methods for the identification of the botanical origin of honey. Food Chemistry 2018, 266, 79-89, 10.1016/j.foodchem.2018.05.084.Patrignani, M.; Fagúndez, G.A.; Tananaki, C.; Thrasyvoulou, A.; Lupano, C.E. Volatile compounds of Argentinean honeys: Correlation with floral and geographical origin. Food Chem. 2018, 246, 32–40.
- Marta Ferreiro González; Estrella Espada-Bellido; Lucía Guillén-Cueto; Miguel Palma; Carmelo G. Barroso; Gerardo F. Barbero; Rapid quantification of honey adulteration by visible-near infrared spectroscopy combined with chemometrics. Talanta 2018, 188, 288-292, 10.1016/j.talanta.2018.05.095.Stanimirova, I.; Üstün, B.; Cajka, T.; Riddelova, K.; Hajslova, J.; Buydens, L.M.C.; Walczak, B. Tracing the geographical origin of honeys based on volatile compounds profiles assessment using pattern recognition techniques. Food Chem. 2010, 118, 171–176.
- Z. Jandrić; S.A. Haughey; Russell Frew; K. McComb; P. Galvin-King; C.T. Elliott; A. Cannavan; Discrimination of honey of different floral origins by a combination of various chemical parameters. Food Chemistry 2015, 189, 52-59, 10.1016/j.foodchem.2014.11.165.Castro-Vázquez, L.; Leon-Ruiz, V.; Alañon, M.E.; Pérez-Coello, M.S.; González-Porto, A.V. Floral origin markers for authenticating Lavandin honey (Lavandula angustifolia × latifolia). Discrimination from Lavender honey (Lavandula latifolia). Food Control 2014, 37, 362–370.
- Yang Li; Yue Huang; Jingjing Xia; Yanmei Xiong; Shungeng Min; Quantitative analysis of honey adulteration by spectrum analysis combined with several high-level data fusion strategies. Vibrational Spectroscopy 2020, 108, 103060, 10.1016/j.vibspec.2020.103060.Da Costa, A.C.V.; Sousa, J.M.B.; da Silva, M.A.A.P.; dos Garruti, D.S.; Madruga, M.S. Sensory and volatile profiles of monofloral honeys produced by native stingless bees of the brazilian semiarid region. Food Res. Int. 2018, 105, 110–120.
- Beril Özbalci; Ismail Boyaci; Ali Topcu; Cem Kadılar; Ugur Tamer; Rapid analysis of sugars in honey by processing Raman spectrum using chemometric methods and artificial neural networks. Food Chemistry 2013, 136, 1444-1452, 10.1016/j.foodchem.2012.09.064.Castro-Vázquez, L.; Díaz-Maroto, M.C.; González-Viñas, M.A.; Pérez-Coello, M.S. Differentiation of monofloral citrus, rosemary, eucalyptus, lavender, thyme and heather honeys based on volatile composition and sensory descriptive analysis. Food Chem. 2009, 112, 1022–1030.
- Lorena Salvador; Michelle Guijarro; Daniela Rubio; Bolívar Aucatoma; Tanya Guillén; Paul Vargas Jentzsch; Valerian Ciobotă; Linda Stolker; Sonia Ulic; Luis Vásquez; et al.Patricia GarridoJuan BravoLuis Ramos Guerrero Exploratory Monitoring of the Quality and Authenticity of Commercial Honey in Ecuador. Foods 2019, 8, 105, 10.3390/foods8030105.Escriche, I.; Kadar, M.; Juan-Borrás, M.; Domenech, E. Using flavonoids, phenolic compounds and headspace volatile profile for botanical authentication of lemon and orange honeys. Food Res. Int. 2011, 44, 1504–1513.
- Lanzhen Chen; Xiaofeng Xue; Zhihua Ye; Jinghui Zhou; Fang Chen; Jing Zhao; Determination of Chinese honey adulterated with high fructose corn syrup by near infrared spectroscopy. Food Chemistry 2011, 128, 1110-1114, 10.1016/j.foodchem.2010.10.027.Escriche, I.; Sobrino-Gregorio, L.; Conchado, A.; Juan-Borrás, M. Volatile profile in the accurate labelling of monofloral honey. The case of lavender and thyme honey. Food Chem. 2017, 226, 61–68.
- Minarni Shiddiq; Zulkarnain; Vepy Asyana; Himmatul Aliyah; Identification of Pure and Adulterated Honey Using Two Spectroscopic Methods. Journal of Physics: Conference Series 2019, 1351, 012022, 10.1088/1742-6596/1351/1/012022.Juan-Borrás, M.; Domenech, E.; Hellebrandova, M.; Escriche, I. Effect of country origin on physicochemical, sugar and volatile composition of acacia, sunflower and tilia honeys. Food Res. Int. 2014, 60, 86–94.
- Shuifang Li; Xin Zhang; Yang Shan; Donglin Su; Qiang Ma; Ruizhi Wen; Jiaojuan Li; Qualitative and quantitative detection of honey adulterated with high-fructose corn syrup and maltose syrup by using near-infrared spectroscopy. Food Chemistry 2017, 218, 231-236, 10.1016/j.foodchem.2016.08.105.Soria, A.C.; Martínez-Castro, I.; Sanz, J. Some aspects of dynamic headspace analysis of volatile components in honey. Food Res. Int. 2008, 41, 838–848.
- Anina Guelpa; Federico Marini; Anton du Plessis; Ruhan Slabbert; Marena Manley; Verification of authenticity and fraud detection in South African honey using NIR spectroscopy. Food Control 2017, 73, 1388-1396, 10.1016/j.foodcont.2016.11.002.Jerković, I.; Tuberoso, C.I.G.; Marijanović, Z.; Jelić, M.; Kasum, A. Headspace, volatile and semi-volatile patterns of Paliurus spina-christi unifloral honey as markers of botanical origin. Food Chem. 2009, 112, 239–245.
- Xinhao Yang; Peiwen Guang; Guoze Xu; Siqi Zhu; Zhenqiang Chen; Furong Huang; Manuka honey adulteration detection based on near-infrared spectroscopy combined with aquaphotomics. LWT 2020, 132, 109837, 10.1016/j.lwt.2020.109837.WHO; FAO. Codex Alimentarius Commission and Council Directive 2001/110/EC of 20 December 2001 Relating to Honey. In Codex Alimentarius; CXS 12-1981; Codex Alimentarius Commission: Rome, Italy, 2001; pp. 1–8.
- Chirantan Das; Subhadip Chakraborty; Krishnendu Acharya; Nirmal Kumar Bera; Dipankar Chattopadhyay; Anupam Karmakar; Sanatan Chattopadhyay; FT-MIR supported Electrical Impedance Spectroscopy based study of sugar adulterated honeys from different floral origin. Talanta 2017, 171, 327-334, 10.1016/j.talanta.2017.05.016.Aliaño-González, M.J.; Ferreiro-González, M.; Espada-Bellido, E.; Palma, M.; Barbero, G.F. A screening method based on Visible-NIR spectroscopy for the identification and quantification of different adulterants in high-quality honey. Talanta 2019, 203, 235–241.
- Mohd Hafiz Mail; Nurhidayah Ab. Rahim; Azimah Amanah; Muhammad Hidhir Khawory; Mohd Anuar Shahudin; Azman Seeni; FTIR and Elementary Analysis of Trigona Honey, Apis Honey and Adulterated Honey Mixtures. Biomedical and Pharmacology Journal 2019, 12, 2011-2017, 10.13005/bpj/1833.Aliaño-González, M.J.; Ferreiro-González, M.; Espada-Bellido, E.; Barbero, G.F.; Palma, M. Novel method based on ion mobility spectroscopy for the quantification of adulterants in honeys. Food Control. 2020, 114, 107236.
- Kuan Wei Se; Sib Krishna Ghoshal; Roswanira Abdul Wahab; Raja Kamarulzaman Raja Ibrahim; Mohd Nizam Lani; A simple approach for rapid detection and quantification of adulterants in stingless bees ( Heterotrigona itama ) honey. Food Research International 2018, 105, 453-460, 10.1016/j.foodres.2017.11.012.Huang, F.; Song, H.; Guo, L.; Guang, P.; Yang, X.; Li, L.; Zhao, H.; Yang, M. Detection of adulteration in Chinese honey using NIR and ATR-FTIR spectral data fusion. Spectrochim. Acta Part A Mol. Biomol. Spectrosc. 2020, 235, 118297.
- Y. Riswahyuli; Abdul Rohman; Francis.M.C.S. Setyabudi; Sri Raharjo; Indonesian wild honey authenticity analysis using attenuated total reflectance-fourier transform infrared (ATR-FTIR) spectroscopy combined with multivariate statistical techniques. Heliyon 2020, 6, e03662, 10.1016/j.heliyon.2020.e03662.Arroyo-Manzanares, N.; García-Nicolás, M.; Castell, A.; Campillo, N.; Viñas, P.; López-García, I.; Hernández-Córdoba, M. Untargeted headspace gas chromatography—Ion mobility spectrometry analysis for detection of adulterated honey. Talanta 2019, 205, 120123.
- Zhilin Gan; Yang Yang; Jing Li; Xin Wen; Minghui Zhu; Yundong Jiang; Yuanying Ni; Using sensor and spectral analysis to classify botanical origin and determine adulteration of raw honey. Journal of Food Engineering 2016, 178, 151-158, 10.1016/j.jfoodeng.2016.01.016.Esteki, M.; Simal-Gandara, J.; Shahsavari, Z.; Zandbaaf, S.; Dashtaki, E.; Vander Heyden, Y. A review on the application of chromatographic methods, coupled to chemometrics, for food authentication. Food Control 2018, 93, 165–182.
- Shuifang Li; Yang Shan; Xiangrong Zhu; Xin Zhang; Guowei Ling; Detection of honey adulteration by high fructose corn syrup and maltose syrup using Raman spectroscopy. Journal of Food Composition and Analysis 2012, 28, 69-74, 10.1016/j.jfca.2012.07.006.Acevedo, F.; Torres, P.; Oomah, B.D.; de Alencar, S.M.; Massarioli, A.P.; Martín-Venegas, R.; Albarral-Ávila, V.; Burgos-Díaz, C.; Ferrer, R.; Rubilar, M. Volatile and non-volatile/semi-volatile compounds and in vitro bioactive properties of Chilean Ulmo (Eucryphia cordifolia Cav.) honey. Food Res. Int. 2017, 94, 20–28.
- Didem P. Aykas; Mei-Ling Shotts; Luis E. Rodriguez-Saona; Authentication of commercial honeys based on Raman fingerprinting and pattern recognition analysis. Food Control 2020, 117, 107346, 10.1016/j.foodcont.2020.107346.Plutowska, B.; Chmiel, T.; Dymerski, T.; Wardencki, W. A headspace solid-phase microextraction method development and its application in the determination of volatiles in honeys by gas chromatography. Food Chem. 2011, 126, 1288–1298.
- Ana I. Cabañero; And Jose L. Recio; Mercedes Rupe Ä Rez; Liquid Chromatography Coupled to Isotope Ratio Mass Spectrometry: A New Perspective on Honey Adulteration Detection. Journal of Agricultural and Food Chemistry 2006, 54, 9719-9727, 10.1021/jf062067x.Rivellino, S.R.; Hantao, L.W.; Risticevic, S.; Carasek, E.; Pawliszyn, J.; Augusto, F. Detection of extraction artifacts in the analysis of honey volatiles using comprehensive two-dimensional gas chromatography. Food Chem. 2013, 141, 1828–1833.
- Hiroto Kawashima; Momoka Suto; Nana Suto; Determination of carbon isotope ratios for honey samples by means of a liquid chromatography/isotope ratio mass spectrometry system coupled with a post-column pump. Rapid Communications in Mass Spectrometry 2018, 32, 1271-1279, 10.1002/rcm.8170.Odeh, I.; Abu-Lafi, S.; Dewik, H.; Al-Najjar, I.; Imam, A.; Dembitsky, V.M.; Hanuš, L.O. A variety of volatile compounds as markers in Palestinian honey from Thymus capitatus, Thymelaea hirsuta, and Tolpis virgata. Food Chem. 2007, 101, 1393–1397.
- Roberta De Oliveira Resende Ribeiro; Eliane Teixeira Mársico; Carla Da Silva Carneiro; Maria Lúcia Guerra Monteiro; Carlos Conte Júnior; Edgar Francisco Oliveira de Jesus; Detection of honey adulteration of high fructose corn syrup by Low Field Nuclear Magnetic Resonance (LF 1H NMR). Journal of Food Engineering 2014, 135, 39-43, 10.1016/j.jfoodeng.2014.03.009.Pasini, F.; Gardini, S.; Marcazzan, G.L.; Caboni, M.F. Buckwheat honeys: Screening of composition and properties. Food Chem. 2013, 141, 2802–2811.
- Marc Spiteri; Eric Jamin; Freddy Thomas; Agathe Rebours; Michèle Lees; Karyne Rogers; Douglas N. Rutledge; Fast and global authenticity screening of honey using 1H-NMR profiling. Food Chemistry 2015, 189, 60-66, 10.1016/j.foodchem.2014.11.099.Špánik, I.; Pažitná, A.; Šiška, P.; Szolcsányi, P. The determination of botanical origin of honeys based on enantiomer distribution of chiral volatile organic compounds. Food Chem. 2014, 158, 497–503.
- Davide Bertelli; Massimo Lolli; Giulia Papotti; Laura Bortolotti; Giorgia Serra; Maria Plessi; Detection of Honey Adulteration by Sugar Syrups Using One-Dimensional and Two-Dimensional High-Resolution Nuclear Magnetic Resonance. Journal of Agricultural and Food Chemistry 2010, 58, 8495-8501, 10.1021/jf101460t.Se, K.W.; Ghoshal, S.K.; Wahab, R.A.; Ibrahim, R.K.R.; Lani, M.N. A simple approach for rapid detection and quantification of adulterants in stingless bees (Heterotrigona itama) honey. Food Res. Int. 2018, 105, 453–460.
- Lara Sobrino-Gregorio; Santiago Vilanova; Jaime Prohens; Isabel Escriche; Detection of honey adulteration by conventional and real-time PCR. Food Control 2018, 95, 57-62, 10.1016/j.foodcont.2018.07.037.Salvador, L.; Guijarro, M.; Rubio, D.; Aucatoma, B.; Guillén, T.; Jentzsch, P.V.; Ciobotă, V.; Stolker, L.; Ulic, S.; Vásquez, L.; et al. Exploratory monitoring of the quality and authenticity of commercial honey in Ecuador. Foods 2019, 8, 105.
- Sean W.J. Prosser; Paul D.N. Hebert; Rapid identification of the botanical and entomological sources of honey using DNA metabarcoding. Food Chemistry 2016, 214, 183-191, 10.1016/j.foodchem.2016.07.077.Riswahyuli, Y.; Rohman, A.; Setyabudi, F.M.C.S.; Raharjo, S. Indonesian wild honey authenticity analysis using attenuated total reflectance-fourier transform infrared (ATR-FTIR) spectroscopy combined with multivariate statistical techniques. Heliyon 2020, 6, e03662.
- Sónia Soares; Joana S. Amaral; Beatriz Oliveira; Isabel Mafra; A Comprehensive Review on the Main Honey Authentication Issues: Production and Origin. Comprehensive Reviews in Food Science and Food Safety 2017, 16, 1072-1100, 10.1111/1541-4337.12278.Özbalci, B.; Boyaci, I.H.; Topcu, A.; Kadilar, C.; Tamer, U. Rapid analysis of sugars in honey by processing Raman spectrum using chemometric methods and artificial neural networks. Food Chem. 2013, 136, 1444–1452.
- Li, S.; Shan, Y.; Zhu, X.; Zhang, X.; Ling, G. Detection of honey adulteration by high fructose corn syrup and maltose syrup using Raman spectroscopy. J. Food Compos. Anal. 2012, 28, 69–74.
- Li, Y.; Huang, Y.; Xia, J.; Xiong, Y.; Min, S. Quantitative analysis of honey adulteration by spectrum analysis combined with several high-level data fusion strategies. Vib. Spectrosc. 2020, 108, 103060.