Transitional waters straddle the interface between marine and terrestrial biomes and, among others, include fjords, bays, lagoons, and estuaries. These coastal systems are essential for transport and manufacturing industries and suffer extensive anthropogenic exploitation of their ecosystem services for aquaculture and recreational activities. These activities can have negative effects on the local biota, necessitating investigation and regulation. As a result of this, EcoQS (ecological quality status) assessment has garnered great attention as an essential aspect of governmental bodies’ legislative decision-making process. Assessing EcoQS in transitional water ecosystems is problematic because these systems experience high natural variability and organic enrichment and often lack information about their pre-human impact, baseline, or “pristine” reference conditions, knowledge of which is essential to many commonly used assessment methods. Here, foraminifera can be used as environmental sentinels, providing ecological data such as diversity and sensitivity, which can be used as the basis for EcoQS assessment indices. Fossil shells of foraminifera can also provide a temporal aspect to ecosystem assessment, making it possible to obtain reference conditions from the study site itself. These foraminifera-based indices have been shown to correlate not only with various environmental stressors but also with the most common macrofaunal-based indices currently employed by bodies such as the Water Framework Directive (WFD).
Note: The following contents are extract from your paper. The entry will be online only after author check and submit it.
1. Introduction
The protection and restoration of continental and marine waters and their essential ecosystems has prompted international regulation and legislature from national governing bodies such as the Clean Water Act (CWA, 33 U.S.C. §1251 et seq. 1972), introduced by the U.S. Environmental Protection Agency; within Europe the Water Framework Directive (WFD, 2000
[1]), and the Marine Strategic Framework Directive (MSFD, 2008
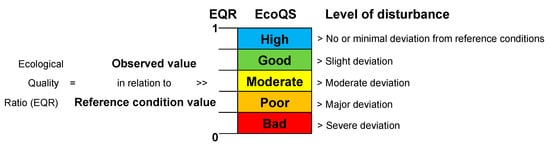
[2]). It involves evaluating the ecological quality status (EcoQS,
Figure 1 herein) to assess the health of water systems. Noticeably, transitional water bodies are particularly difficult to assess due to their natural variability and require an in-depth ecological understanding to obtain meaningful results. The term “transitional” was introduced about 20 years ago in the WFD (Water Framework Directive, WFD, 2000
[1]) as a means to complete the continuum between continental and coastal waters. Transitional waters are water bodies influenced by both oceanic and freshwater regimes and include estuaries, deltas, rias, lagoons, and fjords (
Table 1). In the WFD, transitional waters are defined as “bodies of surface water in the vicinity of river mouths which are partially saline in character as a result of their proximity to coastal waters but which are substantially influenced by freshwater flows”
[1]. These waters may also include mesohaline, poly-euhaline, and hyperhaline lagoons
[3]. Human-modified transitional waters are classified as “artificial water bodies”
[1].
Figure 1. The basic principles of the classification of ecological status based on the EcoQ ratios assigned, assuming equal intervals between the different classes (adapted and re-drawn from
[4]).
Table 1. Water body types of intertidal areas and transitional waters (modified after
[16][5]).
| Water Body Types |
Natural Features |
| Classical estuary |
Tidally dominated at the seaward part; salinity notably reduced by freshwater river inputs; riverine dominance landward |
| Lentic non-tidal lagoon |
Limited exchange with the coastal area through a restricted mouth; separated from the sea by sand or shingle banks, bars, coral, etc., shallow area, tidal range < 50 cm |
| Lentic micro-tidal lagoon |
As above but with tidal range > 50 cm |
| Fjord |
Semi-enclosed marine basin, entrance sills separating deeper inner waters from adjacent coastal waters, restricted water circulation/oxygen renewal, sediment sequences removed by glacial erosion |
| Ria |
Drowned river valley, some freshwater inputs; limited exchanges with coastal waters |
| Delta |
Low energy, characteristically shaped, sediment dominated, river mouth area; estuary outflow |
| Coastal freshwater/brackish water plume |
Outflow of estuary or lagoon, notably diluted salinity, and hence differing biota than surrounding coast |
| Semi-enclosed bay/lagoon |
Low energy, notably limited exchange with the open sea waters |
| Artificial water body |
Harbors and docks, constructed dredging pools, and coastal water bodies connected to the sea, created by human activities |
These ecosystems, located between sea and land, results in a patchwork of highly heterogeneous conditions, which require easily implemented and robust biotic indices. Biotic indices based on the indicator species concept, i.e., on the specific response to organic matter enrichment, for instance, are not fully reliable to assess EcoQS in these water body types (i.e.,
[5,6,7,8][6][7][8][9]). In fact, the natural features of these ecosystems make it difficult to disentangle natural and human-induced changes. In particular, silt, clay, and organic matter (OM) sedimentary contents are naturally high in transitional waters, promoting tolerant and opportunistic species, while sensitive species naturally decline
[9,10][10][11]. Furthermore, total organic carbon (TOC) in transitional waters is a mix of labile and refractory OM with important terrestrial inputs
[11][12]. In transitional waters, benthic communities could therefore be naturally similar to those found in anthropogenically disturbed areas
[6,10][7][11]. Consequently, pristine, naturally disturbed intertidal areas and transitional waters could easily be misclassified in moderate to bad EcoQS (the “estuarine quality paradox”;
[9,12,13][10][13][14]), providing misleading estimates of reference conditions and severely complicating the decision-making process
[6,8,14,15][7][9][15][16].
The EcoQS is a comparative measure of the current condition of a system, compared to that of a reference system free from the negative impact (
Figure 1), e.g., heavy metal pollution. It is therefore essential to obtain reference conditions specific to each site from a relatively “pristine” period (before anthropogenic pollution can be detected in the sediment) and compare these to the conditions thereafter. Here lies the central conundrum in EcoQS assessment, as no marine ecosystems on earth today, let alone those at coastal proximity, can be found in “pristine” condition
[5,17,18][6][17][18]. Transitional and coastal systems have hosted a disproportionately high human activity for centuries, and as a result, information regarding their pre-impact reference conditions is often missing. Additionally, even if a relatively “pristine” comparison site can be located, the disparate physical and geochemical setting will immediately make it less useful as an analogue
[19,20,21][19][20][21]. Hence, for most EcoQS assessment indices, a knowledge gap exists in defining the initial “pristine reference conditions” needed to quantify the change of EcoQS. Without this information to provide a baseline for comparison to a more contemporary EcoQS, the effect of anthropogenic stress cannot be properly determined
[19,22][19][22].
In this context, palaeoecology can be used to bridge the knowledge gap by providing reference conditions from the exact study site prior to any anthropogenic impact. Having high preservation and fossilization potential makes foraminifera reliable palaeoecological indicators, with the potential to provide reference data from the preindustrial period and beyond
[19,20,23,24][19][20][23][24]. For instance, a more robust assessment of EcoQS for transitional waters was obtained with benthic foraminifera using site-specific local reference conditions in the Oslofjord (Norway)
[19], in the Boulogne sur Mer harbor (France)
[23], and in the Santos estuary (Brazil)
[25]. Furthermore, geochemical analyses of dated sediment cores can be used in combination with benthic foraminifera to determine ecological reference conditions in transitional waters
[20,26][20][26]. In this review paper, we will describe and discuss how several key characteristics of foraminifera-based indices can be used to address this issue. Particularly how they can be used to provide comparable data from the target site, complete with its unique biogeochemical setting, to set a reliable baseline facilitating the calculation of a representative modern-day EcoQS value.
2. Benthic Foraminifera Are Reliable Indicators of Environmental Conditions
Benthic foraminifera have been shown to respond quickly even to rapid and unprecedented environmental changes in transitional waters; by adapting their species composition and population densities, these protists are able to provide valuable ecological proxies
[26]. Since their initial use in the early 1960s by Resig and Watkins
[27], benthic foraminifera have proved to be a reliable ecological indicator of various types of anthropogenic stress, including desalination discharge
[28], oil-spills
[29[29][30][31][32],
30,31,32], aquaculture
[33[33][34],
34], sewage
[35[35][36],
36], heavy metal pollution
[22[22][29][37][38][39][40],
29,37,38,39,40], and pulp mill effluents (e.g.,
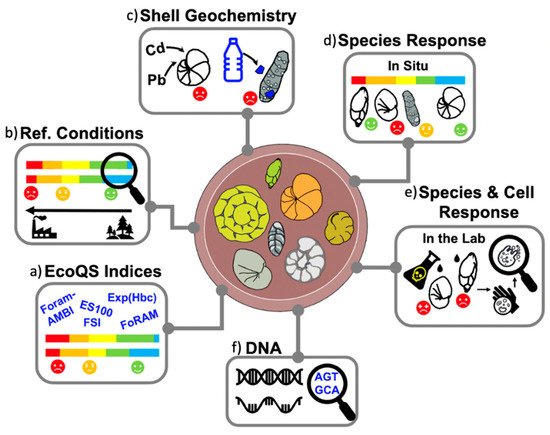
[41]). At the community and species level, ecological studies have used these protists as a biological quality element (BQE) to decipher the relationship between both natural and anthropogenic environmental variables and the local biota in transitional waters. Foraminiferal assemblages provide additional data (
Figure 2) such as changes in population density and species abundance, e.g.,
[42,43][42][43] community compositional shifts (pre-impact sensitive species vs. post-impact opportunists: e.g.,
[24]) or calcareous vs. agglutinated species: e.g.,
[44[44][45][46][47],
45,46,47], as well as sensitivity and diversity indices
[19[19][48][49][50],
48,49,50], changing depth of habitation in the sediment (observed with living individuals: e.g.,
[30[30][51],
51], development of aberrant tests
[21,50,51,52,53,54,55][21][50][51][52][53][54][55] and pollutant accumulation within tests, e.g.,
[39,56,57][39][56][57]. In fjords
[58[58][59],
59], lagoons
[38[38][49][60],
49,60], estuaries, and harbours
[20,61,62][20][61][62] alike, foraminiferal proxies have been shown to correlate with environmental changes. For instance, certain opportunistic species such as
Stainforthia fusiformis [47[47][58][63],
58,63], Spiroplectammina biformis [24],
Elphidium incertum [64],
Ammonia aomoriensis (as
A. beccarii: [65]), and
Ammonica beccarii [66] have all been linked to adverse environmental conditions caused by OM enrichment and severely hypoxic bottom waters. Possible features behind the superiority of the opportunists in stressful conditions can be related to the presence of specific intracellular complexes in the living cell (
S. fusiformis:
[67]); ability to denitrify (
S. fusiformis:
[68]), adjust the depth of habitation in the sediment (
E. incertum:
[51]), as well as dormancy inside of a protective cyst (or not) during unfavorable conditions such as anoxia (
E. incertum:
[51,69][51][69]), reduced temperature (
Ammonia tepida:
[68]), temperature and chemical exposure (
Amphistegina gibbosa:
[70,71][70][71]), or extended darkness
[72].
Figure 2. Overview of foraminiferal applications within biomonitoring studies, including (a) EcoQS indices based on species diversity and sensitivity; (b) reconstruction of preindustrial baseline (reference conditions); (c) accumulation of pollutants (e.g., heavy metals and microplastics) within foraminiferal shells; (d) species responses to environmental stress present in situ (e.g., field studies) and (e) simulated in the lab (e.g., culturing experiments); and (f) genomic methods, such as eDNA and sedaDNA.
3. Foraminiferal Biotic Indices
Methods to collect and process benthic foraminifera vary widely in sample acquisition, the sampling gear used, sub-sampling, replication, preservation, preparation, and analysis. In an attempt to address these inconsistencies, Schönfeld et al.
[73] proposed using a unified international protocol following a workshop by FOBIMO (Foraminiferal Biomonitoring) group members, which occurred in 2011 in Fribourg, Switzerland. A group of 37 scientists collaborated in the effort to guarantee reproducibility and comparability across studies, with a mind to be adaptable to local conditions
[73], inspiring more working groups worldwide to accept foraminifera as a promising BQE to assess EcoQS in contemporary environments. In recent years, however, with the wider acceptance and refinement of the methodology, the momentum of foraminifera index application is gathering rapidly. New foraminiferal indices have been developed, applied, and contrasted between a more extensive range of transitional waters and stressors . Below, we provide an overview of foraminiferal indices developed to our knowledge to date based on species diversity and sensitivity and used for EcoQS assessment in transitional waters.
3.1. Foraminiferal Diversity Indices
Using benthic foraminiferal diversity indices, together with associated geochemical parameters, to specifically address human environmental impact was first implemented by Alve et al.
[21] investigating changes of ecological status back in time (referred to as paleo-EcoQS)
[21]. Although the concept of using foraminiferal diversity had been applied to anthropogenic stress biomonitoring studies earlier
[33[33][35],
35], Alve’s pioneering study was based on sediment archives from Oslofjord, Norway, where the authors used foraminiferal data to obtain the Hurlbert’s ES (100) and Shannon–Wiener H’ (log2) indices, (
Table 2), which are the benthic macrofauna diversity indices used by the Norwegian Environmental Protection Agency to assess EcoQS. The work of Alve et al.
[21] demonstrated that foraminiferal indices reliably reflect the history of pollution in the region and can be used to obtain the preindustrial reference conditions from “beyond time intervals covered by observational biological time-series”. Since the first use of benthic foraminiferal-based diversity indices, the methodology has been adjusted by Bouchet et al.
[74], who used Hill’s number (N1) Exp (H’
bc) (1973) and developed novel quantitative threshold values for the EcoQS categories (
Table 3)
[74].
Table 2. Threshold values for determining EcoQS classes according to Hlog2 and ES100
[75], Exp (H’
bc)
[49[49][74],
74], TSI-Med
[50], FSI
[76], Foram-AMBI
[77], and NQIf
[75].
| EcoQS and Associated Color Code |
Bad |
Poor |
Moderate |
Good |
High |
| TSI-med |
| 0.45–0.54 |
| >0.54 |
Table 3. Threshold values for determining EcoQS classes according to Hlog2 and ES100
[75] and Exp (H’
bc)
[49,74][49][74].
| EcoQS and Associated Color Code |
Bad |
Poor |
Moderate |
Good |
High |
| <1 |
1–2 |
2–3 |
3–4 |
>4 |
| H’log | 2 |
<1.2 |
1.2–1.8 |
1.8–2.4 |
2.4–3.4 |
>3.4 |
| FSI |
>5.5 |
4.3–5.5 |
3.3–4.3 |
1.2–3.3 |
<1.2 |
| ES100 |
<9 |
9–11 |
11–13 |
13–18 |
>18 |
Foram-AMBI |
>5 |
3.2–5 |
1.8–3.2 |
0.9–1.8 |
<0.9 |
| Exp(H’ | bc | ) (>125, living, Norwegian fjords) |
<2.5 |
2.5–5 |
5–7.5 |
7.5–10 |
>10 |
NQI | f |
<0.13 |
| Exp(H’ | bc | 0.13–0.31 |
) (>63, living, Norwegian fjords) |
<5 | 0.31–0.45 |
| 5–10 |
10–15 |
15–20 |
>20 |
| Exp(H’ | bc | ) (>63, living, Italian transitional waters) |
<3 |
3–7 |
7–11 |
11–15 |
>15 |
The foraminifera-based Exp (H’
bc) method has, since then, been successfully tested in a variety of transitional waters, i.e., fjords
[74], lagoons
[78], harbors
[61], bays
[78], and estuaries
[25[25][79][80],
79,80], in both subtidal
[49] and intertidal conditions
[78]. Furthermore, the index was successfully implemented in different biogeographical regions, i.e., Scandinavia
[19], European Atlantic coasts
[23[23][78],
78], the Mediterranean Sea
[49], and in South America in Brazil
[25]. All these studies have demonstrated several advantages of using benthic foraminifera-based diversity indices. Index Exp (H’
bc) has shown a statistical relationship observed between the foraminiferal distribution and environmental parameters, such as organic matter enrichment in the context of aquaculture
[71[71][81],
81], sewage outfall
[82], or metal pollutants such as copper (Cu), zinc (Zn), and lead (Pb)
[48]. It is, however, important to note that recording such correlations does not necessitate a causal link without considering other key parameters and synergistic effects known to influence benthic foraminifera (e.g., organic carbon flux, salinity, sediment pore-water hypoxia/anoxia), which usually require lab culturing and controlled experimentation
[21]. Despite this, studies using the Exp (H’
bc) index have been shown to be applicable to different stressors and in disparate biogeographic regions, presenting the potential for wider application, which can be supplemented by more detailed lab-based experimentation. The studies have also found some shortfalls, e.g., the accuracy of the results is dependent on the sampling effort (number of replicates), high seasonal variability may affect EcoQS assessment, and that the method needs to be better adjusted to the naturally low baseline diversity in transitional waters
[21,74,83][21][74][83].
3.2. Foraminiferal Sensitivity Indices
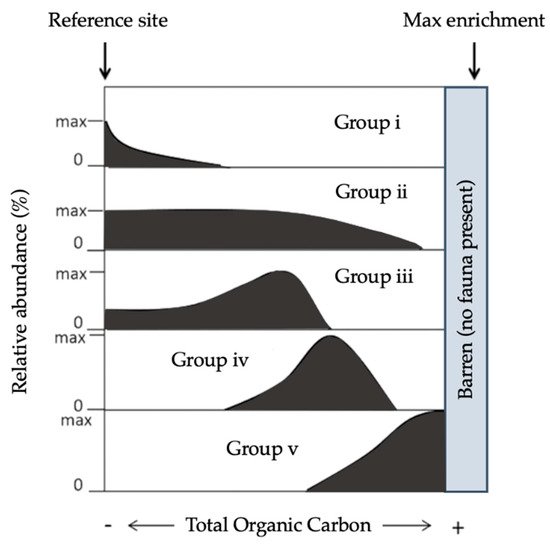
Sensitivity indices, strictly speaking, are based on a theoretical succession of species of each sensitivity category along a certain perturbation gradient (
Figure 3). Based on ecological preferences, the taxa are assigned to various sensitivity categories, which are given a numerical ranking, varying from 1–5 or even higher depending on the target specificity. The species abundance in each category changes with the amount of OM, other pollution, or stress within the environment; this delineates the biotic state of the site. This approach has some limitations, as it oversimplifies species response to environmental parameters if only considering TOC. Specifically, it is questionable if this method to assign species according to their response to TOC gradients is also applicable in transitional waters, where TOC is reflecting both labile and refractory OM
[11][12]. Noticeably, it was, however, not possible to assign typical salt marsh species from the English Channel, the European Atlantic coast, and the Mediterranean Sea
[84] due to the presence of labile and refractory OM that hampers TOC characterization
[85,86][85][86].
Figure 3. Theoretical relative abundance patterns for benthic foraminifera species along the main stress gradients (total organic carbon), grouped into the five ecological categories adapted from
[77,87][77][87].
In this section, some examples of sensitivity indices (
Table 2) used to evaluate foraminiferal assemblage response to environmental stressors are presented and discussed, and those include indices such as FIEI
[88[88][89],
89], TSI-Med
[51], FSI
[76], and FoRAM-Index
[86,90,91][86][90][91]. Some indices are designed to evaluate the statuses of warm-water coral reefs. We chose to include those indices herein, as some transitional waters such as fjords in Norway and New Zealand are also known to host cold-water coral reef ecosystems
[92]. We also discuss how the natural features of transitional waters may affect the outcome of sensitivity-based foraminiferal indices such as Foram-AMBI and comparable methods
[79,93][79][93].
3.2.1. Foraminiferal Index of Environmental Impact (FIEI)
In response to drill-cutting disposal taking place in tropical east Atlantic outer shelf environments, Mojtahid et al.
[88] designed the Foraminiferal Index of Environmental Impact (FIEI). This index is calculated as the cumulative percentage of all pollution-tolerant and/or opportunistic species observed within a system. Here definition of the “opportunistic species” was based on their patterns of distribution throughout the study area; this was combined with the comparison of the contemporary assemblage, in the uppermost 0–2 cm, with that preserved 2–3 cm below the surface of the sediment. The lower sediment intervals were used as the pre-impact “baseline conditions”
[88,89][88][89]. This technique has been shown to be more discriminative than macrofaunal indices applied in the same study area, highlighting the benefits of foraminifera in providing a working ecological baseline for biomonitoring
[87]. However, such an approach may suffer from circular thinking, as it implies testing the index on the same data set used for the classification of species into tolerant and opportunistic groups. The formula for the FIEI index is given below:
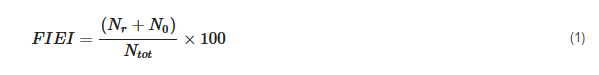
where
Nr is the total quantity of pollution-resistant taxa,
N0 is the number of individuals of opportunistic taxa, and
Ntot. is the total number of counted foraminifera.
3.2.2. Tolerant Species Index (TSI-Med)
Later, working at the French Mediterranean coast, Barras et al.
[50] concluded that an index based on the relative proportion of stress-tolerant foraminiferal taxa within a system was the most indicative metric of environmental quality”
[50]. Several other parameters were tested in conjunction with stress-tolerance proportion: diversity, indicative species groups, and wall structure proportion, but due to highly variable coastal conditions, all of which were ruled out as lacking significant correlation with coastal ecosystem quality
[50]. This index was named the Tolerant Species Index for the Mediterranean (TSI-Med or % TSI) and was developed in response to recent changes to the ecological conditions observed in coastal areas, where there has been strategic clustering of industrial development
[50]. The formula for the TSI-Med index is given below:
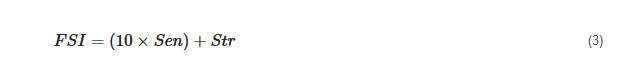
where
Sen is sensitive taxa, and
Str is stress-tolerant taxa.
3.2.4. Foraminiferal AZTI Marine Biotic Index (Foram-AMBI)
Foram-AMBI has been used in several notable studies
[84,87,93][84][87][93] and has been suggested as an additional assessment element to be incorporated into WFD and MSFD’s coordinated approach
[77]. Taken from Grall and Glémarec
[97][94] and Borja et al.
[98][95], this index was adapted from the AMBI index (originally used to classify macrofauna). Noticeably, benthic macrofaunal species are traditionally assigned to five groups of sensitivity to OM
[96,98][96][95] based on the seminal work of Pearson and Rosenberg (1978). Species are meant to be indicative of the prevailing environmental conditions, i.e., the level of organic carbon enrichment where they are found. The following characteristics were used to assign benthic foraminiferal species to the five ecological groups (EGs:
Figure 3) considering their response to TOC
[84,87,94,97,98][84][87][97][94][95]:
Group V (EGV): “sensitive species” are sensitive to TOC enrichment. Their relative abundance is highest at the lowest TOC values and drops to zero as organic carbon concentration increases.
Group II (EGII): “indifferent species” are indifferent to the initial stages of organic carbon enrichment and never dominate the assemblage. They occur in low relative abundance over a broad range of organic carbon concentrations but are absent at very high concentrations.
Group III (EGIII): “tolerant species” are able to endure excess organic carbon enrichment. They may occur at low TOC; their highest frequencies are stimulated by organic carbon enrichment, but they are absent at very high organic carbon concentrations. This group has been termed “third-order opportunistic species”
[94][97].
Group IV (EGIV): “second-order opportunistic species” show a clear positive response to organic carbon enrichment with maximum abundances between the maxima of EGIII and EGV (
Figure 3).
Group V (EGV): “first-order opportunistic species” exhibit a clear positive response to excess organic carbon enrichment with maximum abundances at a higher stress level induced by organic load than species belonging to EGIV. At even higher TOC concen- trations, foraminifera are not able to survive.
The abundance of each category of taxa is indicative of the EcoQS of the environment (
Figure 3). Here, the Foram-AMBI index is applied to benthic foraminifera; calculated in the same manner as it was previously designed for macrofauna
[98][95]:
Foram-AMBI was first used in the Northeast Atlantic, Arctic fjords, continental shelves, and upper slopes by Alve et al.
[77]. In this study, the correlation between TOC and the species sensitivity assignment was based on 19 publications and was tested against independent validation data sets (VDS) to avoid circular arguments
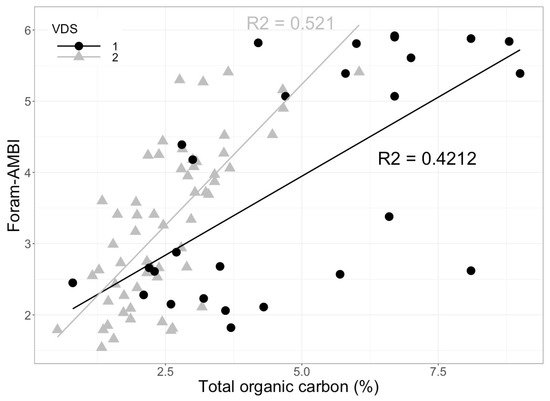
[77]. The results confirmed that in organically enriched systems, foraminiferal sensitivity, reflected in assemblage changes, correlates well with TOC gradients (
Figure 4). Recently, the assignment of species to the five EGs in transitional waters along the English Channel, European Atlantic coast, and in the Mediterranean Sea allowed for further implementation of Foram-AMBI in transitional waters
[84]. The results showed similar correlations to those observed in Alve et al.
[77]. A significant positive correlation was observed between Foram-AMBI and organic matter in the two validation data sets. In one of the VDS, the results from Foram-AMBI were also compared to the macrofaunal AMBI index at the same sites, yielding a significant correlation (R
2 = 0.56,
p < 0.01) between both indices and adding to the support for benthic foraminifera as a reliable BQE. These applications support the implementation of Foram-AMBI. However, recent studies
[49,99][49][98] already suggested to re-assign some species (originally assigned by Alve et al.
[77]) into different groups. Except for the Mediterranean Sea
[87], the best professional judgment was not used to support the outcome of the numerical approach to assign foraminiferal species to ecological groups
[77,84][77][84]. We suggest here that a combination of expert judgment informed by literature review and numerical methods should be used in order to obtain the best possible species assignments.
Figure 4. Foram-AMBI index plotted against the total organic carbon (%) in the sediments
[94][97] regression line for validation data set 1 from the Norwegian Skagerrak (VDS 1) is shown by the black line and for validation data set 2 from the Oslofjord (VDS 2) is shown by the grey line (raw data from J. Dolven and E. Alve).
3.2.5. Foraminifera in Reef Assessment and Monitoring (FoRAM-Index)
The use of foraminifera-based sensitivity indices for EcoQS goes all the way back to 2003 when Hallock et al.
[90] developed the FoRAM-Index (Foraminifera in Reef Assessment and Monitoring) to assess the health of tropical coral reef systems. The FoRAM-Index groups foraminifera associated with coral reefs into three categories: large benthic foraminifera, other small heterotrophic taxa, and stress-tolerant foraminifera. The foraminiferal assemblages typically found in reef environments have been shown to be indicative of both the ambient water quality and reef recovery via nursery transplants or coral recruitment. Additionally, the FoRAM-Index was designed to require only limited computing abilities and hinges on uncomplex calculations, making it user-friendly and easy to implement worldwide for researchers of varying expertise
[90]. Since its inception, FoRAM has been successfully applied by 23 separate studies
[91] and is able to provide resource managers with data to determine the suitability of benthic habitats for communities dominated by photosymbiont-bearing organisms. The formula for the FoRAM-Index is given below:

where
Ps represents the proportion of symbiont-bearing,
Po stress-tolerant, and
Ph other heterotrophic taxa.
3.3. Foraminiferal Multi-Metric Index
Lastly, Alve et al.
[75] proposed a new foraminifer-based multimeric index (NQI
f) based on the macrofaunal Norwegian Quality Index (NQI) and tested it in Norwegian fjords on the Skagerrak coast
[75]. The study combined paired samples of benthic macrofauna and foraminifera with associated bottom water dissolved oxygen and sediment TOC data. The two BQEs (foraminifera and macrofauna) were intercalibrated via linear regression, and the threshold values for the EcoQS categories were based on those already defined for macrofauna-based indices by the Norwegian governmental guidelines.
This index is composed of the following metrics: (i) a diversity component InS/In (InN), where S is the number of taxa and N is the abundance, (ii) a sensitivity component (AMBI), and (iii) a correction factor to down-weight artificially high diversity values in small samples (few individuals, N/N + 5). Both the macrofaunal and foraminiferal NQI were found to be significantly correlated with bottom water dissolved oxygen concentration; however, in very low oxygen conditions, only foraminifera could be used for EcoQS assessment because macrofauna were absent
[75].
The index is an algorithm, where equal weight is given to diversity (50%) and sensitivity (50%) and is formulated as follows:
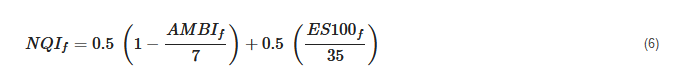
where
AMBIf represents Foram-AMBI and
ES100f represents foraminiferal diversity expressed as Hurlbert’s index.
4. Comparison of EcoQS Indices
4.1. Various Foraminiferal Indices: How Well Do They Perform When Used at the Same Site?
Research shows that foraminifera-based indices have the potential to reveal the ecological status preceding anthropogenic disturbance and are capable of setting informed reference values
[26,48,49,91,100,101,102,103][26][48][49][91][99][100][101][102]; see
Section 5.2 below. To produce meaningful actions, however, the results must be comparable and congruous with each other. At the same time, studies aiming for a comparison of these disparate indices and methodologies reveal some discrepancies in the consensus reached. Below, we provide a case study exemplifying this.
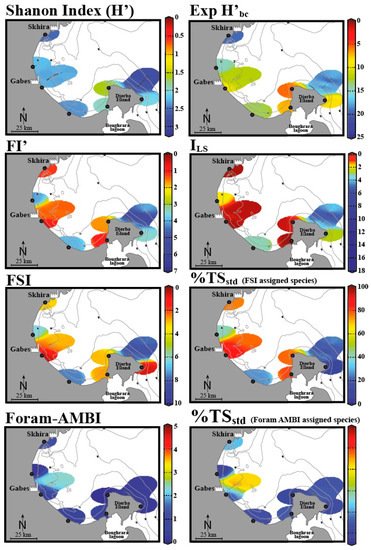
The study by El Kateb et al.
[48] assessed EcoQS along the Gulf of Gabes (Tunisia) and incorporated the diversity indices such as Shannon Index (H’), Exp (H’
bc), sensitivity indices FSI, % TS
std (using the FSI- assigned species), % TS
std (using Foram-AMBI assigned species), FI’ (Modified FoRAM-Index), and I
LS (“long versus short life span” index), which can be considered in combination
[48]. Developed by Mateu-Vicens et al.
[104][103], FI’ and I
LS rely on foraminifera associated with meadows of the seagrass, present at several locations within the Mediterranean Sea
[104][103]. This study demonstrated that each of these indices assessed EcoQS differently (
Figure 5). To understand the reason for this, we must look to the assumptions and criteria considered in each index, as well as the varying geomorphological regimes along the gulf. The indexes that recorded the worst EcoQS values were FI’ and I
LS epiphytic foraminiferal indices, FSI, and % TS
std (FSI-assigned species). Conversely the best EcoQS was reported by Foram-AMBI, % TS
std (Foram-AMBI-assigned species), and Shannon Index (H’), while Exp (H’
bc) demonstrated intermediate EcoQS values. Begging the question, are the former indices more sensitive to environmental stress than the latter ones? Or perhaps these results reflect the situational aptitude of each index and how compounding environmental variables influence their efficacy? To begin with, FI’ and I
LS, both being epiphytic foraminiferal indices, reported predominantly “bad” to “poor” EcoQS along the gulf. These indices rely on the presence of sea grass meadows, which have been in decline due to increasing environmental stress. In the absence of such habitats, there are no epiphytic foraminifera, and the area is recorded as “poor”, meaning these indices reflect the lowest values indicative of unsuitable growth conditions. El Kateb and colleagues concluded that these indices correctly reflect the ecological status of the area due to seagrass
Posidonia oceanica’s sensitivity to environmental conditions. Epiphytic indices can, hence, only be used in areas that are known to be suitable for seagrass growth.
Figure 5. The EcoQS assessment in the Gulf of Gabes (Tunisia) using various foraminifera-based indices (data is spatially interpolated using DIVA software). Adapted from
[48]. Colours indicate various EcoQS classes: blue—high, green—good, orange—moderate, yellow—bad, red—poor.
In contrast, Foram-AMBI, % TS
std (Foram-AMBI assigned species), and the Shannon Index (H’) suggest comparatively unpolluted conditions; to explain this, the authors used two distinct systems sampled from the Gulf region: Gabes, a more polluted area with organic enrichment and fine sediments, and Djerba, with coarser sandy sediments. The near shore silt and mud at Gabes is also reported to be rich in heavy metals (Pb, Li, Zn, Cu) and phosphorous due to industrial waste discharge. Sites with fine sediments appear to be more suitable for application of Foram-AMBI, % TS
std (Foram-AMBI-assigned species), and % TS
std (FSI-assigned species); as the aforementioned indices are all sensitivity-based, the link here is explained by opportunistic/stress-tolerant species dominating systems. In Djerba, with sandy sediments, however, the contrary was observed; here, the diversity indices Exp (H’
bc) and H’ as well as the epiphytic indices FI’ and I
LS exhibit a stronger relationship. El Kateb et al. further addresses Foram-AMBI alone, pointing out that this index was developed to reflect an increasing OM gradient, relying primarily on sediment mud content, dissolved oxygen, and pollutants, such as metals and polychlorinated biphenyls (PCBs). In the areas of the gulf that do not exhibit these conditions, the index becomes less useful. This highlights that it is essential to understand the components of each index to ensure the results will be representative of the site and that it is advisable to use and compare several indices to reach the soundest conclusion
[19].
4.2. Palaeoecological Applications: Toward the Definition of Reference Conditions
In contrast to most benthic macrofauna, the preservation of benthic foraminiferal tests provides information about long-term environmental and biological changes
[19,21,23][19][21][23]. Hindcasting approaches (i.e., the use of historical information) are one of the methods recommended by marine legislations to determine reference conditions. Such approaches imply the existence of long-term monitoring or fossil records of taxa used to characterize the EcoQS. Different studies further confirm that fossil benthic foraminifera can enable the reconstruction of in situ local reference conditions in transitional environments with long-term pollution history to determine either contemporary EcoQS or its evolution over time and may contribute to deciphering between natural and anthropogenic stresses. For instance, a more robust assessment of EcoQS for transitional waters was obtained with benthic foraminifera using site-specific local reference conditions in the Oslofjord, Norway
[19], in the Boulogne sur Mer harbor, France
[23], and in the Santos estuary, Brazil
[25]. Furthermore, geochemical analyses of dated sediment cores can be used in combination with benthic foraminifera to determine ecological reference conditions in transitional waters
[20,26][20][26].
In the Oslofjord (Norway)
[19], the results from applying ES100, H’
log2, and Exp H’
bc diversity indices were found to be consistent with physical and chemical parameters at the site (metals, TOC, and dissolved oxygen). Furthermore, the temporal pattern and scale of change shown by each of the indices are still the same, and this can be used to define deviation from the reference conditions, regardless of the index used. For instance, in Boulogne sur Mer Harbor, local reference conditions from the pre-impacted period allowed the authors to accurately assess EcoQS based on the ecological quality ratio or EQR
[23].
The EQR (
Figure 1) is the ratio between the value of the observed biological parameter for a given water body and the expected value under reference conditions
[4] and is in line with the WFD definition of EcoQS. The ratio ranges as a numerical value between 0 and 1, with high ecological status represented by values close to one and bad ecological status by values close to zero. The EQR boundaries to define Palaeo-EcoQS were determined using the “Reference Conditions Working Group” recommendations
[105][104]. Type-specific reference conditions (including hydromorphological and physicochemical conditions unique to each water body) are the anchor point of EQR based classifications. Hence, the EQR approach can also be used to resolve issues related to the definition of threshold values. Using the foraminiferal fossil record, it is possible to determine in situ local reference conditions. For example, in the Santos estuary (Brazil), the highest value of diversity in ~1902, i.e., Exp (H’bc) of 11.66, corresponds to the pre-impacted period and was defined as the reference value. The EQR was calculated accordingly: EQR = Exp (H’bc)observed value/Exp (H’bc)reference value
[25]. In that study, the foraminiferal fossil record allowed evaluation of Palaeo-EcoQS based on in situ local reference conditions in accordance with the environmental history of the region.
4.3. Palaeoecological Applications: Defining Correct Threshold Values
EcoQS value uncertainty, due to lack of intercalibration between threshold values, presents some issues for using living foraminiferal assemblages in transitional environments. This can also be observed in Palaeo-EcoQS assessment, which may be exacerbated by preservation bias. By applying the Exp (H’bc) diversity index and threshold values from two separate publications, Bouchet et al.
[74] and Bouchet et al.
[49], to the foraminiferal assemblage data from Idefjord, the EcoQS of the fjord can be categorized very differently
[49,74][49][74]. Using threshold values from Bouchet et al.
[49], the resulting fjord EcoQS is “Moderate” to “Bad”, with a slight reprise back to “Moderate” observed in the early 2000s. The low natural diversity of the system presents as only “Moderate” EcoQS even back to the 1800s, before the time when the anthropogenic activity began to significantly impact the system, highlighting that indices must be adjusted when applied to transitional waters
[24]. Conversely, when the “dry picking” threshold values from Bouchet et al.
[74] are applied, the fjord shows mainly “Good” EcoQS values until 1890, where the EcoQS decreases to “Moderate” and “Bad”.
The chosen threshold values from Bouchet et al.
[74] were based on foraminiferal assemblages from dry picking the >125 μm sediment fraction, while thresholds from Bouchet et al.
[49] are also “dry picking” but “63 μm fraction” boundaries modified after Bouchet et al.
[74] based on using the PERSE method (Procedure to Establish a Reference State for Ecosystems
[106][105]); a multivariate non-parametric approach to calculate the relative reference states against which EcoQS fluctuations can be detected and quantified. In contrast, the Exp (H’bc) diversity values (Bouchet et al.
[49]) adjusted for the Mediterranean, due to higher species diversity, obviously underestimate changes of EcoQS in Nordic fjord waters. This is an example of issues related to latitudinal diversity gradients and the effect of these on the characterization of transitional water ecosystems across the globe, which makes a strong case against using “universal” threshold values. Among other issues important to consider when setting threshold values or EcoQS boundary classes are sediment size-fraction analyzed for foraminifera, number of replicates, dry versus wet picking method, and sediment characteristics on a site (soft-bottom muddy sediments versus silty and sandy deposits). Hence, future studies should make efforts toward using class boundaries adjusted locally and base these on the above-mentioned characteristics, as well as on local reference conditions. Other possible means to adjust the threshold values can be: indicator equations (a theoretical approach aimed at finding a correspondence between the index equations), reference indicators (a separate indicator used to calibrate other indicators), and indicator distribution laws mathematical properties of the indicator values (such as distribution laws, which are used to obtain the same proportion)
[107][106].
4.4. Taphonomical Processes and EcoQS Indices
Another key aspect in characterizing contemporary environmental and paleoenvironmental changes accurately is understanding the difference between living and dead benthic foraminiferal assemblages and all the factors that may lead to their formation
[60]. Foraminiferal biomonitoring studies based on total assemblages, particularly those aimed at characterizing environments that have undergone recent and extensive habitat modification, either intentionally (e.g., through aquaculture and marina construction) or unintentionally (e.g., agriculture leading to deforestation and subsequent erosion), are susceptible to bias interpretations due to taphonomic (post-mortem) processes affecting the tests (see review in
[108][107])Those processes, including transportation, CaCO
3 dissolution, and test breakage, can occur more readily post-mortem and impact species composition of the total assemblages together with seasonal population shifts (different species having peaks during different times of the year) and influxes of allochthonous taxa to the area. In highly stratified fjords, for example, it has been demonstrated that sediment archives may also be heavily biased toward agglutinated species due to seasonal hypoxia and carbonate dissolution
[47,109][47][108]. Some studies performed in shallow estuaries showed that seasonal changes of redox conditions can cause almost complete dissolution of calcareous component of the assemblages resulting in total assemblages being strongly dominated by agglutinated foraminifera
[47[47][108][109][110],
109,110,111], local hydrodynamism in estuaries may hamper the preservation of foraminiferal fauna by sediment resuspension and mixing
[112][111] and bioturbation processes by macro-invertebrates may enhance Fthe homogenization of the upper-sediment layers
[107][106]. Hence, it is important to recognize the conditions that lead to the highest preservation of foraminifera tests and understand how best to adjust data from sub-optimal conditions to most accurately reflect the true ecological conditions of a site. For instance, at the Saquarema lagoon system in Brazil significant difference was found between the living and dead assemblage distributions
[60]. These differences were attributed to the hydrodynamic conditions and seasonal variation.
To reduce the effect of taphononomic or post-mortem bias, Belart et al.
[60] suggest that in homogenous systems, areas with high living-dead assemblage similarity may be the primary target for palaeo-environmental assessment (to inform the baseline reference conditions)
[60], whereas in highly heterogeneous areas, such transitional waters, an alternative approach would be to undertake palaeoecological studies at all stations and adjust the recorded total assemblages by conversion factors inferred from a DCA or PCA plot
[113][112]. Here, the trade-off between effort (time, expertise) input and representative data output must be considered on a site-to-site basis as significantly more extensive data treatment and analysis would be involved.
4.5. Comparison of Foraminifera-Based Ecoqs Indices with Traditional Macrofauna-Based Indices
Increasingly, a multi-metric approach, incorporating several biomonitoring strategies, is being adopted across international management operations; for example, the macrofauna-based Norwegian Quality Index, which employs a sensitivity component with the AMBI index in combination with the H’log
2 and ES
100 diversity
[114,115][113][114]. In fjords of Norway, Alve et al.
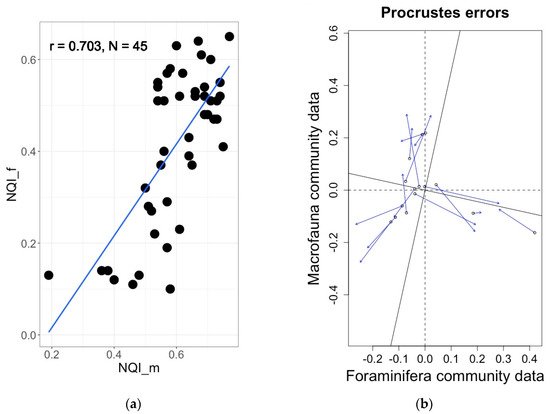
[75] has shown that applying an adapted version of the macrofaunal NQI to foraminifera (NQI
f) yields a similar indicator efficiency as its macrofaunal equivalent (
Figure 6a); eventually concluding that foraminifera should be included among the biological elements defined by the WFD and used for EcoQS assessment
[75]. Another example from Norwegian fjords, where the benthic foraminiferal communities were shown to significantly correlate with benthic macrofaunal ones, comes from the study of Bouchet et al.
[84] (
Figure 6b). Furthermore, in the oyster farming areas of the Pertuis Charentais (France), Foram-AMBI and macrofaunal AMBI were also significantly correlated
[84]. All these examples suggest that other benthic foraminiferal indices may correlate significantly with their macrofaunal counterparts, demonstrating that benthic foraminifera-derived indices can be used to complement the results of other BQEs and can be applied where macrofauna are absent or difficult to sample.
Figure 6. (
a) Significant correlation (R = 0.70,
p < 0.0001) between foraminiferal and macrofaunal NQI indices in Norwegian fjords
[75]. (
b) Significant correlation (procrustes errors analysis m2 = 0.66,
p = 0.001) between foraminiferal and macrofaunal communities in Norwegian fjords
[83].