The recruitment of new vasculature via angiogenesis is a critical component of tumor development, which fundamentally influences tumor growth and response to treatment. The characterization of tumor-induced angiogenesis via mathematical models could enable approaches to forecast tumor response and improve patient care.
- computational oncology
- magnetic resonance imaging
- perfusion
- partial differential equations
- confocal microscopy
- systems biology
- treatment response
- vascular growth
- computational fluid
1. Introduction
In the early stages of tumor growth, a small population of tumor cells is supported by existing tissue vasculature and the diffusion of nutrients through the extravascular space. As this small population of tumor cells continues to grow, it may eventually reach a size where the diffusion of nutrients from existing vasculature is insufficient to support continued growth. Through the process of angiogenesis, new blood vessels are recruited from nearby vasculature to provide the crucial infrastructure needed to sustain further expansion of the tumor [1]. These three key points inform the foundation of many mathematical models of angiogenesis and arose from the seminal work on tumor angiogenesis by Folkman [1,2][1][2] and others [3,4][3][4] over the past half a century. Additional studies on angiogenic signaling [5,6][5][6] and vasculature properties [4,7][4][7] have also greatly influenced the development of a mathematical theory on angiogenesis. One notable observation was that compared to healthy appearing vasculature, tumor-associated vasculature has substantial structural and functional abnormalities characterized by non-hierarchical vessel networks, heterogeneous blood flow, and heterogeneous permeability [4,7][4][7]. These irregularities significantly influence the delivery of nutrients and removal of waste, while also having substantial implications on systemic and radiation therapy [8].
Quantitative and time-resolved imaging approaches, such as confocal imaging, photoacoustic imaging, and magnetic resonance imaging (MRI), could provide the necessary data to initialize, calibrate, and validate models of angiogenesis. Specifically, time-resolved imaging techniques of the vasculature have matured to the point where they can define or estimate subject-specific structural (e.g., vessel order and location) and functional (e.g., vessel permeability, blood flow) model parameters that would enable in silico investigations of tumor and vasculature dynamics [17][9].
The mathematical modeling of tumor angiogenesis at the cell scale has developed into a rich literature over the last few decades [22,23,24,25,26,27][10][11][12][13][14][15]. These models aim to give a rigorous mathematical description of tumor angiogenesis to enable the systematic investigation of the underlying biology that dictates vascular sprouting, perfusion, and response to therapy. By employing such models, it is possible to simulate and test scenarios in silico that are not easily tested experimentally. For example, comparing the limitless number of therapeutic regimens that can be constructed with varying dosing schedules and concentrations is experimentally intractable, but with a mathematical model these can be simulated and analyzed to select the optimal regimen [28][16].
2. Experimental Techniques across Scales
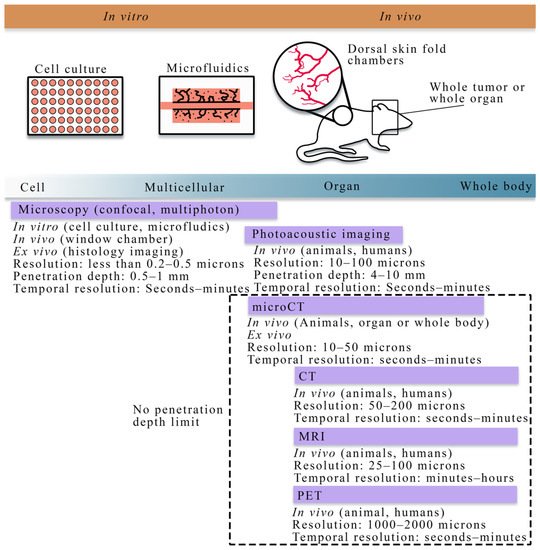
Figure 1 summarizes the cell to tissue scale approaches for imaging experiments, while TableTable 1 1 lists the imaging techniques and the literature that integrates those techniques with mathematical theory at the cell and tissue scale.
| Modality | Scale | Measurement | Uses in Literature |
|---|
| Microscopy (confocal, multiphoton, optical projection tomography, histology imaging) | Cell to tissue | Vascular structure, individual cell types, vessel porosity, flow | [18,76, | [ | 77, | 18][ | 78, | 19][ | 79,80] | [17]20][21][22] |
| Photoacoustic imaging | Cell to tissue | Vascular structure, blood oxygenation | [81,82] | [23][24] | ||||||
| Angiography (X-ray, CT, MRI) | Tissue | Vascular structure | [47,48,83,84] | [25][26][27][28] | ||||||
| Dynamic contrast-enhanced MRI or CT | Tissue | Perfusion, permeability, blood volume fraction | [28,32,33,85,86] | [16][29][30][31][32] | ||||||
| PET | Tissue | Perfusion, permeability, blood volume fraction | [83,84] | [27][28] | ||||||
| microCT | Tissue | Vascular structure | [47,48,83,84] | [25][26][27][28] |
2.1. Quantitative Techniques for Observing Tumor Vasculature and Angiogenesis at the Cellular Scale
At the cellular scale, microscopy is the dominant imaging technique for providing quantitative measurements of tumor vasculature with a spatial resolution on the order of microns. Confocal microscopy, combined with immunofluorescence staining, has been used to acquire high resolution, temporally resolved images of vascular structure in angiogenic and vasculogenic assays [34,35,36][33][34][35]. This technology allows for analyzing in vitro spatial distributions of fluorescently labeled cell lines and can be coupled with fluorescing microspheres to investigate vascular integrity, enabling the integration of quantitative fluorescence measurements with mathematical modeling. Furthermore, confocal microscopy has also been utilized in vivo to investigate functional microcirculation [37][36] in tumor-associated vasculature, the effects of radiotherapy [38][37] on neovasculature, and the oxygen distribution [39,40][38][39] in dorsal skin fold chambers [41][40]. While intravital microscopy provides a high-resolution longitudinal analysis in vivo, the chamber may alter the tumor-vasculature dynamics and it is fundamentally limited in the length of study (generally 2–3 weeks), and the number of imaging time points. Multiphoton microscopy [42][41], in comparison to confocal microscopy, has improved depth penetration and confines excitation to the focal plane of the lens, thereby decreasing the photodamage to the tissue. For many biological applications, tissue depths of ~500 microns can be imaged over time [42][41].
In addition to microscopy, photoacoustic imaging offers high spatial resolution (10–100 microns) while also being able to reach tissue penetration depths of around 4–10 cm [43,44][42][43].
2.2. Quantitative Techniques for Observing Tumor Vasculature and Angiogenesis at the Tissue Scale
Ex vivo and in vivo imaging play a central role in understanding the morphology and function of tumor vasculature and angiogenesis. In particular, ex vivo imaging techniques, including histology imaging [45][44] and micro-CT [46[45][25][26],47,48], can quantify tumor microvasculature and angiogenesis on excised tissue specimens and serve as the gold standard measurement. Less invasive observations of tumor-associated vasculature can now be achieved thanks to the development of in vivo imaging techniques [49][46], such as x-ray [50][47] and computed tomography (CT) [51[48][49][50],52,53], positron emission tomography (PET) [54[51][52],55], MRI [52,56,57,58[49][53][54][55][56][57][58][59],59,60,61,62], and optical imaging [63,64][60][61]. There are two main classes of imaging techniques applied to studying tumor-associated vasculature: (1) angiography, which is a technique used to visualize the vasculature structure, and (2) functional techniques used to quantify the properties of the tissue and vasculature. In conventional planar x-ray angiography [50][47], the patient is catheterized so that an iodinated contrast agent can be administered intravenously and then observed with fluoroscopy, thereby enabling the observation of the vascular architecture. CT angiography is an extension of x-ray angiography that enables the visualization of vessel structures in 3D. CT angiography has been commonly used to identify the location and anatomy of tumor-associated vessels (especially for pancreatic tumors), which plays a valuable role on diagnosis and the management of chemotherapy and surgery [65,66,67][62][63][64]. Magnetic resonance angiography (MRA) is an alternative approach that does not use ionizing radiation and can be used to visualize blood vessels, especially large arteries and veins [56][53]. MRA techniques aim at enhancing the contrast between blood vessels and the background tissue based on either the effects of blood flow on MR signal or the injection of exogenous contrast agents, thereby allowing for the quantification of several morphological characteristics of the vasculature, such as vessel tortuosity, density, diameter, and branching patterns as well as feeding and draining vessels [68,69][65][66].
3. Approaches for Modeling Tumor Vasculature at the Cell Scale
3.1. Mathematical Modeling of Tumor Vasculature and Angiogenesis at the Cell Scale
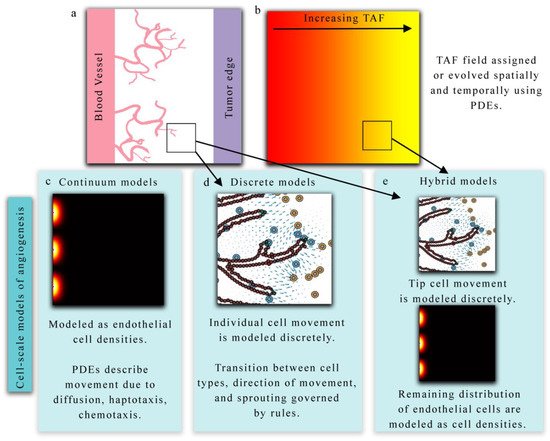
The continuum, discrete, and hybrid modeling approaches above provide complementary information on angiogenesis, and the choice of modeling approach is dependent on the desired goal or quantity of interest from the model itself. The primary advantage of using a continuous representation of tumor vasculature is the low computational cost, and the ability to utilize sophisticated parallel solvers for continuum equations. However, a continuum approach lacks the ability to resolve local key features of the changing vasculature including, for example, the activation of TECs (the cell responsible for directed migration) and the competition for the TEC phenotype among other TECs and neighboring endothelial cells. Discrete models can resolve these local features but become computationally expensive as the number of cells increase. Hybrid models balance both approaches and produce robust and sophisticated vascular fields, but often require complex numerical schemes to solve them. All three modeling approaches have been shown to qualitatively describe the dynamics of tumor angiogenesis; however, many parameters in these models are often assigned values without any experimental validation. This leads to models matching qualitative properties of angiogenesis such as TEC activation, sprout elongation, formation of anastomosis, and establishing blood flow, but have difficulty predicting actual experimental outcomes, since parameters are freely assigned. Recent advances, though, indicate that time-resolved quantitative imaging can provide the data necessary to inform and calibrate model parameters specific to the vasculature network under investigation.
3.2. Integrating Theory and Experimental Data at the Cellular Scale
Microfluidic devices are one promising platform that enable the culturing of tumor and/or endothelial cells in 2D or 3D, while simultaneously incorporating biochemical gradients, fluid flow, and mechanical signaling [108,109][69][70]. These devices can play a powerful role in the study of tumor angiogenesis and vasculature by providing a controlled, repeatable experimental platform in vitro that can isolate specific processes that are not easily studied individually in vivo. Many microfluidic devices are widely reproducible and allow for a systematic investigation of vasculogenesis [110,111,112[71][72][73][74],113], angiogenesis [114[75][76][77][78],115,116,117], and response to anti-angiogenic therapies [118][79].
While computational advances in discrete, continuum, and hybrid modeling along with experimental advances in microscopy and microfluidic devices have largely bridged this gap, significant progress in the rigorous integration of mathematical models of angiogenesis and experimental observations have yet to be realized at the cell scale. Phillips et al. [18,79,100][17][21][80] have proposed integrating confocal microscopy data from an in vitro vascularized tumor platform [117][78] with an agent-based mathematical model of tumor angiogenesis [100][80]. In their framework, time-resolved confocal measurements of individual angiogenic sprouts are used to calibrate and validate a multiscale agent-based model. The agent-based model captures the dynamics of endothelial cells. Each agent represents a single endothelial cell that can be in one of the following phenotypes: tip, stalk, or phalanx cell [107][81]. Tumor cells release TAF, which is modeled by a reaction-diffusion equation and is responsible for guiding the movement and phenotypic transitions of endothelial cells. In their preliminary study [79][21], they calibrated the endothelial cell cycle duration and TEC velocity and used these parameters to estimate the total sprout length at the end of the imaging experiment. Phillips et al. [79][21] observed a 12.5% error in sprout length between the model and the image measurement. Future efforts are aimed at improving the spatial agreement between the model and the measurements. TableTable 2 2 summarizes the literature reviewed in this section and how the selected models are integrated with imaging data.
| Paper | Modeling Approach | Scale | Use of Data |
|---|
| Perfahl 2011 [76] | Perfahl 2011 [18] | Discrete | Cell-tissue | Microscopy used to initialize vasculature network |
| Xu 2020 [81] | Xu 2020 [23] | Hybrid | Cell-tissue | Photoacoustic imaging was used to initialize vasculature network |
| Stepanova 2021 [77] | Stepanova 2021 [19] | Hybrid | Cell | Agent-based model was calibrated against in vitro assays |
| Phillips 2019,2020 [18,79,100] | Phillips 2019,2020 [17][21][80] | Discrete | Cell | Time-resolved microscopy was used to initialize and calibrate an agent-based model |
4. Approaches for Modeling Tumor Vasculature and Angiogenesis at the Tissue Scale
4.1. Mathematical Modeling of Tumor Vasculature and Angiogenesis at the Tissue Scale
4.1.1. Models of Evolving Tumor Vascular Network
The first area Figure 4 of focus (panel a in Figure 4Figure 3) bridges the cell to tissue scale by modeling the formation and evolution of tumor-induced angiogenic networks which are predominately modeled using a discrete (lattice-based and lattice-free). Discrete approaches typically model individual TEC movement, while continuous approaches model the change in a spatially averaged, continuous variable (e.g., vasculature density or vascular volume fraction). Hybrid approaches combine the discrete and continuous approaches to provide a spatially resolved vasculature network, which can be mapped to a continuous domain to facilitate interaction with continuous elements of their mathematical modeling system (e.g., TAF or nutrients). One representative example by Frieboes et al. [87][67] applies a hybrid approach to describe angiogenesis coupled to tumor growth.
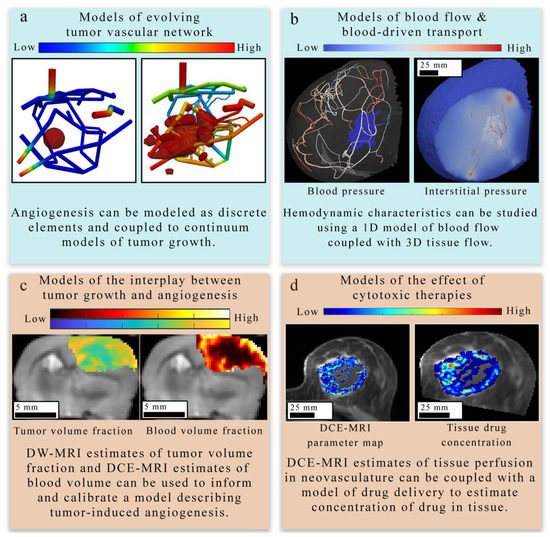
4.1.2. Models of Blood Flow and Blood-Driven Transport
The second area (panel b in Figure 4) focuses on estimating blood flow and transport within the vasculature and through the interstitial space. In discrete vascular models both the pre-existing and the angiogenic vasculature are frequently approximated by a 1D network of connected straight cylinders with the flow in each cylinder simulated using the 1D Poiseuille law [33,87,88,122,123,126,130,131,132][30][67][68][82][83][84][85][86][87]. In continuous vascular flow models the vasculature is described with a spatially averaged, continuous variable (e.g., vasculature density or vascular volume fraction), and the transport of the substance of interest (e.g., drug or nutrient) through the interstitial space is described with a reaction-diffusion-advection model [128,129,133,134][88][89][90][91] describing the delivery, diffusion, and the transport of that substance due to bulk fluid flow. Hybrid vascular flow models [127,135,136][92][93][94] combine the discrete and continuum approaches; capillaries and smaller vessels are approximated with a continuum approach, whereas the large vessels are explicitly retained, and their flow is simulated as in discrete models.
4.1.3. Models of Tumor and Vasculature Growth and Response to Therapy
The third and fourth areas focus on describing the mechanisms underlying the complex interplay between tumor growth and vasculature in the absence of treatment (panel c in Figure 4) [32,81,87,88,121,123,128,129][29][23][67][68][95][83][88][89] and during treatment (panel d in Figure 4).
At the tissue scale, models of tumor cell dynamics are typically captured in a continuous fashion by means of a PDE system [20,137,138,139][96][97][98][99]. This is most commonly achieved through either reaction-diffusion-advection equations or phase-field equations. Reaction-diffusion-advection equations describe the spatiotemporal dynamics of cell density (or tumor volume fraction) as a combination of random movement of cells via diffusion, directed movement of cells via advection, and reaction terms representing (for example) tumor cell proliferation, apoptosis, and cytotoxic effects due to treatments [32,86,127,128,129,134,138][29][32][92][88][89][91][98].
4.2. Integrating Theory and Experimental Data at the Tissue Scale
| Paper | Modeling Approach | Scale | Use of Data |
|---|
| d’Esposito 2018 [80] | d’Esposito 2018 [22] | Continuum | Tissue | Whole tumor imaging was used to initialize vasculature network, perfusion model validated against DCE-MRI |
| Stamatelos 2019 [48] | Stamatelos 2019 [26] | Continuum | Tissue | Whole tumor microscopy was used to initialize tumor vasculature |
| Adhikarla 2012, 2016 [83,84] | Adhikarla 2012, 2016 [27][28] | Discrete | Tissue | CT data was used to initialize vasculature network, model parameters were calibrated against PET measures of hypoxia |
| Wu 2020 [33] | Wu 2020 [30] | Continuum | Tissue | DCE-MRI used to initialize breast vasculature |
| Titz 2012 [143] | Titz 2012 [100] | Continuum | Cell-Tissue | PET estimates of oxygenation and proliferation were used to initialize tumor simulation and calibrate model parameters |
| Hormuth 2019,2020 [32,85] | Hormuth 2019,2020 [29][31] | Continuum | Tissue | Time-resolved DCE-MRI to calibrate and validate models |
| Jarrett 2018, 2020 [28,86] | Jarrett 2018, 2020 [16][32] | Continuum | Tissue | Time-resolved DCE-MRI used to estimate drug delivery |
4.2.1. Applications to Estimate Perfusion and Delivery
Recent studies have provided important foundations on integrating imaging measurements of tumor-associated vasculature with mathematical models, which can provide a means to rigorously understand and predict tumor blood flow, interstitial transport, and angiogenesis. For example, d’Esposito et al. [80][22] performed fluorescence imaging to visualize tumor microvasculature in fixed tumor samples to inform a model of tumor perfusion. The segmented microvasculature was used to initialize the vasculature network for a computational fluid dynamic (CFD) model describing steady-state blood and interstitial flow. Using the CFD model, the authors estimated interstitial fluid pressure and velocity, blood flow and pressure, and the delivery of a widely used MRI contrast agent. Their CFD model predicted a heterogeneous spatial distribution of the contrast agent, which was validated against in vivo DCE-MRI.
4.2.2. Applications to Treatment Response
The treatment efficacy of systemic therapies administered intravenously relies on the delivery of drugs through the bloodstream, which is highly dependent on the vascular structure and associated perfusion. Additionally, multiple pre-clinical and clinical studies have shown that anti-VEGF therapy changes tumor vasculature towards a more “mature” or “normal” phenotype, thereby improving the delivery and efficacy of concomitant chemotherapies [142][101]. Therefore, the use of data-driven modeling to evaluate angiogenesis is a promising means to assess and predict tumor response to therapies. The approach proposed by Titz et al. [143][100] employed a continuum model to simulate tumor and vasculature responses to anti-angiogenic therapy. Pre-treatment PET measurements of cellular proliferation and hypoxia were used to initialize the simulation and estimate model parameters. In their simulations, hypoxic tumors released TAF or VEGF to stimulate endothelial cell proliferation and an increase in microvessel density. The estimated microvessel density was used to estimate the average voxel oxygenation. The model parameters describing cellular and vascular proliferation were adjusted to minimize the error between the measured oxygenation from PET and the model-estimated oxygenation. Using this modeling framework, the authors estimated the response to anti-angiogenic therapy and demonstrated that anti-angiogenic therapy could be personalized based on the initial levels of VEGF within the tumor.
5. Conclusions
References
- Folkman, J.; Bach, M.; Rowe, J.W.; Davidoff, F.; Lambert, P.; Hirsch, C.; Goldberg, A.; Hiatt, H.H.; Glass, J.; Henshaw, E. Tumor Angiogenesis—Therapeutic Implications. N. Engl. J. Med. 1971, 285, 1182–1186.
- Folkman, J. Tumor Angiogenesis; Klein, G., Weinhouse, S., Haddow, A.B.T.-A., Eds.; Academic Press: Cambridge, MA, USA, 1974; Volume 19, pp. 331–358. ISBN 0065230X.
- Carmeliet, P. Angiogenesis in health and disease. Nat. Med. 2003, 9, 653–660.
- Jain, R.K.; di Tomaso, E.; Duda, D.G.; Loeffler, J.S.; Sorensen, A.G.; Batchelor, T.T. Angiogenesis in brain tumours. Nat. Rev. Neurosci. 2007, 8, 610–622.
- Folkman, J. Angiogenesis in cancer, vascular, rheumatoid and other disease. Nat. Med. 1995, 1, 27–30.
- Plate, K.H.; Breier, G.; Weich, H.A.; Risau, W. Vascular endothelial growth factor is a potential tumour angiogenesis factor in human gliomas in vivo. Nature 1992, 359, 845–848.
- Carmeliet, P. Angiogenesis in life, disease and medicine. Nature 2005, 438, 932–936.
- Gillies, R.J.; Schornack, P.A.; Secomb, T.W.; Raghunand, N. Causes and effects of heterogeneous perfusion in tumors. Neoplasia 1999, 1, 197–207.
- Hormuth, D.A.; Jarrett, A.M.; Lorenzo, G.; Ernesto, A.B.F.; Wu, C.; Chung, C.; Patt, D.; Yankeelov, T.E.; Hormuth, D.A.; Jarrett, A.M.; et al. Math, magnets, and medicine: Enabling personalized oncology. Expert Rev. Precis. Med. Drug Dev. 2021, 6, 79–81.
- Chaplain, M.A.J.; McDougall, S.R.; Anderson, A.R.A. Mathematical modeling of tumor-induced angiogenesis. Annu. Rev. Biomed. Eng. 2006, 8, 233–257.
- Anderson, A.R.A.; Chaplain, M.A.J. Continuous and discrete mathematical models of tumor-induced angiogenesis. Bull. Math. Biol. 1998, 60, 857–899.
- Yankeelov, T.E.; An, G.; Saut, O.; Luebeck, E.G.; Popel, A.S.; Ribba, B.; Vicini, P.; Zhou, X.; Weis, J.A.; Ye, K.; et al. Multi-scale Modeling in Clinical Oncology: Opportunities and Barriers to Success. Ann. Biomed. Eng. 2016, 44, 2626–2641.
- Jarrett, A.M.; Lima, E.A.B.F.; Hormuth, D.A.; McKenna, M.T.; Feng, X.; Ekrut, D.A.; Resende, A.C.M.; Brock, A.; Yankeelov, T.E. Mathematical models of tumor cell proliferation: A review of the literature. Expert Rev. Anticancer Ther. 2018, 18, 1271–1286.
- Sun, X.; Zhang, L.; Tan, H.; Bao, J.; Strouthos, C.; Zhou, X. Multi-scale agent-based brain cancer modeling and prediction of TKI treatment response: Incorporating EGFR signaling pathway and angiogenesis. BMC Bioinform. 2012, 13, 218.
- Olsen, M.M.; Siegelmann, H.T. Multiscale agent-based model of tumor angiogenesis. Procedia Comput. Sci. 2013, 18, 1016–1025.
- Jarrett, A.M.; Hormuth, D.A.; Wu, C.; Syed, A.K.; Virostko, J.; Sorace, A.; DiCarlo, J.C.; Kowalski, J.; Patt, D.; Goodgame, B.; et al. Evaluating patient-specific neoadjuvant regimens for breast cancer via a mathematical model constrained by quantitative magnetic resonance imaging data. Neoplasia 2020, 22, 820–830.
- Kazerouni, A.S.; Gadde, M.; Gardner, A.; Hormuth, D.A.; Jarrett, A.M.; Johnson, K.E.; Lima, E.A.B.F.; Lorenzo, G.; Phillips, C.; Brock, A.; et al. Integrating quantitative assays with biologically-based mathematical modeling for predictive oncology. iScience 2020, 23, 101807.
- Perfahl, H.; Byrne, H.M.; Chen, T.; Estrella, V.; Alarcón, T.; Lapin, A.; Gatenby, R.A.; Gillies, R.J.; Lloyd, M.C.; Maini, P.K.; et al. Multiscale Modelling of Vascular Tumour Growth in 3D: The Roles of Domain Size and Boundary Conditions. PLoS ONE 2011, 6, e14790.
- Stepanova, D.; Byrne, H.M.; Maini, P.K.; Alarcon, T. A multiscale model of complex endothelial cell dynamics in early angiogenesis. PLoS Comput. Biol. 2021, 17, 1–44.
- Jakobsson, L.; Franco, C.A.; Bentley, K.; Collins, R.T.; Ponsioen, B.; Aspalter, I.M.; Rosewell, I.; Busse, M.; Thurston, G.; Medvinsky, A.; et al. Endothelial cells dynamically compete for the tip cell position during angiogenic sprouting. Nat. Cell Biol. 2010, 12, 943–953.
- Gadde, M.; Lima, E.A.B.F.; Phillips, C.M.; Rylander, M.N.; Yankeelov, T.E. A multi-scale model of tumor growth and angiogenesis calibrated by data from a tissue-mimicking, 3D, microfluidic platform. In Proceedings of the Cancer Research UK-AACR Joint Conference on Engineering and Physical Sciences in Oncology, London, England, 15–17 October 2019.
- D’Esposito, A.; Sweeney, P.W.; Ali, M.; Saleh, M.; Ramasawmy, R.; Roberts, T.A.; Agliardi, G.; Desjardins, A.; Lythgoe, M.F.; Pedley, R.B.; et al. Computational fluid dynamics with imaging of cleared tissue and of in vivo perfusion predicts drug uptake and treatment responses in tumours. Nat. Biomed. Eng. 2018, 2, 773–787.
- Xu, J.; Vilanova, G.; Gomez, H. Phase-field model of vascular tumor growth: Three-dimensional geometry of the vascular network and integration with imaging data. Comput. Methods Appl. Mech. Eng. 2020, 359, 112648.
- Vilanova, G.; Burés, M.; Colominas, I.; Gomez, H. Computational modelling suggests complex interactions between interstitial flow and tumour angiogenesis. J. R. Soc. Interface 2018, 15, 20180415.
- Stamatelos, S.K.; Kim, E.; Pathak, A.P.; Popel, A.S. A bioimage informatics based reconstruction of breast tumor microvasculature with computational blood flow predictions. Microvasc. Res. 2014, 91, 8–21.
- Stamatelos, S.K.; Bhargava, A.; Kim, E.; Popel, A.S.; Pathak, A.P. Tumor Ensemble-Based Modeling and Visualization of Emergent Angiogenic Heterogeneity in Breast Cancer. Sci. Rep. 2019, 9, 5276.
- Vikram, A.; Robert, J. An imaging-based stochastic model for simulation of tumour vasculature. Phys. Med. Biol. 2012, 57, 6103.
- Adhikarla, V.; Jeraj, R. An imaging-based computational model for simulating angiogenesis and tumour oxygenation dynamics. Phys. Med. Biol. 2016, 61, 3885–3902.
- Hormuth, D.A.; Jarrett, A.M.; Feng, X.; Yankeelov, T.E. Calibrating a Predictive Model of Tumor Growth and Angiogenesis with Quantitative MRI. Ann. Biomed. Eng. 2019, 47, 1539–1551.
- Wu, C.; Hormuth, D.A.; Oliver, T.A.; Pineda, F.; Lorenzo, G.; Karczmar, G.S.; Moser, R.D.; Yankeelov, T.E. Patient-Specific Characterization of Breast Cancer Hemodynamics Using Image-Guided Computational Fluid Dynamics. IEEE Trans. Med. Imaging 2020, 39, 2760–2771.
- Hormuth, D.A.; Jarrett, A.M.; Yankeelov, T.E. Forecasting tumor and vasculature response dynamics to radiation therapy via image based mathematical modeling. Radiat. Oncol. 2020, 15, 4.
- Jarrett, A.; Hormuth, D., II; Barnes, S.; Feng, X.; Huang, W.; Yankeelov, T. Incorporating drug delivery into an imaging-driven, mechanics-coupled reaction diffusion model for predicting the response of breast cancer to neoadjuvant chemotherapy: Theory and preliminary clinical results. Phys. Med. Biol. 2018, 63, 105015.
- Gurcan, M.N.; Boucheron, L.E.; Can, A.; Madabhushi, A.; Rajpoot, N.M.; Yener, B. Histopathological Image Analysis: A Review. IEEE Rev. Biomed. Eng. 2009, 2, 147–171.
- Heindl, A.; Nawaz, S.; Yuan, Y. Mapping spatial heterogeneity in the tumor microenvironment: A new era for digital pathology. Lab. Investig. 2015, 95, 377–384.
- Saucedo, A.M.; De La Cerda, J.; Suami, H.; Serda, R.E. Multimodal imaging of the tumor microenvironment and biological responses to immune therapy. Biomed. Microdevices 2018, 20, 105.
- Wu, N.Z.; Klitzman, B.; Rosner, G.; Needham, D.; Dewhirst, M.W. Measurement of material extravasation in microvascular networks using fluorescence video-microscopy. Microvasc. Res. 1993, 46, 231–253.
- Hori, K.; Saito, S.; Tamai, M. Effect of irradiation on neovascularization in rat skinfold chambers: Implications for clinical trials of low-dose radiotherapy for wet-type age-related macular degeneration. Int. J. Radiat. Oncol. Biol. Phys. 2004, 60, 1564–1571.
- Dewhirst, M.W.; Ong, E.T.; Braun, R.D.; Smith, B.; Klitzman, B.; Evans, S.M.; Wilson, D. Quantification of longitudinal tissue pO2 gradients in window chamber tumours: Impact on tumour hypoxia. Br. J. Cancer 1999, 79, 1717–1722.
- Dewhirst, M.W.; Ong, E.T.; Klitzman, B.; Secomb, T.W.; Vinuya, R.Z.; Dodge, R.; Brizel, D.; Gross, J.F. Perivascular oxygen tensions in a transplantable mammary tumor growing in a dorsal flap window chamber. Radiat. Res. 1992, 130, 171.
- Koehl, G.E.; Gaumann, A.; Geissler, E.K. Intravital microscopy of tumor angiogenesis and regression in the dorsal skin fold chamber: Mechanistic insights and preclinical testing of therapeutic strategies. Clin. Exp. Metastasis 2009, 26, 329–344.
- Tozer, G.M.; Ameer-Beg, S.M.; Baker, J.; Barber, P.R.; Hill, S.A.; Hodgkiss, R.J.; Locke, R.; Prise, V.E.; Wilson, I.; Vojnovic, B. Intravital imaging of tumour vascular networks using multi-photon fluorescence microscopy. Adv. Drug Deliv. Rev. 2005, 57, 135–152.
- Brown, E.; Brunker, J.; Bohndiek, S.E. Photoacoustic imaging as a tool to probe the tumour microenvironment. DMM Dis. Model. Mech. 2019, 12, dmm039636.
- Jathoul, A.P.; Laufer, J.; Ogunlade, O.; Treeby, B.; Cox, B.; Zhang, E.; Johnson, P.; Pizzey, A.R.; Philip, B.; Marafioti, T.; et al. Deep in vivo photoacoustic imaging of mammalian tissues using a tyrosinase-based genetic reporter. Nat. Photonics 2015, 9, 239–246.
- Fox, S.B.; Harris, A.L. Histological quantitation of tumour angiogenesis. APMIS 2004, 112, 413–430.
- Ehling, J.; Theek, B.; Gremse, F.; Baetke, S.; Möckel, D.; Maynard, J.; Ricketts, S.A.; Grüll, H.; Neeman, M.; Knuechel, R.; et al. Micro-CT imaging of tumor angiogenesis: Quantitative measures describing micromorphology and vascularization. Am. J. Pathol. 2014, 184, 431–441.
- McDonald, D.M.; Choyke, P.L. Imaging of angiogenesis: From microscope to clinic. Nat. Med. 2003, 9, 713–725.
- Iwazawa, J.; Ohue, S.; Mitani, T.; Abe, H.; Hashimoto, N.; Hamuro, M.; Nakamura, K. Identifying feeding arteries during TACE of hepatic tumors: Comparison of C-Arm CT and digital subtraction angiography. Am. J. Roentgenol. 2009, 192, 1057–1063.
- Drescher, R.; Freesmeyer, M. PET angiography: Application of early dynamic PET/CT to the evaluation of arteries. Am. J. Roentgenol. 2013, 201, 908–911.
- Cuenod, C.A.; Fournier, L.; Balvay, D.; Guinebretière, J.M. Tumor angiogenesis: Pathophysiology and implications for contrast-enhanced MRI and CT assessment. Abdom. Imaging 2006, 31, 188–193.
- Soriano, A.; Castells, A.; Ayuso, C.; Ayuso, J.R.; De Caralt, M.T.; Ginès, M.À.; Real, M.I.; Gilabert, R.; Quintó, L.; Trilla, A.; et al. Preoperative Staging and Tumor Resectability Assessment of Pancreatic Cancer: Prospective Study Comparing Endoscopic Ultrasonography, Helical Computed Tomography, Magnetic Resonance Imaging, and Angiography. Am. J. Gastroenterol. 2004, 99, 492–501.
- Mullani, N.A.; Herbst, R.S.; O’Neil, R.G.; Gould, K.L.; Barron, B.J.; Abbruzzese, J.L. Tumor blood flow measured by PET dynamic imaging of first-pass 18F-FDG uptake: A comparison with 15O-labeled water-measured blood flow. J. Nucl. Med. 2008, 49, 517–523.
- Massaro, A.; Ferretti, A.; Secchiero, C.; Cittadin, S.; Milan, E.; Tamiso, L.; Pavan, L.; Tommasi, E.; Marzola, M.C.; Chondrogiannis, S.; et al. Optimising 18F-Choline PET/CT acquisition protocol in prostate cancer patients. N. Am. J. Med. Sci. 2012, 4, 416–420.
- Van Vliet, M.; Van Dijke, C.F.; Wielopolski, P.A.; Ten Hagen, T.L.M.; Veenland, J.F.; Preda, A.; Loeve, A.J.; Eggermont, A.M.M.; Krestin, G.P. MR angiography of tumor-related vasculature: From the clinic to the microenvironment. Radiographics 2005, 25, 85–98.
- Brubaker, L.M.; Bullitt, E.; Yin, C.; Van Dyke, T.; Lin, W. Magnetic resonance angiography visualization of abnormal tumor vasculature in genetically engineered mice. Cancer Res. 2005, 65, 8218–8223.
- Bullitt, E.; Zeng, D.; Gerig, G.; Aylward, S.; Joshi, S.; Smith, J.K.; Lin, W.; Ewend, M.G. Vessel tortuosity and brain tumor malignancy: A blinded study. Proc. Acad. Radiol. 2005, 12, 1232–1240.
- Neves, F.; Huwart, L.; Jourdan, G.; Reizine, D.; Herman, P.; Vicaut, E.; Guichard, J.P. Head and neck paragangliomas: Value of contrast-enhanced 3D MR angiography. Proc. Am. J. Neuroradiol. 2008, 29, 883–889.
- Fuss, M.; Wenz, F.; Essig, M.; Muenter, M.; Debus, J.; Herman, T.S.; Wannenmacher, M. Tumor angiogenesis of low-grade astrocytomas measured by dynamic susceptibility contrast-enhanced MRI (DSC-MRI) is predictive of local tumor control after radiation therapy. Int. J. Radiat. Oncol. Biol. Phys. 2001, 51, 478–482.
- Kickingereder, P.; Brugnara, G.; Hansen, M.B.; Nowosielski, M.; Pflüger, I.; Schell, M.; Isensee, F.; Foltyn, M.; Neuberger, U.; Kessler, T.; et al. Noninvasive characterization of tumor angiogenesis and oxygenation in bevacizumab-treated recurrent glioblastoma by using dynamic susceptibility MRI: Secondary analysis of the European Organization for Research and Treatment of Cancer 26101 Trial. Radiology 2020, 297, 164–175.
- Puig, J.; Blasco, G.; Daunis-i-Estadella, J.; Alberich-Bayarri, A.; Essig, M.; Jain, R.; Remollo, S.; Hernández, D.; Puigdemont, M.; Sánchez-González, J.; et al. High-resolution blood-pool-contrast-enhanced MR angiography in glioblastoma: Tumor-associated neovascularization as a biomarker for patient survival. A preliminary study. Neuroradiology 2016, 58, 17–26.
- Cai, W.; Shin, D.W.; Chen, K.; Gheysens, O.; Cao, Q.; Wang, S.X.; Gambhir, S.S.; Chen, X. Peptide-labeled near-infrared quantum dots for imaging tumor vasculature in living subjects. Nano Lett. 2006, 6, 669–676.
- Senarathna, J.; Prasad, A.; Bhargava, A.; Gil, S.; Thakor, N.V.; Pathak, A.P. HemoSYS: A Toolkit for Image-based Systems Biology of Tumor Hemodynamics. Sci. Rep. 2020, 10, 2372.
- Sze, D.Y.; Razavi, M.K.; So, S.K.S.; Jeffrey, J. Impact of multidetector CT hepatic arteriography on the planning of chemoembolization treatment of hepatocellular carcinoma. Am. J. Roentgenol. 2001, 177, 1339–1345.
- Fishman, E.K.; Horton, K.M. Imaging Pancreatic Cancer: The Role of Multidetector CT with Three-Dimensional CT Angiography. Pancreatology 2001, 1, 610–624.
- Horton, K.M.; Fishman, E.K. Volume-rendered 3D CT of the mesenteric vasculature: Normal anatomy, anatomic variants, and pathologic conditions. Radiographics 2002, 22, 161–172.
- Bullitt, E.; Gerig, G.; Pizer, S.M.; Lin, W.; Aylward, S.R. Measuring Tortuosity of the Intracerebral Vasculature from MRA Images. IEEE Trans. Med. Imaging 2003, 22, 1163–1171.
- Mustafi, D.; Leinroth, A.; Fan, X.; Markiewicz, E.; Zamora, M.; Mueller, J.; Conzen, S.D.; Karczmar, G.S. Magnetic resonance angiography shows increased arterial blood supply associated with murine mammary cancer. Int. J. Biomed. Imaging 2019, 2019.
- Frieboes, H.B.; Jin, F.; Chuang, Y.-L.; Wise, S.M.; Lowengrub, J.S.; Cristini, V. Three-dimensional multispecies nonlinear tumor growth-II: Tumor invasion and angiogenesis. J. Theor. Biol. 2010, 264, 1254–1278.
- Vavourakis, V.; Wijeratne, P.A.; Shipley, R.; Loizidou, M.; Stylianopoulos, T.; Hawkes, D.J. A Validated Multiscale In-Silico Model for Mechano-sensitive Tumour Angiogenesis and Growth. PLoS Comput. Biol. 2017, 13, e1005259.
- Meyvantsson, I.; Beebe, D.J. Cell culture models in microfluidic systems. Annu. Rev. Anal. Chem. 2008, 1, 423–449.
- Wang, X.; Sun, Q.; Pei, J. Microfluidic-based 3D engineered microvascular networks and their applications in vascularized microtumor models. Micromachines 2018, 9, 493.
- Hsu, Y.H.; Moya, M.L.; Hughes, C.C.W.; George, S.C.; Lee, A.P. A microfluidic platform for generating large-scale nearly identical human microphysiological vascularized tissue arrays. Lab Chip 2013, 13, 2990–2998.
- Hsu, Y.H.; Moya, M.L.; Abiri, P.; Hughes, C.C.W.; George, S.C.; Lee, A.P. Full range physiological mass transport control in 3D tissue cultures. Lab Chip 2013, 13, 81–89.
- Moya, M.L.; Hsu, Y.H.; Lee, A.P.; Christopher, C.W.H.; George, S.C. In vitro perfused human capillary networks. Tissue Eng. Part C Methods 2013, 19, 730–737.
- Raghavan, S.; Nelson, C.M.; Baranski, J.D.; Lim, E.; Chen, C.S. Geometrically controlled endothelial tubulogenesis in micropatterned gels. Tissue Eng. Part A 2010, 16, 2255–2263.
- Vickerman, V.; Kamm, R.D. Mechanism of a flow-gated angiogenesis switch: Early signaling events at cell-matrix and cell-cell junctions. Integr. Biol. 2012, 4, 863–874.
- Shin, Y.; Jeon, J.S.; Han, S.; Jung, G.S.; Shin, S.; Lee, S.H.; Sudo, R.; Kamm, R.D.; Chung, S. In vitro 3D collective sprouting angiogenesis under orchestrated ANG-1 and VEGF gradients. Lab Chip 2011, 11, 2175–2181.
- Kim, S.; Chung, M.; Ahn, J.; Lee, S.; Jeon, N.L. Interstitial flow regulates the angiogenic response and phenotype of endothelial cells in a 3D culture model. Lab Chip 2016, 16, 4189–4199.
- Gadde, M.; Phillips, C.; Ghousifam, N.; Sorace, A.G.; Wong, E.; Krishnamurthy, S.; Syed, A.; Rahal, O.; Yankeelov, T.E.; Woodward, W.A.; et al. In vitro vascularized tumor platform for modeling tumor-vasculature interactions of inflammatory breast cancer. Biotechnol. Bioeng. 2020, 117, 3572–3590.
- Sobrino, A.; Phan, D.T.T.; Datta, R.; Wang, X.; Hachey, S.J.; Romero-López, M.; Gratton, E.; Lee, A.P.; George, S.C.; Hughes, C.C.W. 3D microtumors in vitro supported by perfused vascular networks. Sci. Rep. 2016, 6, 1–11.
- Phillips, C.M.; Lima, E.A.B.F.; Woodall, R.T.; Brock, A.; Yankeelov, T.E. A hybrid model of tumor growth and angiogenesis: In silico experiments. PLoS ONE 2020, 15, e0231137.
- Lima, E.A.B.F.; Oden, J.T.; Almeida, R.C. A hybrid ten-species phase-field model of tumor growth. Math. Model. Methods Appl. Sci. 2014, 24, 2569–2599.
- Fritz, M.; Jha, P.K.; Köppl, T.; Oden, J.T.; Wohlmuth, B. Analysis of a new multispecies tumor growth model coupling 3D phase-fields with a 1D vascular network. Nonlinear Anal. Real World Appl. 2021, 61, 103331.
- Fritz, M.; Jha, P.K.; Köppl, T.; Tinsley Oden, J.; Wagner, A.; Wohlmuth, B. Modeling and Simulation of Vascular Tumors Embedded in Evolving Capillary Networks. arXiv 2021, arXiv:2101.10183v2.
- Koch, T.; Flemisch, B.; Helmig, R.; Wiest, R.; Obrist, D. A multiscale subvoxel perfusion model to estimate diffusive capillary wall conductivity in multiple sclerosis lesions from perfusion MRI data. Int. J. Numer. Method. Biomed. Eng. 2020.
- D’Angelo, C. Multiscale modelling of metabolism and transport phenomena in living tissues. Lausanne EPFL 2007.
- D’Angelo, C.; Quarteroni, A. On the coupling of 1D and 3D diffusion-reaction equations. Application to tissue perfusion problems. Math. Model. Methods Appl. Sci. 2008, 18, 1481–1504.
- Köppl, T.; Vidotto, E.; Wohlmuth, B. A 3D-1D coupled blood flow and oxygen transport model to generate microvascular networks. Int. J. Numer. Method. Biomed. Eng. 2020, 36, e3386.
- Hinow, P.; Gerlee, P.; McCawley, L.J.; Quaranta, V.; Ciobanu, M.; Wang, S.Z.; Graham, J.M.; Ayati, B.P.; Claridge, J.; Swanson, K.R.; et al. A Spatial Model of Tumor-Host Interaction: Application of Chemotherapy. Math. Biosci. Eng. 2009, 6, 521–546.
- Swanson, K.R.; Rockne, R.C.; Claridge, J.; Chaplain, M.A.; Alvord, E.C.; Anderson, A.R.A. Quantifying the role of angiogenesis in malignant progression of gliomas: In silico modeling integrates imaging and histology. Cancer Res. 2011, 71, 7366–7375.
- Hawkins-Daarud, A.; Rockne, R.C.; Anderson, A.R.A.; Swanson, K.R. Modeling tumor-associated edema in gliomas during anti-angiogenic therapy and its impact on imageable tumor. Front. Oncol. 2013, 3, 66.
- Kohandel, M.; Kardar, M.; Milosevic, M.; Sivaloganathan, S. Dynamics of tumor growth and combination of anti-angiogenic and cytotoxic therapies. Phys. Med. Biol. 2007, 52, 3665–3677.
- Kremheller, J.; Vuong, A.T.; Schrefler, B.A.; Wall, W.A. An approach for vascular tumor growth based on a hybrid embedded/homogenized treatment of the vasculature within a multiphase porous medium model. Int. J. Numer. Method. Biomed. Eng. 2019, 35, e3253.
- Vidotto, E.; Koch, T.; Köppl, T.; Helmig, R.; Wohlmuth, B. Hybrid Models for Simulating Blood Flow in Microvascular Networks. Multiscale Model. Simul. 2019, 17, 1076–1102.
- Shipley, R.J.; Smith, A.F.; Sweeney, P.W.; Pries, A.R.; Secomb, T.W. A hybrid discrete-continuum approach for modelling microcirculatory blood flow. Math. Med. Biol. 2020, 37, 40–57.
- Xu, J.; Vilanova, G.; Gomez, H. Full-scale, three-dimensional simulation of early-stage tumor growth: The onset of malignancy. Comput. Methods Appl. Mech. Eng. 2017, 314, 126–146.
- Yankeelov, T.E.; Atuegwu, N.; Hormuth, D.A.; Weis, J.A.; Barnes, S.L.; Miga, M.I.; Rericha, E.C.; Quaranta, V. Clinically Relevant Modeling of Tumor Growth and Treatment Response. Sci. Transl. Med. 2013, 5, 187ps9.
- Lima, E.A.B.F.; Oden, J.T.; Wohlmuth, B.; Shahmoradi, A.; Hormuth, D.A.; Yankeelov, T.E.; Scarabosio, L.; Horger, T. Selection and validation of predictive models of radiation effects on tumor growth based on noninvasive imaging data. Comput. Methods Appl. Mech. Eng. 2017, 327, 277–305.
- Lorenzo, G.; Hormuth, D.A.; Jarrett, A.M.; Lima, E.A.B.F.; Subramanian, S.; Biros, G.; Oden, J.T.; Hughes, T.J.R.; Yankeelov, T.E. Quantitative in vivo imaging to enable tumor forecasting and treatment optimization. arXiv 2021, arXiv:2102.12602.
- Hahnfeldt, P.; Panigrahy, D.; Folkman, J.; Hlatky, L. Tumor development under angiogenic signaling: A dynamical theory of tumor growth, treatment response, and postvascular dormancy. Cancer Res. 1999, 59, 4770–4775.
- Benjamin, T.; Kevin, R.K.; Robert, J.; Titz, B.; Kozak, K.R.; Jeraj, R. Computational modelling of anti-angiogenic therapies based on multiparametric molecular imaging data. Phys. Med. Biol. 2012, 57, 6079.
- Goel, S.; Duda, D.G.; Xu, L.; Munn, L.L.; Boucher, Y.; Fukumura, D.; Jain, R.K. Normalization of the vasculature for treatment of cancer and other diseases. Physiol. Rev. 2011, 91, 1071–1121.