Given the reproducibility crisis (or replication crisis), more psychologists and social-cultural scientists are getting involved with Bayesian inference. Therefore, the current article provides a brief overview of programs (or software) and steps to conduct Bayesian data analysis in social sciences.
- Bayesian inference
- social sciences
- psychology
- Reproducibility crisis
- bayesvl
1. Introduction
The persistence of ‘stargazing’, p-hacking and HARKing issues has currently led to a severe reproducibility crisis in which 70% of researchers have failed to reproduce other scientists’ experiments, and more than half have failed to replicate their experiments [1][2][3][4]. In psychology, it is also found that over half of the studies cannot be replicated [5][6], whereas only 62% of replicated social science experiments published in prestigious journals, like Nature and Science, show the same direction as the original papers [7].
For easing the problem, many initiatives have been proposed. The Editorial of Nature Human Behaviour releases the option of a registered report for neutralizing the publication bias and improving scientific research validity [2]. Some authors suggest redefining the statistical significance that the p-value threshold is lowered to 0.005 “for claims of new discoveries” [8]. Nevertheless, the proposal faces criticism from Amrhein and Greenland [9] for being overconfident about mathematical results and ignoring unmodeled uncertainties. They argue that considering results’ reliability has to be regardless of statistical significance and based on the combination of “multiple studies and lines of evidence”.
The Bayesian analysis seems to offer a solution to the crisis, given its natural properties, such as treating all quantities (including hypotheses and unknown effects) probabilistically, incorporating prior information into estimation using the current evidence, etc. [10][11][12]. In the last few decades, Bayesian inference was not widely applied in practical research due to its complexity in estimating posterior. Nonetheless, the recent development of Markov chain Monte Carlo (MCMC) algorithms and rapid improvement in computational power have made the Bayesian data analysis more feasible. As a result, more psychologists and social-cultural scientists are getting involved with Bayesian data analysis [13][14][15][16][17][18][19]. vuon
2. Software for Bayesian analysis
Since the first development of WinBUGS software [20], an increasing number of programs and software packages implementing Bayesian analysis has been produced. OpenBUGS [21], JAGS [22], MCMCglmm [23], Stan [24][25], brms [26], rethinking [11], and rstanarm [27] are most common examples. The JAGS program primarily uses the Gibbs sampling for estimating the Bayesian multilevel models, while the WinBUGS, OpenBUGS programs and MCMCglmm package employ the combination of Metropolis-Hastings updates, Gibbs sampling, and even Slice sampling in some cases.
In contrast, Stan, a software written in C++, uses Hamiltonian Monte Carlo (HMC) [28], and its extension, the No-U-Turn Sampler (NUTS) for MCMC simulation [29]. The HMC and NUTS algorithms obtain faster convergence speed than their counterparts, Metropolis-Hasting and Gibbs algorithms, especially for high-dimensional models. As a result, the probabilistic programming language Stan has been integrated into recently developed R packages for Bayesian multilevel analysis using MCMC simulation, like brms, rstanarm, and rethinking.
Although there have been many Bayesian programs or software available, Bayesian inference is still not widely used in social sciences. This might be attributable to three reasons: 1) the fear of mathematical challenges, 2) the fear of computer code writing, and 3) the fear of leaving their comfort zone [4]. More recently, the bayesvl package has been developed for helping social scientists to overcome such fears through 1) replacing mathematical formulas with directed acyclic graphs (DAGs, or “relationship trees”), 2) automatic generation of Stan code, and 3) offering graphical visualization of models, results, and diagnostic tests [30][31].
3. Steps to conduct Bayesian analysis
Normally, Bayesian analysis is conducted following three steps: model building, model fitting, and model interpretation and improvement [32]. To better describe these steps, we only focus on the software or programs using Markov Chain Monte Carlo (MCMC) techniques. Moreover, the exemplary figures are generated using the bayesvl package due to its ability to create eye-catching graphics [33].
The first step is to construct the model based on prior knowledge, experience, or theories. This step also includes the selection of prior probability distribution. For constructing a model, the research outcome needs to be considered, whether for prediction or explanation (Ripley, 2004). The predictive model is usually used for finding the predictors or impacts of a particular phenomenon, for example, finding the predictive factors of vaccination intention [34]. Meanwhile, the primary objective of an explanatory model is to seek the most parsimonious explanation for a given phenomenon or process, for example, explaining the suicidal ideation mechanism or pathways to book-reading interest [14][35].
The second step is model fitting. Just like its name, it is to fit the constructed model using MCMC algorithms. The outcomes are estimated posterior probability distributions and credibility intervals of studied parameters. During this step, the scientists have to determine the technical settings for the Bayesian analysis. The numbers of iterations, warm-up iterations, and Markov chains have to be decided based on the types of data and MCMC techniques integrated into the employed program.
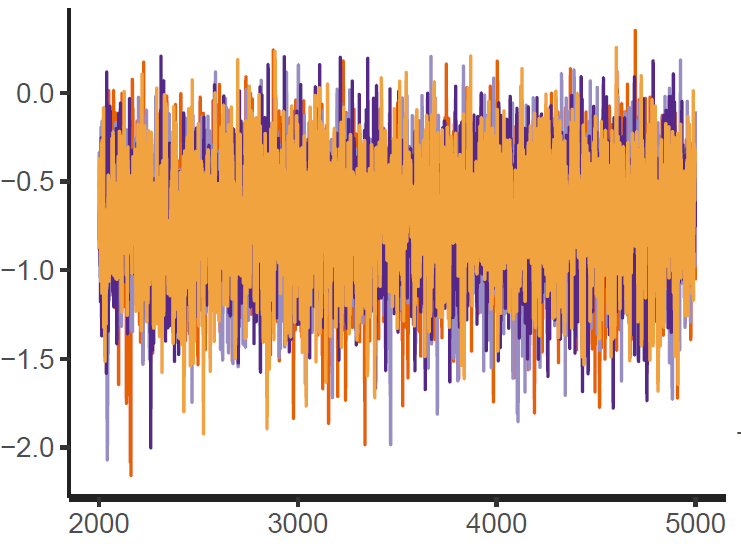
Figure 1: Trace plot
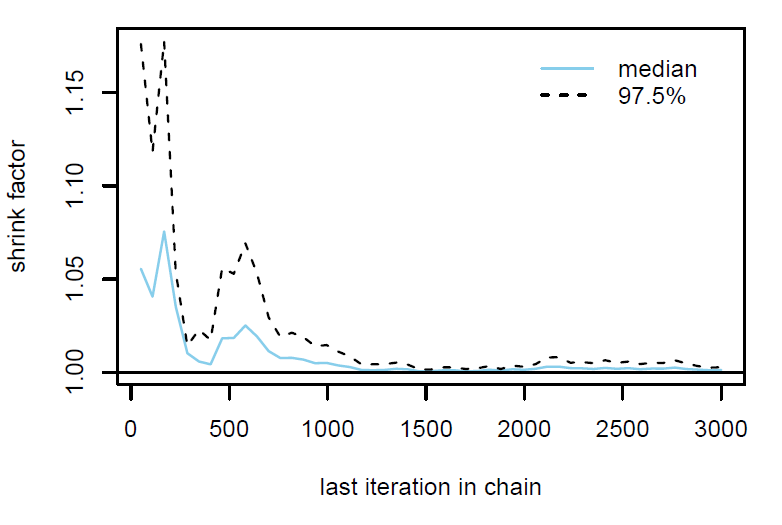 Figure 2: Gelman plot
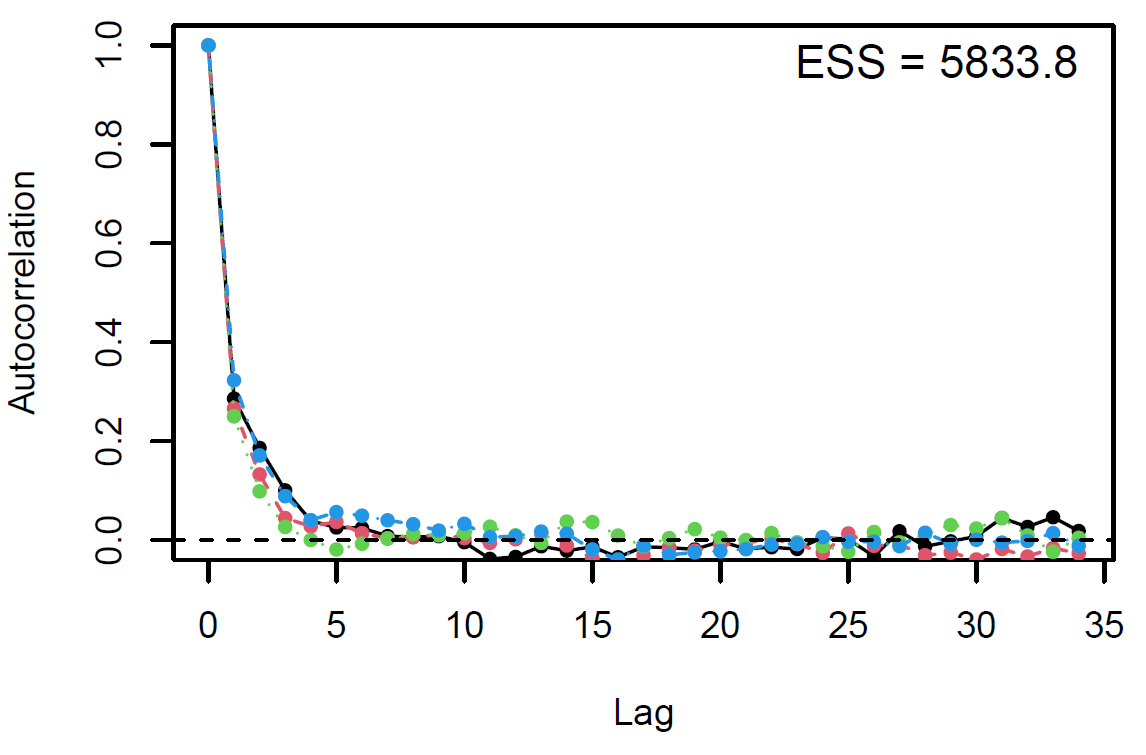 Figure 3: Autocorrelation plot
Finally, the estimated results are interpreted and, if necessary, compared with results simulated by different models for specifying the optimal model. A posterior result can be deemed qualified for interpretation when the Markov chain central limit theorem holds (or the Markov chains converge). Two primary diagnostic statistics have to be interpreted: the effective sample size (n_eff) and the Gelman shrink factor (Rhat). For Markov chains of a model to be considered convergent, the posterior parameters’ n_eff values should be higher than 1,000, and Rhat values are equal to 1. Notably, the n_eff value’s threshold can vary according to programs and software used. Visually, the Markov chain central limit theorem can be diagnosed using the trace plot (see Figure 1), Gelman plot (see Figure 2), and autocorrelation plot (see Figure 3). The simulated posterior results can be interpreted using probability distribution plots, like the interval plot (see Figure 4), the density plot (see Figure 5), the pairwise density plot (see Figure 6), etc.
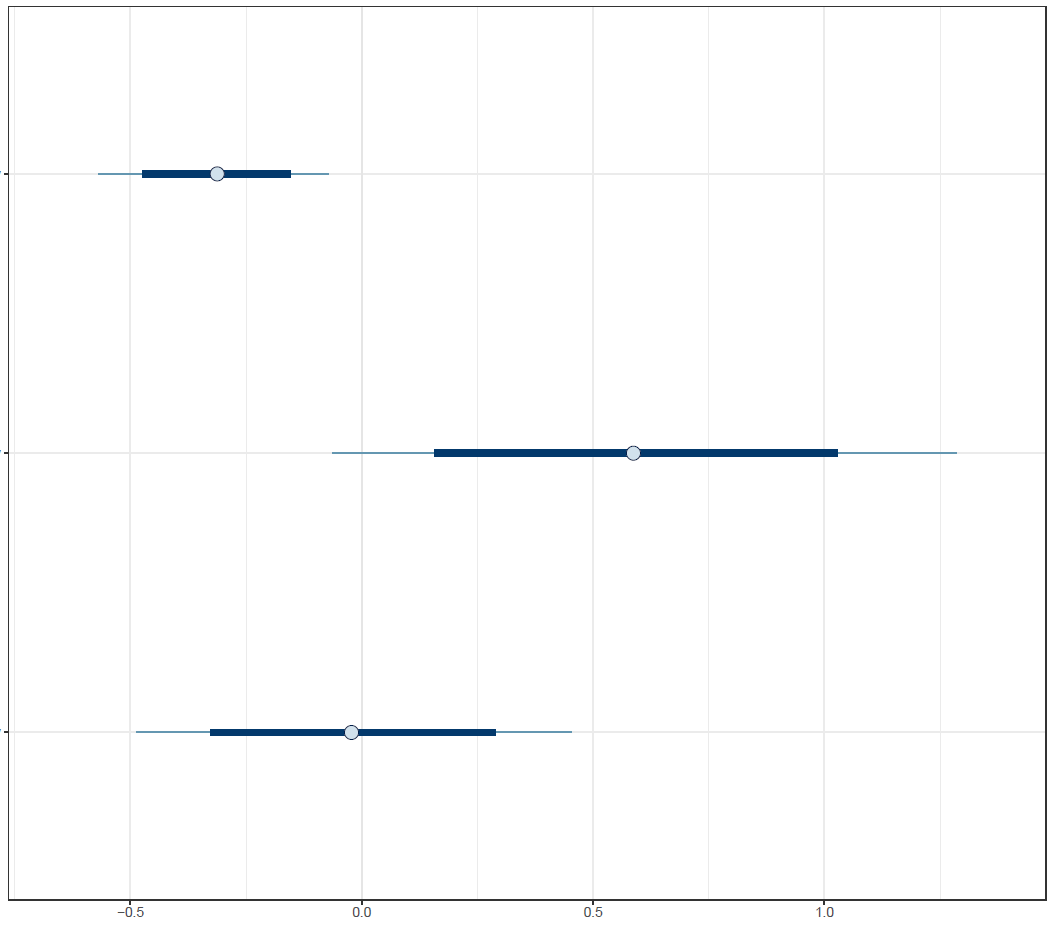 Figure 4: Interval plot
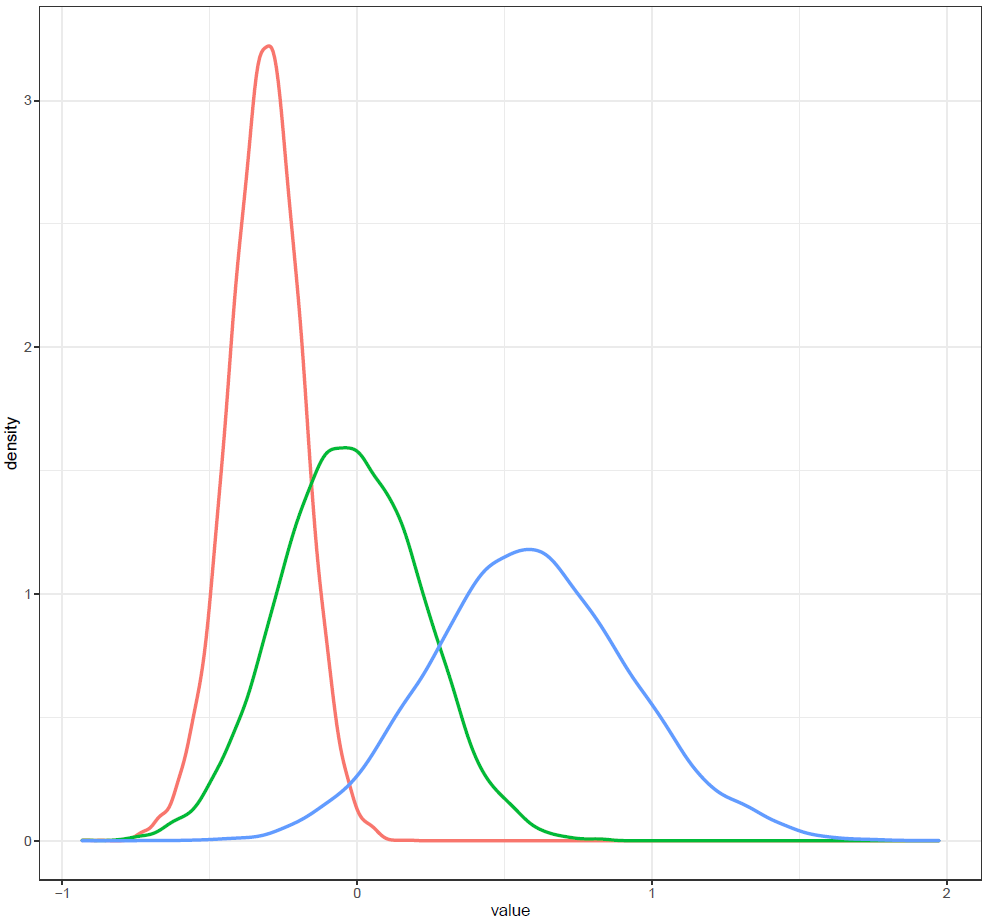 Figure 5: Density plot
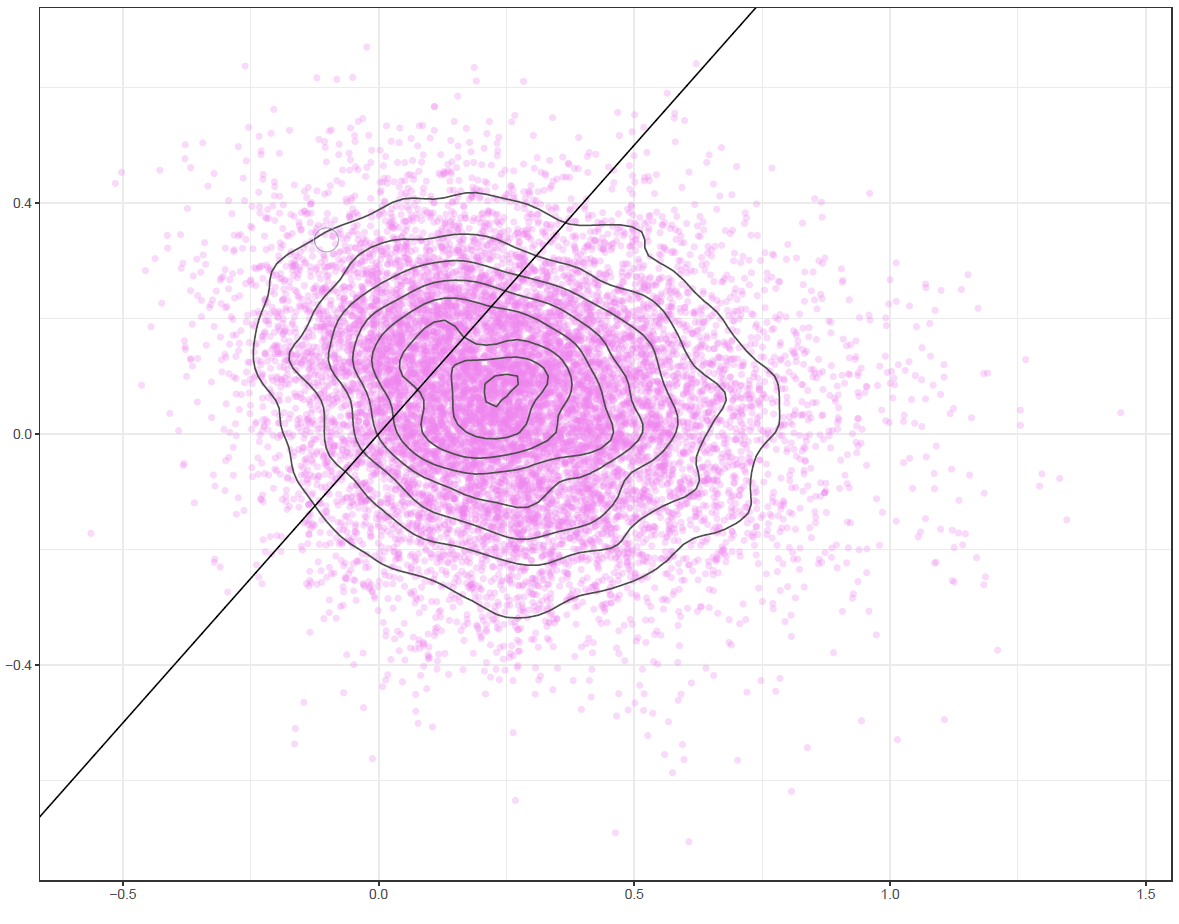 Figure 6: Pairwise density plot
The loo package – performing approximate leave-one-out cross-validation for Bayesian models fit using MCMC – offers an alternative to compare the predictive accuracy on new data among models (or models’ goodness-of-fit) [36].
References
- Baker M. (2016). 1,500 scientists lift the lid on reproducibility. Nature News, 533(7604), 452-454. https://doi.org/10.1038/533452a
- Editorial. (2017). Promoting reproducibility with registered reports. Nature Human Behaviour, 1(1), 0034. https://doi.org/10.1038/s41562-016-0034
- Kerr NL. (1998). HARKing: Hypothesizing after the results are known. Personality Social Psychology Review, 2(3), 196-217. https://doi.org/10.1207/s15327957pspr0203_4
- Vuong QH, Ho MT, La VP. (2019). ‘Stargazing’ and p-hacking behaviours in social sciences: some insights from a developing country. European Science Editing, 45(2), 54-55. http://europeanscienceediting.org.uk/articles/stargazing-and-p-hacking-behaviours-in-social-sciences-some-insights-from-a-developing-country/
- Baker M. (2015). Over half of psychology studies fail reproducibility test. Nature. https://doi.org/10.1038/nature.2015.18248
- Open Science Collaboration. (2015). Estimating the reproducibility of psychological science. science, 349(6251), aac4716. https://doi.org/10.1126/science.aac4716
- Camerer CF, Dreber A, Holzmeister F, Ho TH, Huber J, Johannesson M, . . . Pfeiffer T. (2018). Evaluating the replicability of social science experiments in Nature and Science between 2010 and 2015. Nature Human Behaviour, 2(9), 637-644. https://doi.org/10.1038/s41562-018-0399-z
- Benjamin DJ, Berger JO, Johannesson M, Nosek BA, Wagenmakers EJ, Berk R, . . . Johnson VE. (2018). Redefine statistical significance. Nature Human Behaviour, 2(1), 6-10. https://doi.org/10.1038/s41562-017-0189-z
- Amrhein V, Greenland S. (2018). Remove, rather than redefine, statistical significance. Nature Human Behaviour, 2, 4. https://doi.org/10.1038/s41562-017-0224-0
- Gill J. (2014). Bayesian methods: A social and behavioral sciences approach (Vol. 20). Boca Raton, Fla: Chapman & Hall/CRC.
- McElreath R. (2020). Statistical rethinking: A Bayesian course with examples in R and Stan. Boca Raton: CRC Press.
- Wagenmakers EJ, Marsman M, Jamil T, Ly A, Verhagen J, Love J, . . . Epskamp S. (2018). Bayesian inference for psychology. Part I: Theoretical advantages and practical ramifications. Psychonomic Bulletin Review, 25(1), 35-57. https://doi.org/10.3758/s13423-017-1343-3
- Liang JH, Li J, Wu RK, Li JY, Qian S, Jia RX, . . . Xu Y. (2021). Effectiveness comparisons of various psychosocial therapies for children and adolescents with depression: a Bayesian network meta-analysis. European Child and Adolescent Psychiatry, 30(5), 685-697. https://doi.org/10.1007/s00787-020-01492-w
- Nguyen MH, Le TT, Nguyen HKT, Ho MT, Nguyen HTT, Vuong QH. (2021). Alice in Suicideland: Exploring the suicidal ideation mechanism through the sense of connectedness and help-seeking behaviors. International Journal of Environmental Research and Public Health, 18(7), 3681. https://doi.org/10.3390/ijerph18073681
- Deng L, Sun X, Qiu S, Xiong Y, Li Y, Wang L, . . . Liu M. (2017). Interventions for management of post-stroke depression: A Bayesian network meta-analysis of 23 randomized controlled trials. Scientific Reports, 7(1), 1-12. https://doi.org/10.1038/s41598-017-16663-0
- Crema E, Edinborough K, Kerig T, Shennan S. (2014). An Approximate Bayesian Computation approach for inferring patterns of cultural evolutionary change. Journal of Archaeological Science, 50, 160-170. https://doi.org/10.1016/j.jas.2014.07.014
- Dediu D. (2009). Genetic biasing through cultural transmission: Do simple Bayesian models of language evolution generalise? Journal of Theoretical Biology, 259(3), 552-561. https://doi.org/10.1016/j.jtbi.2009.04.004
- Vuong QH, Bui QK, La VP, Vuong TT, Nguyen VH, Ho MT, Nguyen THK, Ho MT. (2018). Cultural additivity: Behavioural insights from the interaction of Confucianism, Buddhism, and Taoism in folktales. Palgrave Communications, 4,143. https://doi.org/10.1057/s41599-018-0189-2
- Vuong QH, Ho MT, Nguyen HKT, Vuong TT, Tran T, Hoang KL, . . . La VP. (2020). On how religions could accidentally incite lies and violence: folktales as a cultural transmitter. Palgrave Communications, 6(1), 82. https://doi.org/10.1057/s41599-020-0442-3
- Lunn DJ, Thomas A, Best N, Spiegelhalter DJS. (2000). WinBUGS-a Bayesian modelling framework: concepts, structure, and extensibility. Statistics and Computing, 10(4), 325-337. https://doi.org/10.1023/A:1008929526011
- Spiegelhalter D, Thomas A, Best N, Lunn D. (2007). OpenBUGS user manual. Cambridge: MRC Biostatistics Unit
- Plummer M. (2013). JAGS: Just another Gibbs sampler. Retrieved from: https://mcmc-jags.sourceforge.io/
- Hadfield JD. (2010). MCMC methods for multi-response generalized linear mixed models: the MCMCglmm R package. Journal of Statistical Software, 33(1), 1-22. https://doi.org/10.18637/jss.v033.i02
- Carpenter B, Gelman A, Hoffman MD, Lee D, Goodrich B, Betancourt M, . . . Riddell A. (2017). Stan: A probabilistic programming language. Journal of Statistical Software, 76(1), 1-32. https://doi.org/10.18637/jss.v076.i01
- Stan Development Team. (2020). RStan: the R interface to Stan. (Version R package version 2.19.3). Retrieved from http://mc-stan.org/
- Bürkner PC. (2017). brms: An R package for Bayesian multilevel models using Stan. Journal of Statistical Software, 80(1), 1-28. https://doi.org/10.18637/jss.v080.i01
- Muth C, Oravecz Z, Gabry J. (2018). User-friendly Bayesian regression modeling: A tutorial with rstanarm and shinystan. Quantitative Methods for Psychology, 14(2), 99-119. http://dx.doi.org/10.20982/tqmp.14.2.p099
- Duane S, Kennedy AD, Pendleton BJ, Roweth D. (1987). Hybrid monte carlo. Physics Letters B, 195(2), 216-222. https://doi.org/10.1016/0370-2693(87)91197-X
- Hoffman MD, Gelman A. (2014). The No-U-Turn sampler: adaptively setting path lengths in Hamiltonian Monte Carlo. Journal of Machine Learning Research, 15(1), 1593-1623. https://dl.acm.org/doi/10.5555/2627435.2638586
- Vuong QH, La VP, Nguyen MH, Ho MT, Tran T, Ho MT. (2020). Bayesian analysis for social data: A step-by-step protocol and interpretation. MethodsX, 7, 100924. https://doi.org/10.1016/j.mex.2020.100924
- Hoàng VQ, Phương LV, Trung T, Hoàng NM, Toàn HM. (2021). Bản hòa tấu dữ liệu xã hội. Nxb Khoa học Xã hội, Hà Nội. ISBN: 978-604-308-549-5. Retrieved from: https://books.google.com/books/?id=eBU5EAAAQBAJ
- Csilléry K, Blum MG, Gaggiotti QE, François O. (2010). Approximate Bayesian computation (ABC) in practice. Trends in Ecology and Evolution, 25(7), 410-418. https://doi.org/10.1016/j.tree.2010.04.001
- Vuong QH, La VP, Nguyen MH, Ho MT, Ho MT, Mantello P. (2020). Improving Bayesian statistics understanding in the age of Big Data with the bayesvl R package. Software Impacts, 4, 100016. https://doi.org/10.1016/j.simpa.2020.100016
- Khuc QV, Nguyen T, Nguyen T, Pham L, Le DT, Ho HH, . . . Tran QK. (2021). Young adults’ intentions and rationales for COVID-19 vaccination participation: Evidence from a student survey in Ho Chi Minh city, Vietnam. Vaccines, 9(7), 794. https://doi.org/10.3390/vaccines9070794
- Vuong QH, Nguyen MH, Le TT. (2021). Home scholarly culture, book selection reason, and academic performance: Pathways to book reading interest among secondary school students. European Journal of Investigation in Health, Psychology and Education, 11(2), 468-495. https://doi.org/10.3390/ejihpe11020034
- Vehtari A, Gelman A, Gabry J. (2017). Practical Bayesian model evaluation using leave-one-out cross-validation and WAIC. Statistics and Computing, 27(5), 1413-1432. https://doi.org/10.1007/s11222-016-9696-4