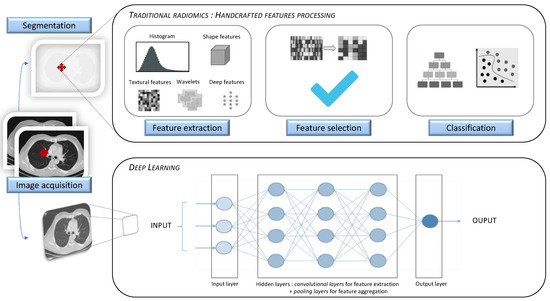
Artificial intelligence (AI) has increasingly been serving the field of radiology over the last 50 years. As modern medicine is evolving towards precision medicine, offering personalized patient care and treatment, the requirement for robust imaging biomarkers has gradually increased. Radiomics, a specific method generating high-throughput extraction of a tremendous amount of quantitative imaging data using data-characterization algorithms, has shown great potential in individuating imaging biomarkers. Radiomic analysis can be implemented through the following two methods: hand-crafted radiomic features extraction or deep learning algorithm. Its application in lung diseases can be used in clinical decision support systems, regarding its ability to develop descriptive and predictive models in many respiratory pathologies.
- radiomics
- artificial intelligence
- lung diseases
- precision medicine
Note: The following contents are extract from your paper. The entry will be online only after author check and submit it.
1. Introduction
| Terminology Used in Radiomics and AI | |
|---|---|
| Artificial intelligence | |
| Study | Description | Cohort | Performance | ||||||
|---|---|---|---|---|---|---|---|---|---|
| Wide-ranging branch of computer science, generating complex software that perform tasks that would typically have required human intelligence, by sensing and responding to a feature of their environment. | |||||||||
| Chen et al. (2018) [7] |
| 33 benign CT 42 malignant CT |
Benign vs. malignant Accuracy 84% Sensitivity 92.85% Specificity 72.73% | ||||||
| CAD (Computer Aided Detection or Diagnosis) | Technology combining elements of artificial intelligence with radiological and pathology image processing. Its aim is to assist in the detection and/or diagnosis of diseases, improving the accuracy of radiologists with a reduction in time in the interpretation of images. | ||||||||
| De Koning et al. (2020) [9] | De Koning et al. (2020) [8] |
| 15,792 patients | Benign vs. malignant: impact on mortality At 10 years, cancer mortality = 2.5 deaths/100,000 persons/years (screening group) vs. 3.3 deaths/100,000 (no-screening group) Cumulative ratio 0.76 ( | p | = 0.01) | Radiomics | ||
| Ma et al. (2016) [10 | Method that extracts a large number of quantitative features from radiographic medical images using data-characterization algorithms, to help in disease diagnosis and prognosis. | ||||||||
| ] | Ma et al. (2016) [9] |
| 36 benign CT 94 malignant CT |
Benign vs. malignant Accuracy 82.7% Sensitivity 80% Specificity 85.5% |
Machine Learning | ||||
| Hawkins et al. (2016) [11] | Hawkins et al. (2016) [Field in artificial intelligence studying computer algorithms that improve automatically through experience, by building a model based on sample data, known as “training data”, in order to make predictions or decisions. Supervised learning: The computer receives example inputs and their foreseen outputs. Its goal is to learn a general and reproducible function that links inputs to outputs. Unsupervised learning: The computer receives no labels to the learning algorithm for previously undetected patterns in a data set, leaving it on its own to find structure in its input. |
||||||||
| 10] |
| ||||||||
|
| Transient PSNs 39 benign CT Persistent PSNs 17 benign CT 30 malignant CT |
Prediction of persistent part-solid nodules AUC 0.93 if texture analysis was combined to clinical and CT features |
||||||
| Autrusseau et al. (2021) [17] | Autrusseau et al. (2021) [18] |
| 99 lung nodules |
| Concordance between FD and ULD chest CT in radiomic-guided nodule risk assessment ICC of 0.82, displaying a good agreement in malignancy similarity index between ULD and FD chest CT |
2.2. Cancer
| Study | Description | Cohort | Performance | |||||
|---|---|---|---|---|---|---|---|---|
| Wu et al. (2016) [23] | Wu et al. (2016) [24] |
| Training cohort 198 malignant CT Validation cohort 152 malignant CT |
Tumor histology correlation AUC 0.72 |
||||
| Yu et al. (2019) [34] | Yu et al. (2019) [31] |
| Training cohort 87 NSCLC CT Validation cohort 58 NSCLC CT |
Diagnosis and staging in NSCLC AUC > 0.70, with predictive accuracy higher in lung adenocarcinoma than in lung squamous cell carcinoma |
||||
| Liu et al. (2016) [36] | Liu et al. (2016) [32] |
| 298 malignant CT | Prediction of mutation status AUC EGFR+ status prediction 0.647, improved to 0.709 when adding a clinical model |
||||
| ||||||||
| ||||||||
| 182 malignant CT | Prediction of recurrence after SBRT AUC 0.85 (radiomic signature of 5 features predicting local recurrence) |
||||||
| Coroller et al. (2016) [49] | Coroller et al. (2016) [40] |
| 127 malignant CT Training cohort 80% Validation cohort 20% |
Prediction of response after NCT AUC for pathologic gross residual disease prediction (7 features) > 0.6 AUC for pathologic complete response (1 feature) 0.63 AUC for poor response 0.63 (spherical disproportionality) or 0.61 (heterogeneous texture) |
||||
| Kim et al. (2017) [50] | Kim et al. (2017) [41] |
| 48 malignant CT (NSCLC, EGFR mutant) | Prediction of response to TKI |
| |||
| Lafata et al. (2019) [52] | Lafata et al. (2019) [42] |
| 64 malignant CT (NSCLC) | Prediction of PFTs |
|
2.3. Obstructive Lung Diseases
2.3.1. COPD
2.3.2. Asthma
2.4. Interstitial Lung Diseases
| Study | Description | Cohort | Performance | |||||||||||||||
|---|---|---|---|---|---|---|---|---|---|---|---|---|---|---|---|---|---|---|
| Schniering et al. (2019) [74] | Schniering et al. (2019) [73] |
| 66 ILD CT (20 mild ILD and 46 advanced ILD) | Staging of ILD (proof of concept) AUC 0.929 |
||||||||||||||
| Stefano et al. (2020) [75] | Stefano et al. (2020) [74] |
| 32 IPF CT | Severity of IPF NL (normally attenuated lung) at -200 HU demonstrated the strongest correlation with disease severity ( | p | = 0.009) | ||||||||||||
| Martini et al. (2020) [76] | Martini et al. (2020) [75] |
| 66 SSc CT Training cohort 70% Validation cohort 30% |
Severity and staging of SSc-ILD |
| |||||||||||||
| Rios Velasquez et al. (2017) [37] | Rios Velasquez et al. (2017) [33] | |||||||||||||||||
| Ungprasert et al. (2017) [77] | Ungprasert et al. (2017) [76] |
|
328 benign CT 170 malignant CT |
|
Training cohort 353 malignant CT Validation cohort Benign vs. malignant Accuracy 80% |
352 malignant CT | Prediction of mutation status | 110 ILD CT |
|
AUC EGFR + versus EGFR− status 0.70 AUC KRAS + versus KRAS− status 0.63 |
Correlation with PFTs in IIM associated ILD |
|
Convolutional neural networks | Class of deep neural networks, which have the particularity of being fully connected networks. It gives them the advantage of understanding the hierarchical pattern in data and assembling more complex patterns using smaller and simpler patterns. | ||||
| AUC EGFR+ versus KRAS+ status 0.80 |
|
| Huang et al. (2018) [12] | Huang et al. (2018) [11] | ||||||||||||||
| Tang et al. (2018) [39] | Tang et al. (2018) [34] |
|
| |||||||||||||||
| Kim et al. (2015) [78] | Kim et al. (2015) [77] |
|
| Training cohort 70 benign CT 70 malignant CT Validation cohort 26 benign CT 20 malignant CT |
| Training cohort 114 malignant CT Validation cohort 176 malignant CTBenign vs. malignant Accuracy 91% Sensitivity 95% Specificity 88% |
57 IPF patients |
|
Prediction of immune modulator status Favorable outcome in low CT intensity and high heterogeneity with low PDL 1 and high CD3 |
Correlation with baseline lung function and prediction of evolution in IPF |
|
Voxel | ||||||
| Uthoff et al. (2020) [13] | Uthoff et al. (2020) [12 | ||||||||||||||||
| Wu et al. (2020) [40] | Wu et al. (2020) [35Single sample, or data point, on a regularly spaced, three-dimensional grid. In CT scans, the values of voxels are Hounsfield units. A voxel is a 3D pixel. |
|||||||||||||||||
| ] | ] | |||||||||||||||||
| De Giacomi et al. (2017) [79] | De Giacomi et al. (2017) [78] |
|
|
|
|
Training cohort 289 benign CT 74 malignant CT Validation cohort 50 benign CT 50 malignant CT |
Training cohort 229 NSCLC Validation cohort 68 NSCLC |
40 biopsy-confirmed UIP 20 biopsy-confirmed NSIPBenign vs. malignant Accuracy 98% Sensitivity 100% Specificity 96% |
Prediction of invasiveness | ROI (Region of Interest) | ||||||||
| AUC 0.98 for the model combining ground-glass and solid features | Improvement of 0.14 in AUC when adding ground-glass radiomic features to solid featuresDifferentiation NSIP vs. IPF |
| Mao et al. (2019) [14 | Image areas containing the information relevant to image processing. | ||||||||||||||
| ] | Mao et al. (2019) [13] |
| ||||||||||||||||
| Coroller et al. (2015) [41] | Coroller et al. (2015) [36] |
| ||||||||||||||||
| Lee et al. (2018) [80] | Lee et al. (2018) [79] |
|
|
|
| Training cohort 156 benign CT 40 malignant CT Validation cohort 75 benign CT 23 malignant CT |
Training cohort 98 malignant CT Validation cohort 84 malignant CTBenign vs. malignant Accuracy 89.8% Sensitivity 81% Specificity 92.2% |
Prediction of distant metastasis A multivariate radiomic signature (3 features) yielded a high prognostic performance for distant metastasis (CI 0.61) |
| 26 CT from tubrcolosis patients, 21 CT from sarcoidosis patients. | Skew of histogram | Measure of the asymmetry of attenuation distribution. The lung normal attenuation histogram is skewed to the left. There is a decreased leftward skewness in IPF. |
||||||
| Differentiation between tuberculosis and sarcoidosis LN |
|
| Maldonado et al. (2021) [18] | Maldonado et al. (2021) [14] | ||||||||||||||
| He et al. (2019) [43] | He et al. (2019) [37] | |||||||||||||||||
| Best et al. (2008) [81] | Best et al. (2008) [80] |
|
|
Validation cohort 91 malignant CT 79 benign CT |
Kurtosis of histogram | Measurement of how sharp an attenuation distribution curve is. Kurtosis is abnormally low in idiopathic pulmonary fibrosis (IPF). |
||||||||||||
| Threshold measurement | Total count of pixels/voxels above or below a specific attenuation value that determines a relative volume. Threshold measures in emphysema quantifies the extent of emphysema according to a specific index of −950 Hounsfield units (HU). |
|||||||||||||||||
| Texture analysis | Statistical methods that evaluate spatial relationship between voxels in an ROI, in order to characterize textural features of the parenchyma and give information about heterogeneity. |
2. The Role of Radiomics in Lung Diseases
2.1. Lung Nodules
| Training cohort | |||||||||||||
| |||||||||||||
|
423 NSCLC CT Validation cohort 294 NSCLC CT |
167 IPF patients |
|
Benign vs. malignant AUC 0.90 Sensitivity 92.3% Specificity 62% |
|||||||||
| Prediction of lymph node metastasis | Good discrimination for the model defining a radiomics-based predictive score (C index 0.785) | Prediction of mortality and progression in IPF |
| Mehta et al. (2021) [22] | Mehta et al. (2021) [15] | ||||||||
| Ferreira et al. (2018) [45] | Ferreira et al. (2018) [38] | ||||||||||||
| Maldonado et al. (2014) [82] | Maldonado et al. (2014) [81] |
|
|
|
| 1018 CTs Malignancy rating from 1 to 5 |
|
Training cohort 52 malignant CT Validation cohort 16 malignant CTBenign vs. malignant AUC 0.87 on fully supervised 3D CNN + random forest model (images, biomarkers and volumetric features) AUC 0.93 on semi-supervised random forest (biomarkers only) |
|||||
| Histology and distant metastasis | AUC lymph nodal metastasis 0.89 | AUC distant metastasis 0.97 AUC histopathology 0.92 |
55 IPF patients | Correlation between CT changes and mortality in IPF |
| Digumarthy et al. (2019) [24] | Digumarthy et al. (2019) [16] |
| |||||
| Mattonen et al. (2016) [46] | Mattonen et al. (2016) [39] | ||||||||||||
| Jacob et al. (2017) [83] | Jacob et al. (2017) [82] |
|
| 31 benign CT 77 malignant CT |
Benign vs. malignant according to temporal changes AUC 0.741 |
||||||||
| 283 IPF CT | Prediction of mortality in IPF |
| Lee et al. (2014) [ | |||||||||
| Kim et al. (2011) [8416] | Lee et al. (2014) | ] | Kim et al. (2011) [83][17] |
| 83 SSc-ILD CT |
| Evaluate the effectiveness of cyclophosphamide in SSc-ILD |
|
2.5. Vascular Lung Diseases
2.6. Pleural Diseases
The rare studies exploring the pleura from a radiomic perspective only concern pleural tumor invasion in lung cancer. For example, Yang et al. [90] exposed a strong association between tumor imaging phenotype, as defined by radiomic features, and dry pleural dissemination. Studies are still needed in the field of radiomics, applied to benign or malignant primitive pleural diseases.References
- Lambin, P.; Rios-Velazquez, E.; Leijenaar, R.; Carvalho, S.; van Stiphout, R.G.P.M.; Granton, P.; Zegers, C.M.L.; Gillies, R.; Boellard, R.; Dekker, A.; et al. Radiomics: Extracting more information from medical images using advanced feature analysis. Eur. J. Cancer 2012, 48, 441–446.
- Wilson, D.O.; Ryan, A.; Fuhrman, C.; Schuchert, M.; Shapiro, S.; Siegfried, J.M.; Weissfeld, J. Doubling Times and CT Screen–Detected Lung Cancers in the Pittsburgh Lung Screening Study. Am. J. Respir. Crit. Care Med. 2012, 185, 85–89.
- Hasegawa, M.; Sone, S.; Takashima, S.; Li, F.; Yang, Z.G.; Maruyama, Y.; Watanabe, T. Growth rate of small lung cancers detected on mass CT screening. Br. J. Radiol. 2000, 73, 1252–1259.
- Ko, J.P.; Berman, E.J.; Kaur, M.; Babb, J.S.; Bomsztyk, E.; Greenberg, A.K.; Naidich, D.P.; Rusinek, H. Pulmonary Nodules: Growth Rate Assessment in Patients by Using Serial CT and Three-dimensional Volumetry. Radiology 2012, 262, 662–671.
- Nordstrom, R.J. The Quantitative Imaging Network in Precision Medicine. Tomography 2016, 2, 239–241.
- Ather, S.; Kadir, T.; Gleeson, F. Artificial intelligence and radiomics in pulmonary nodule management: Current status and future applications. Clin. Radiol. 2020, 75, 13–19.
- Chen, C.-H.; Chang, C.-K.; Tu, C.-Y.; Liao, W.-C.; Wu, B.-R.; Chou, K.-T.; Chiou, Y.-R.; Yang, S.-N.; Zhang, G.; Huang, T.-C. Radiomic features analysis in computed tomography images of lung nodule classification. PLoS ONE 2018, 13, e0192002.
- de Koning, H.J.; van der Aalst, C.M.; de Jong, P.A.; Scholten, E.T.; Nackaerts, K.; Heuvelmans, M.A.; Lammers, J.-W.J.; Weenink, C.; Yousaf-Khan, U.; Horeweg, N.; et al. Reduced Lung-Cancer Mortality with Volume CT Screening in a Randomized Trial. N. Engl. J. Med. 2020, 382, 503–513.
- Ma, J.; Wang, Q.; Ren, Y.; Hu, H.; Zhao, J. Automatic lung nodule classification with radiomics approach. In Medical Imaging 2016: PACS and Imaging Informatics: Next Generation and Innovations; Zhang, J., Cook, T.S., Eds.; International Society for Optics and Photonics: San Diego, CA, USA, 2016; p. 978906. Available online: (accessed on 21 June 2021).
- Hawkins, S.; Wang, H.; Liu, Y.; Garcia, A.; Stringfield, O.; Krewer, H.; Li, Q.; Cherezov, D.; Gatenby, R.A.; Balagurunathan, Y.; et al. Predicting Malignant Nodules from Screening CT Scans. J. Thorac. Oncol. 2016, 11, 2120–2128.
- Huang, P.; Park, S.; Yan, R.; Lee, J.; Chu, L.C.; Lin, C.T.; Hussien, A.; Rathmell, J.; Thomas, B.; Chen, C.; et al. Added Value of Computer-aided CT Image Features for Early Lung Cancer Diagnosis with Small Pulmonary Nodules: A Matched Case-Control Study. Radiology 2018, 286, 286–295.
- Uthoff, J.; Stephens, M.J.; Newell, J.D.; Hoffman, E.A.; Larson, J.; Koehn, N.; De Stefano, F.A.; Lusk, C.M.; Wenzlaff, A.S.; Watza, D.; et al. Machine learning approach for distinguishing malignant and benign lung nodules utilizing standardized perinodular parenchymal features from CT. Med. Phys. 2019, 46, 3207–3216.
- Mao, L.; Chen, H.; Liang, M.; Li, K.; Gao, J.; Qin, P.; Ding, X.; Li, X.; Liu, X. Quantitative radiomic model for predicting malignancy of small solid pulmonary nodules detected by low-dose CT screening. Quant. Imaging Med. Surg. 2019, 9, 263–272.
- Maldonado, F.; Varghese, C.; Rajagopalan, S.; Duan, F.; Balar, A.B.; Lakhani, D.A.; Antic, S.L.; Massion, P.P.; Johnson, T.F.; Karwoski, R.A.; et al. Validation of the BRODERS classifier (Benign versus aggRessive nODule Evaluation using Radiomic Stratification), a novel HRCT-based radiomic classifier for indeterminate pulmonary nodules. Eur. Respir. J. 2021, 57, 2002485.
- Mehta, K.; Jain, A.; Mangalagiri, J.; Menon, S.; Nguyen, P.; Chapman, D.R. Lung Nodule Classification Using Biomarkers, Volumetric Radiomics, and 3D CNNs. J. Digit. Imaging 2021.
- Digumarthy, S.R.; Padole, A.M.; Rastogi, S.; Price, M.; Mooradian, M.J.; Sequist, L.V.; Kalra, M.K. Predicting malignant potential of subsolid nodules: Can radiomics preempt longitudinal follow up CT? Cancer Imaging 2019, 19, 36.
- Lee, S.H.; Lee, S.M.; Goo, J.M.; Kim, K.-G.; Kim, Y.J.; Park, C.M. Usefulness of Texture Analysis in Differentiating Transient from Persistent Part-solid Nodules(PSNs): A Retrospective Study. PLoS ONE 2014, 9, e85167.
- Autrusseau, P.-A.; Labani, A.; De Marini, P.; Leyendecker, P.; Hintzpeter, C.; Ortlieb, A.-C.; Calhoun, M.; Goldberg, I.; Roy, C.; Ohana, M. Radiomics in the evaluation of lung nodules: Intrapatient concordance between full-dose and ultra-low-dose chest computed tomography. Diagn. Interv. Imaging 2021, 102, 233–239.
- Horeweg, N.; van der Aalst, C.M.; Vliegenthart, R.; Zhao, Y.; Xie, X.; Scholten, E.T.; Mali, W.; Thunnissen, E.; Weenink, C.; Groen, H.J.M.; et al. Volumetric computed tomography screening for lung cancer: Three rounds of the NELSON trial. Eur. Respir. J. 2013, 42, 1659–1667.
- ACR. Lung CT Screening Reporting & Data System (Lung-RADS). Available online: (accessed on 20 April 2021).
- Murphy, A.; Skalski, M.; Gaillard, F. The utilisation of convolutional neural networks in detecting pulmonary nodules: A review. Br. J. Radiol. 2018, 91, 20180028.
- da Silva, G.L.F.; Valente, T.L.A.; Silva, A.C.; de Paiva, A.C.; Gattass, M. Convolutional neural network-based PSO for lung nodule false positive reduction on CT images. Comput. Methods Programs Biomed. 2018, 162, 109–118.
- Li, S.; Xu, P.; Li, B.; Chen, L.; Zhou, Z.; Hao, H.; Duan, Y.; Folkert, M.; Ma, J.; Huang, S.; et al. Predicting lung nodule malignancies by combining deep convolutional neural network and handcrafted features. Phys. Med. Biol. 2019, 64, 175012.
- Wu, W.; Parmar, C.; Grossmann, P.; Quackenbush, J.; Lambin, P.; Bussink, J.; Mak, R.; Aerts, H.J.W.L. Exploratory Study to Identify Radiomics Classifiers for Lung Cancer Histology. Front. Oncol. 2016, 6, 71.
- Radiomics of Lung Nodules: A Multi-Institutional Study of Robustness and Agreement of Quantitative Imaging Features. Tomography 2016, 2, 430–437.
- Balagurunathan, Y.; Gu, Y.; Wang, H.; Kumar, V.; Grove, O.; Hawkins, S.; Kim, J.; Goldgof, D.B.; Hall, L.O.; Gatenby, R.A.; et al. Reproducibility and Prognosis of Quantitative Features Extracted from CT Images. Transl. Oncol. 2014, 7, 72–87.
- Sung, H.; Ferlay, J.; Siegel, R.L.; Laversanne, M.; Soerjomataram, I.; Jemal, A.; Bray, F. Global Cancer Statistics 2020: GLOBOCAN Estimates of Incidence and Mortality Worldwide for 36 Cancers in 185 Countries. CA Cancer J. Clin. 2021, 71, 209–249.
- The National Lung Screening Trial Research Team Reduced Lung-Cancer Mortality with Low-Dose Computed Tomographic Screening. N. Engl. J. Med. 2011, 365, 395–409.
- National Lung Screening Trial Research Team Lung Cancer Incidence and Mortality with Extended Follow-up in the National Lung Screening Trial. J. Thorac. Oncol. Off. Publ. Int. Assoc. Study Lung Cancer 2019, 14, 1732–1742.
- Refaee, T.; Wu, G.; Ibrahim, A.; Halilaj, I.; Leijenaar, R.T.H.; Rogers, W.; Gietema, H.A.; Hendriks, L.E.L.; Lambin, P.; Woodruff, H.C. The Emerging Role of Radiomics in COPD and Lung Cancer. Respiration 2020, 99, 99–107.
- Yu, L.; Tao, G.; Zhu, L.; Wang, G.; Li, Z.; Ye, J.; Chen, Q. Prediction of pathologic stage in non-small cell lung cancer using machine learning algorithm based on CT image feature analysis. BMC Cancer 2019, 19, 464.
- Liu, Y.; Kim, J.; Balagurunathan, Y.; Li, Q.; Garcia, A.L.; Stringfield, O.; Ye, Z.; Gillies, R.J. Radiomic Features Are Associated With EGFR Mutation Status in Lung Adenocarcinomas. Clin. Lung Cancer 2016, 17, 441–448.e6.
- Rios Velazquez, E.; Parmar, C.; Liu, Y.; Coroller, T.P.; Cruz, G.; Stringfield, O.; Ye, Z.; Makrigiorgos, M.; Fennessy, F.; Mak, R.H.; et al. Somatic Mutations Drive Distinct Imaging Phenotypes in Lung Cancer. Cancer Res. 2017, 77, 3922–3930.
- Tang, C.; Hobbs, B.; Amer, A.; Li, X.; Behrens, C.; Canales, J.R.; Cuentas, E.P.; Villalobos, P.; Fried, D.; Chang, J.Y.; et al. Development of an Immune-Pathology Informed Radiomics Model for Non-Small Cell Lung Cancer. Sci. Rep. 2018, 8, 1922.
- Wu, G.; Woodruff, H.C.; Shen, J.; Refaee, T.; Sanduleanu, S.; Ibrahim, A.; Leijenaar, R.T.H.; Wang, R.; Xiong, J.; Bian, J.; et al. Diagnosis of Invasive Lung Adenocarcinoma Based on Chest CT Radiomic Features of Part-Solid Pulmonary Nodules: A Multicenter Study. Radiology 2020, 297, E282.
- Coroller, T.P.; Grossmann, P.; Hou, Y.; Rios Velazquez, E.; Leijenaar, R.T.H.; Hermann, G.; Lambin, P.; Haibe-Kains, B.; Mak, R.H.; Aerts, H.J.W.L. CT-based radiomic signature predicts distant metastasis in lung adenocarcinoma. Radiother. Oncol. 2015, 114, 345–350.
- He, L.; Huang, Y.; Yan, L.; Zheng, J.; Liang, C.; Liu, Z. China Radiomics-based predictive risk score: A scoring system for preoperatively predicting risk of lymph node metastasis in patients with resectable non-small cell lung cancer. Chin. J. Cancer Res. 2019, 31, 641–652.
- Ferreira Junior, J.R.; Koenigkam-Santos, M.; Cipriano, F.E.G.; Fabro, A.T.; Azevedo-Marques, P.M. de Radiomics-based features for pattern recognition of lung cancer histopathology and metastases. Comput. Methods Programs Biomed. 2018, 159, 23–30.
- Mattonen, S.A.; Palma, D.A.; Johnson, C.; Louie, A.V.; Landis, M.; Rodrigues, G.; Chan, I.; Etemad-Rezai, R.; Yeung, T.P.C.; Senan, S.; et al. Detection of Local Cancer Recurrence After Stereotactic Ablative Radiation Therapy for Lung Cancer: Physician Performance Versus Radiomic Assessment. Int. J. Radiat. Oncol. 2016, 94, 1121–1128.
- Coroller, T.P.; Agrawal, V.; Narayan, V.; Hou, Y.; Grossmann, P.; Lee, S.W.; Mak, R.H.; Aerts, H.J.W.L. Radiomic phenotype features predict pathological response in non-small cell lung cancer. Radiother. Oncol. 2016, 119, 480–486.
- Kim, H.; Park, C.M.; Keam, B.; Park, S.J.; Kim, M.; Kim, T.M.; Kim, D.-W.; Heo, D.S.; Goo, J.M. The prognostic value of CT radiomic features for patients with pulmonary adenocarcinoma treated with EGFR tyrosine kinase inhibitors. PLoS ONE 2017, 12, e0187500.
- Lafata, K.J.; Zhou, Z.; Liu, J.-G.; Hong, J.; Kelsey, C.R.; Yin, F.-F. An Exploratory Radiomics Approach to Quantifying Pulmonary Function in CT Images. Sci. Rep. 2019, 9, 11509.
- Aerts, H.J.W.L.; Velazquez, E.R.; Leijenaar, R.T.H.; Parmar, C.; Grossmann, P.; Carvalho, S.; Cavalho, S.; Bussink, J.; Monshouwer, R.; Haibe-Kains, B.; et al. Decoding tumour phenotype by noninvasive imaging using a quantitative radiomics approach. Nat. Commun. 2014, 5, 4006.
- Maldonado, F.; Boland, J.M.; Raghunath, S.; Aubry, M.C.; Bartholmai, B.J.; Deandrade, M.; Hartman, T.E.; Karwoski, R.A.; Rajagopalan, S.; Sykes, A.-M.; et al. Noninvasive characterization of the histopathologic features of pulmonary nodules of the lung adenocarcinoma spectrum using computer-aided nodule assessment and risk yield (CANARY)—A pilot study. J. Thorac. Oncol. Off. Publ. Int. Assoc. Study Lung Cancer 2013, 8, 452–460.
- Liu, Y.; Balagurunathan, Y.; Atwater, T.; Antic, S.; Li, Q.; Walker, R.C.; Smith, G.T.; Massion, P.P.; Schabath, M.B.; Gillies, R.J. Radiological Image Traits Predictive of Cancer Status in Pulmonary Nodules. Clin. Cancer Res. Off. J. Am. Assoc. Cancer Res. 2017, 23, 1442–1449.
- Zhang, L.; Chen, B.; Liu, X.; Song, J.; Fang, M.; Hu, C.; Dong, D.; Li, W.; Tian, J. Quantitative Biomarkers for Prediction of Epidermal Growth Factor Receptor Mutation in Non-Small Cell Lung Cancer. Transl. Oncol. 2018, 11, 94–101.
- Weiss, G.J.; Ganeshan, B.; Miles, K.A.; Campbell, D.H.; Cheung, P.Y.; Frank, S.; Korn, R.L. Noninvasive Image Texture Analysis Differentiates K-ras Mutation from Pan-Wildtype NSCLC and Is Prognostic. PLoS ONE 2014, 9, e100244.
- Song, J.; Liu, Z.; Zhong, W.; Huang, Y.; Ma, Z.; Dong, D.; Liang, C.; Tian, J. Non-small cell lung cancer: Quantitative phenotypic analysis of CT images as a potential marker of prognosis. Sci. Rep. 2016, 6, 38282.
- Hosny, A.; Parmar, C.; Coroller, T.P.; Grossmann, P.; Zeleznik, R.; Kumar, A.; Bussink, J.; Gillies, R.J.; Mak, R.H.; Aerts, H.J.W.L. Deep learning for lung cancer prognostication: A retrospective multi-cohort radiomics study. PLOS Med. 2018, 15, e1002711.
- Chetan, M.R.; Gleeson, F.V. Radiomics in predicting treatment response in non-small-cell lung cancer: Current status, challenges and future perspectives. Eur. Radiol. 2021, 31, 1049–1058.
- Bera, K.; Velcheti, V.; Madabhushi, A. Novel Quantitative Imaging for Predicting Response to Therapy: Techniques and Clinical Applications. Am. Soc. Clin. Oncol. Educ. Book 2018, 38, 1008–1018.
- Limkin, E.J.; Sun, R.; Dercle, L.; Zacharaki, E.I.; Robert, C.; Reuzé, S.; Schernberg, A.; Paragios, N.; Deutsch, E.; Ferté, C. Promises and challenges for the implementation of computational medical imaging (radiomics) in oncology. Ann. Oncol. 2017, 28, 1191–1206.
- Gevenois, P.A.; de Maertelaer, V.; De Vuyst, P.; Zanen, J.; Yernault, J.C. Comparison of computed density and macroscopic morphometry in pulmonary emphysema. Am. J. Respir. Crit. Care Med. 1995, 152, 653–657.
- Madani, A.; Zanen, J.; de Maertelaer, V.; Gevenois, P.A. Pulmonary emphysema: Objective quantification at multi-detector row CT--comparison with macroscopic and microscopic morphometry. Radiology 2006, 238, 1036–1043.
- de Jong, P.A.; Müller, N.L.; Paré, P.D.; Coxson, H.O. Computed tomographic imaging of the airways: Relationship to structure and function. Eur. Respir. J. 2005, 26, 140–152.
- Madani, A.; Van Muylem, A.; Gevenois, P.A. Pulmonary Emphysema: Effect of Lung Volume on Objective Quantification at Thin-Section CT. Radiology 2010, 257, 260–268.
- Bankier, A.A.; De Maertelaer, V.; Keyzer, C.; Gevenois, P.A. Pulmonary Emphysema: Subjective Visual Grading versus Objective Quantification with Macroscopic Morphometry and Thin-Section CT Densitometry. Radiology 1999, 211, 851–858.
- Mohamed Hoesein, F.A.A.; de Hoop, B.; Zanen, P.; Gietema, H.; Kruitwagen, C.L.J.J.; van Ginneken, B.; Isgum, I.; Mol, C.; van Klaveren, R.J.; Dijkstra, A.E.; et al. CT-quantified emphysema in male heavy smokers: Association with lung function decline. Thorax 2011, 66, 782–787.
- Pompe, E.; van Rikxoort, E.M.; Schmidt, M.; Rühaak, J.; Estrella, L.G.; Vliegenthart, R.; Oudkerk, M.; de Koning, H.J.; van Ginneken, B.; de Jong, P.A.; et al. Parametric response mapping adds value to current computed tomography biomarkers in diagnosing chronic obstructive pulmonary disease. Am. J. Respir. Crit. Care Med. 2015, 191, 1084–1086.
- Hackx, M.; Francotte, D.; Garcia, T.S.; Van Muylem, A.; Walsdorff, M.; Gevenois, P.A. Effect of total lung capacity, gender and height on CT airway measurements. Br. J. Radiol. 2017, 90, 20160898.
- Ginsburg, S.B.; Lynch, D.A.; Bowler, R.P.; Schroeder, J.D. Automated Texture-based Quantification of Centrilobular Nodularity and Centrilobular Emphysema in Chest CT Images. Acad. Radiol. 2012, 19, 1241–1251.
- Martini, K.; Frauenfelder, T. Advances in imaging for lung emphysema. Ann. Transl. Med. 2020, 8, 1467.
- Lynch, D.A.; Austin, J.H.M.; Hogg, J.C.; Grenier, P.A.; Kauczor, H.-U.; Bankier, A.A.; Barr, R.G.; Colby, T.V.; Galvin, J.R.; Gevenois, P.A.; et al. CT-Definable Subtypes of Chronic Obstructive Pulmonary Disease: A Statement of the Fleischner Society. Radiology 2015, 277, 192–205.
- Occhipinti, M.; Paoletti, M.; Bartholmai, B.J.; Rajagopalan, S.; Karwoski, R.A.; Nardi, C.; Inchingolo, R.; Larici, A.R.; Camiciottoli, G.; Lavorini, F.; et al. Spirometric assessment of emphysema presence and severity as measured by quantitative CT and CT-based radiomics in COPD. Respir. Res. 2019, 20, 101.
- Cho, Y.H.; Seo, J.B.; Lee, S.M.; Kim, N.; Yun, J.; Hwang, J.E.; Lee, J.S.; Oh, Y.-M.; Do Lee, S.; Loh, L.-C.; et al. Radiomics approach for survival prediction in chronic obstructive pulmonary disease. Eur. Radiol. 2021.
- Cho, Y.H.; Lee, S.M.; Seo, J.B.; Kim, N.; Bae, J.P.; Lee, J.S.; Oh, Y.-M.; Do-Lee, S. Quantitative assessment of pulmonary vascular alterations in chronic obstructive lung disease: Associations with pulmonary function test and survival in the KOLD cohort. Eur. J. Radiol. 2018, 108, 276–282.
- Stockley, R.A.; Parr, D.G.; Piitulainen, E.; Stolk, J.; Stoel, B.C.; Dirksen, A. Therapeutic efficacy of alpha-1 antitrypsin augmentation therapy on the loss of lung tissue: An integrated analysis of 2 randomised clinical trials using computed tomography densitometry. Respir. Res. 2010, 11, 136.
- Chandra, D.; Lipson, D.A.; Hoffman, E.A.; Hansen-Flaschen, J.; Sciurba, F.C.; DeCamp, M.M.; Reilly, J.J.; Washko, G.R. Perfusion Scintigraphy and Patient Selection for Lung Volume Reduction Surgery. Am. J. Respir. Crit. Care Med. 2010, 182, 937–946.
- Milanese, G.; Silva, M.; Sverzellati, N. Lung volume reduction of pulmonary emphysema: The radiologist task. Curr. Opin. Pulm. Med. 2016, 22, 179–186.
- Gupta, S.; Hartley, R.; Khan, U.T.; Singapuri, A.; Hargadon, B.; Monteiro, W.; Pavord, I.D.; Sousa, A.R.; Marshall, R.P.; Subramanian, D.; et al. Quantitative computed tomography–derived clusters: Redefining airway remodeling in asthmatic patients. J. Allergy Clin. Immunol. 2014, 133, 729–738.e18.
- Choi, S.; Hoffman, E.A.; Wenzel, S.E.; Castro, M.; Fain, S.; Jarjour, N.; Schiebler, M.L.; Chen, K.; Lin, C.-L. Quantitative computed tomographic imaging–based clustering differentiates asthmatic subgroups with distinctive clinical phenotypes. J. Allergy Clin. Immunol. 2017, 140, 690–700.e8.
- Tunon-de-Lara, J.-M.; Laurent, F.; Giraud, V.; Perez, T.; Aguilaniu, B.; Meziane, H.; Basset-Merle, A.; Chanez, P. Air trapping in mild and moderate asthma: Effect of inhaled corticosteroids. J. Allergy Clin. Immunol. 2007, 119, 583–590.
- Schniering, J.; Gabrys, H.; Brunner, M.; Distler, O.; Guckenberger, M.; Bogowicz, M.; Vuong, D.; Karava, K.; Müller, C.; Frauenfelder, T.; et al. Computed-tomography-based radiomics features for staging of interstitial lung disease—Transferability from experimental to human lung fibrosis—A proof-of-concept study. Eur. Respir. Soc. 2019, 54, PA4806. Available online: (accessed on 23 October 2020).
- Stefano, A.; Gioè, M.; Russo, G.; Palmucci, S.; Torrisi, S.E.; Bignardi, S.; Basile, A.; Comelli, A.; Benfante, V.; Sambataro, G.; et al. Performance of Radiomics Features in the Quantification of Idiopathic Pulmonary Fibrosis from HRCT. Diagnostics 2020, 10, 306.
- Martini, K.; Baessler, B.; Bogowicz, M.; Blüthgen, C.; Mannil, M.; Tanadini-Lang, S.; Schniering, J.; Maurer, B.; Frauenfelder, T. Applicability of radiomics in interstitial lung disease associated with systemic sclerosis: Proof of concept. Eur. Radiol. 2021, 31, 1987–1998.
- Ungprasert, P.; Wilton, K.M.; Ernste, F.C.; Kalra, S.; Crowson, C.S.; Rajagopalan, S.; Bartholmai, B.J. Novel Assessment of Interstitial Lung Disease Using the “Computer-Aided Lung Informatics for Pathology Evaluation and Rating” (CALIPER) Software System in Idiopathic Inflammatory Myopathies. Lung 2017, 195, 545–552.
- Kim, H.J.; Brown, M.S.; Chong, D.; Gjertson, D.W.; Lu, P.; Kim, H.J.; Coy, H.; Goldin, J.G. Comparison of the Quantitative CT Imaging Biomarkers of Idiopathic Pulmonary Fibrosis at Baseline and Early Change with an Interval of 7 Months. Acad. Radiol. 2015, 22, 70–80.
- De Giacomi, F.; Raghunath, S.; Karwoski, R.; Bartholmai, B.J.; Moua, T. Short-term Automated Quantification of Radiologic Changes in the Characterization of Idiopathic Pulmonary Fibrosis Versus Nonspecific Interstitial Pneumonia and Prediction of Long-term Survival. J. Thorac. Imaging 2018, 33, 124–131.
- Lee, C.U.; Chong, S.; Choi, H.W.; Choi, J.C. Quantitative image analysis using chest computed tomography in the evaluation of lymph node involvement in pulmonary sarcoidosis and tuberculosis. PLoS ONE 2018, 13, e0207959.
- Best, A.C.; Meng, J.; Lynch, A.M.; Bozic, C.M.; Miller, D.; Grunwald, G.K.; Lynch, D.A. Idiopathic pulmonary fibrosis: Physiologic tests, quantitative CT indexes, and CT visual scores as predictors of mortality. Radiology 2008, 246, 935–940.
- Maldonado, F.; Moua, T.; Rajagopalan, S.; Karwoski, R.A.; Raghunath, S.; Decker, P.A.; Hartman, T.E.; Bartholmai, B.J.; Robb, R.A.; Ryu, J.H. Automated quantification of radiological patterns predicts survival in idiopathic pulmonary fibrosis. Eur. Respir. J. 2014, 43, 204–212.
- Jacob, J.; Bartholmai, B.J.; Rajagopalan, S.; Kokosi, M.; Nair, A.; Karwoski, R.; Walsh, S.L.F.; Wells, A.U.; Hansell, D.M. Mortality prediction in idiopathic pulmonary fibrosis: Evaluation of computer-based CT analysis with conventional severity measures. Eur. Respir. J. 2017, 49, 1601011.
- Kim, H.J.; Brown, M.S.; Elashoff, R.; Li, G.; Gjertson, D.W.; Lynch, D.A.; Strollo, D.C.; Kleerup, E.; Chong, D.; Shah, S.K.; et al. Quantitative texture-based assessment of one-year changes in fibrotic reticular patterns on HRCT in scleroderma lung disease treated with oral cyclophosphamide. Eur. Radiol. 2011, 21, 2455–2465.
- Walsh, S.L.F.; Calandriello, L.; Silva, M.; Sverzellati, N. Deep learning for classifying fibrotic lung disease on high-resolution computed tomography: A case-cohort study. Lancet Respir. Med. 2018, 6, 837–845.
- Kiely, D.; Lawrie, A.; Doyle, O.; Salvatelli, V.; Daniels, F.; Drage, E.; Jenner, H.; Rigg, J.; Schmitt, C.; Samyshkin, Y.; et al. Real world data from hospital episode statistics can be used to determine patients at risk of idiopathic pulmonary arterial hypertension. Eur. Respir. Soc. 2018, 52, PA3082. Available online: (accessed on 23 March 2021).
- Avendi, M.R.; Kheradvar, A.; Jafarkhani, H. Automatic segmentation of the right ventricle from cardiac MRI using a learning-based approach: Automatic Segmentation Using a Learning-Based Approach. Magn. Reson. Med. 2017, 78, 2439–2448.
- Avendi, M.R.; Kheradvar, A.; Jafarkhani, H. A combined deep-learning and deformable-model approach to fully automatic segmentation of the left ventricle in cardiac MRI. Med. Image Anal. 2016, 30, 108–119.
- Kiely, D.G.; Levin, D.L.; Hassoun, P.M.; Ivy, D.; Jone, P.-N.; Bwika, J.; Kawut, S.M.; Lordan, J.; Lungu, A.; Mazurek, J.A.; et al. Statement on imaging and pulmonary hypertension from the Pulmonary Vascular Research Institute (PVRI). Pulm. Circ. 2019, 9, 204589401984199.
- Lungu, A.; Swift, A.; Capener, D.; Kiely, D.; Hose, R.; Wild, J. Diagnosis of pulmonary hypertension from MR image based computational models of pulmonary vascular haemodynamics and decision tree analysis. Eur. Respir. Soc. 2015, 46, PA2109. Available online: (accessed on 6 December 2020).
- Yang, M.; Ren, Y.; She, Y.; Xie, D.; Sun, X.; Shi, J.; Zhao, G.; Chen, C. Imaging phenotype using radiomics to predict dry pleural dissemination in non-small cell lung cancer. Ann. Transl. Med. 2019, 7, 259.