In this entry, we performed whole-genome resequencing (WGRS) of five domesticated Jeju horses and one Thoroughbred. Using the horse reference genome data, we determined a significant number of SNPs and insertion/deletion (INDEL) throughout the genome. All the structure variants were annotated, particularly resulting in nonsynonymous mutations that can be further used as genetic markers that would predict phenotypic variation in patterns of interest in Jeju horses. Interestingly, the results of the WGRS comparison indicated that the eqCD1a6 gene contains signatures of positive natural selection in Jeju horses and is thought to be the result of environmental adaptation. In addition, we confirmed the Gene Ontology (GO) term of Jeju horses through GO analysis and found that there are many correlations in genes related to the heart and nerves. These results are indirect evidence that Jeju horses show physical differences from Thoroughbred horses.
2.1. Sequencing, Read Mapping, and Genomic Variant Detection
To detect Jeju horse-specific genomic variation, we compared the genomes of Jeju horses, which have been geographically isolated for a long time, with the horse reference genome. In order to obtain more accurate results, we generated additional genome data of a Thoroughbred horse breed in the same species as the horse reference genome. We performed WGRS on five Jeju horses and one Thoroughbred horse using the Illumina HiSeq 2500 platform and obtained a total of 696,089,910 raw reads. The raw reads were trimmed and deduplicated via Sickle and Picard, resulting in an average of 609,556,376 clean reads. Next, the clean reads were mapped to the horse reference genome using BWA, and finally, the average read depth of the six horses ranged from 31.48x to 46.01x (an average of ~35.79x,
Table 1).
Table 1. The genomic mapping results by whole-genome resequencing.
| Classification |
Jeju_1 |
Jeju_2 |
Jeju_3 |
Jeju_4 |
Jeju_5 |
Thoroughbred |
Average |
| Total reads | a |
690,508,306 |
609,871,934 |
661,791,072 |
617,836,736 |
606,111,944 |
990,419,468 |
696,089,910 |
| Clean reads |
621,253,885 |
532,985,097 |
581,568,986 |
555,881,352 |
a Total reads: The total number of reads generated.
b The number of reads after trimming and deduplication with Sickle and Picard; (%) = No. of Clean reads/No. of Total reads.
c The number of reads mapped to the reference using BWA mapping tool; (%) = No. of Mapped reads/No. of Clean reads.
To identify Jeju horse-specific structural variation (SV), we compared the genome data obtained from five Jeju horses with the horse reference genome using the GATK tool and the variant annotations in VCF files were created with SnpEff. As a result, we found an average of 6,686,678 SNPs, 436,460 insertions, and 456,249 deletions in the Jeju horse (
Table 2).
Table 2. The number of variants counting by types for all 5 Jeju horses.
| Type | a |
Jeju_1 |
Jeju_2 |
Jeju_3 |
Jeju_4 |
Jeju_5 |
Thoroughbred |
| Homo INS |
246,788 |
235,661 |
242,743 |
238,128 |
239,981 |
157,841 |
| 545,197,568 |
820,451,365 |
609,556,376 |
| Hetero INS |
199,722 |
187,896 |
193,519 |
201,288 |
195,073 |
142,173 |
Clean reads, % | b |
89.97% |
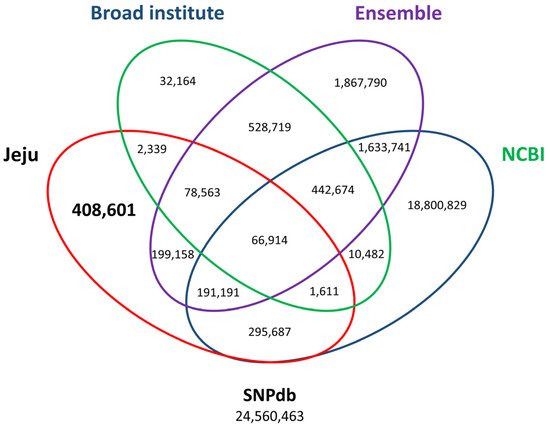
14]. The previously registered SNPs consisted of 21,443,129 dbSNPs, 5,008,750 Ensembl, and 1,163,466 Broad Institute. Finally, a total of 408,601 Jeju horse-specific SNPs that do not overlap with open access databases were identified (
Figure 4). The 408,601 Jeju horse-specific SNPs were divided into 94,192 homozygous and 314,409 heterozygous. For the 113,498 Jeju horse-specific insertions, they were divided into 85,394 homozygous and 28,104 heterozygous. For the 114,751 Jeju horse-specific deletions, they were divided into 75,115 homozygous and 39,636 heterozygous. Among the identified SVs, we analyzed the loci of those corresponding to homozygous SVs (94,192 homozygous SNPs, 85,394 homozygous insertions, 75,115 homozygous deletions) in all five Jeju horses. This showed that most SVs resided in intergenic regions (an average of 64%), followed by an intron, upstream region, and exon (
Table 3).
Figure 4. Third comparison of SNP variants using open-access SNP data for horses. By comparing open access SNP data published at the Broad Institute (add URL), Ensembl (add URL), and NCBI (add URL), 408,601 out of 1,244,064 SNPs accounting for 1.66% of all the variants in the SNP database (SNPdb) were finally identified. The number of final Jeju horse-specific SNPs is highlighted in the bold letter.
Table 3. Number of effects by region.
| Region |
SNP |
INS |
DEL |
| Upstream |
7715 |
10,497 |
7336 |
| Exon |
1138 |
1484 |
903 |
| 87.39% |
436,262 |
439,416 |
435,054 |
| Intergenic | 300,014 |
| 63,497 |
84,897 | 87.88% |
89.97% |
89.95% |
82.84% |
46,518 | 88% |
| Mapped reads |
| Total INS | 612,618,456 |
523,657,858 |
572,263,882 |
547,987,837 |
Homo DEL536,038,249 |
263,896 |
254,611 |
259,821 |
255,380780,311,183 |
595,479,578 |
| 258,247 |
166,728 |
Mapped reads, % | c |
98.61% |
98.25% |
98.40% |
| intragenic |
119 |
98.58% |
98.32% |
95.11% |
97.88% |
| 446,510 |
423,557 | 190 |
112 |
Hetero DEL |
201,114 |
190,505 |
196,679 |
204,404 |
196,586 |
122,802 |
| Total DEL |
| Intron |
21,312 |
37,272 |
19,557 |
Average Depth |
37.24x |
31.48x |
34.50x |
33.14x |
32.36x |
46.01x |
35.79x |
465,010 |
445,116 |
456,500 |
459,784 |
454,833 |
289,530 |
| Splice site |
194 |
595 |
435 |
Homo SNP |
2,404,789 |
2,331,653 |
2,415,831 |
2,329,651 |
2,369,765 |
1,740,637 |
| Hetero SNP |
4,304,466 |
4,211,637 |
4,312,941 |
4,397,561 |
4,355,094 |
2,202,227 |
| Total SNP |
6,709,255 |
6,543,290 |
6,728,772 |
6,727,212 |
6,724,859 |
3,942,864 |
a Homo = homozygous; Hetero = heterozygous; INS = insertion; DEL = deletion.
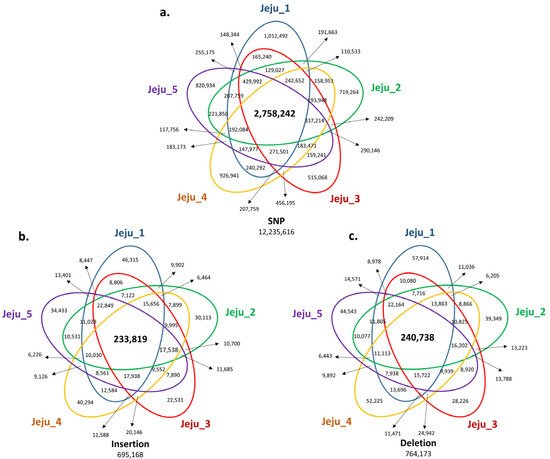
Next, we analyzed the SV positions shared by five Jeju horses to find Jeju horse-specific SVs. As a result, 2,758,242 SNPs, 233,819 insertions, and 240,738 deletions were identified as SVs shared by five Jeju horses (
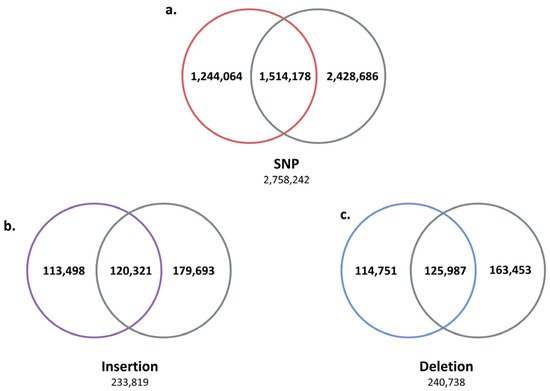
Figure 2). The SV results shared by five Jeju horses were compared with the WGRS data of one Thoroughbred horse to further reduce the number of Jeju horse-specific SVs by obtaining 1,244,064 SNPs, 113,498 insertions, and 114,751 deletions (
Figure 3).
Figure 2. Venn diagram of genomic variants identified from genome comparison with the horse reference genome. In comparative analysis with the horse reference genome (Equus caballus, equCab3: January 2018), we screened the number of SNPs and INDELs to find unique variants shared with the five Jeju horses. The number of SNPs (a), small insertions (b), and deletions (c), which are common in the five Jeju horses compared with the horse reference genome, are annotated at each Venn diagram. The number of variants highlighted in the bold letter is common to Jeju horse. (a) For SNPs, common variants are 2,758,242 loci, which account for 22.54% of the total. (b) For small insertions, 233,819 loci, 33.63% of the total. (c) For small deletions, 240,738 loci, 31.5% of the total.
Figure 3. Second comparison of genomic variants between Jeju horse and Thoroughbred. Using the variants compared to the horse reference genes for the first time, secondly, we selected unique variants for the five Jeju horses by comparing and analyzing the genome data of one Thoroughbred obtained in this study. Through this process with another Thoroughbred genome, we were able to accurately distinguish the variant calling of Jeju horse. (a) Among the 2,758,242 SNPs identified from the first comparison, a total of 1,244,064 (45.1%) were unique in Jeju horse. (b) A total of 113,498 insertions (45.1%) and (c) 114,751 deletions (48.54%) were detected in Jeju horse.
Furthermore, Jeju horse-specific SNPs were compared with SNP data from open-access databases (dbSNP, Ensembl, and Broad Institute)
[18][
| 5’ UTR |
| 174 |
| 307 |
| 197 |
| 3’ UTR |
43 |
106 |
57 |
| Total |
94,192 |
135,348 |
75,115 |
2.2. Functional Annotation of Nonsynonymous
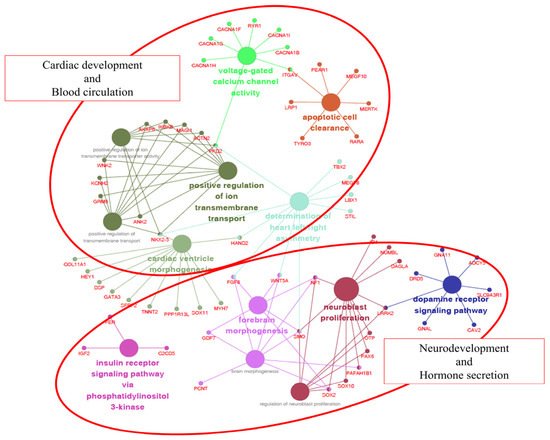
Among the numerous Jeju horse-specific SVs, we focused on nonsynonymous SNPs (724) and INDELs (564 insertions and 879 deletions) present in genic regions that may have a more functional impact. We performed GO term analysis using the ClueGO plugin of Cytoscape software
[19][15] on 788 genes containing 2167 SVs (nonsynonymous SNPs and INDELs). As a result, 106 out of 788 genes were correlated with 13 GO categories .
The 13 GO categories were mainly involved in cardiac development/blood circulation and neurodevelopment/hormone secretion. The reason why these two groups are characterized is probably due to the external differences between the Jeju horse and Thoroughbred horse. Thoroughbred horses have been gradually improved to be faster by humans. As a result, they have a body suitable for high speed, but their endurance was weakened. In contrast, Jeju horses are well known for their endurance. Due to these differences, we hypothesize that Jeju horses and Thoroughbred horses show significant differences in cardiac development/blood circulation and neurodevelopment/hormone secretion (
Figure 5). Interestingly, we found that 275 SNPs and 21 INDELs common in five Jeju horses exist in the eqCD1a6 gene (
Table 5).
Figure 5. Gene ontology (GO) enrichment analysis of genes with non-synonymous SNPs in Jeju horses. A total of 106 of 788 are significantly associated with cardiac development and blood circulation. Each term is represented by a circle node, where its size is proportional to the number of input genes falling into that term. Its color represents its GO cluster identity (i.e., nodes of the same color belong to the same cluster). The small nodes interacting with circle nodes denote the genes that show associations with the GO cluster.
Table 5. Classification of eqCD1a6 SNPs.
The function of the CD1 gene family is unknown, but recently it has been known to be involved in immunity to Rhodococcus equi. R. equi is associated with Mycobacterium tuberculosis and is structurally similar to the nocardioform actinomycete bacterium
[20][16]. M. tuberculosis is known as a cause of pulmonary tuberculosis in humans. In contrast, in young horses, R. equi is known to be a life-threatening pathogen that causes pyogranulomatous pneumonia
[21][17]. Previous studies have reported that most mammals have more than one isoform of the CD1 gene
[22][18]. In a previous study, 13 complete eqCD1 genes were identified in the horse genome, and they were largely divided into eqCD1a, eqCD1b, eqCD1c, eqCD1d, and eqCD1e. Among them, eqCD1a is the largest isoform group (eqCD1a1~eqCD1a7)
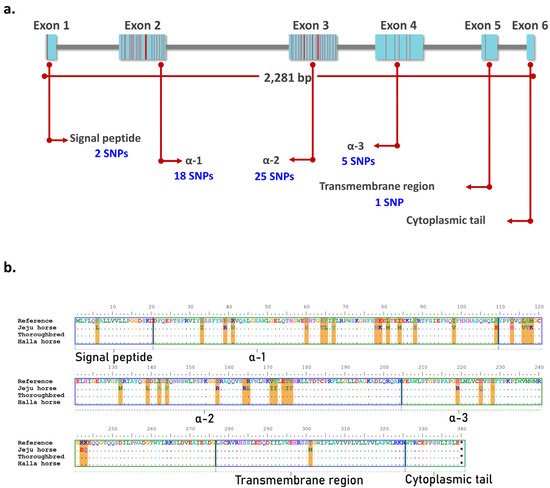
[23][19]. The eqCD1a6 gene is 2281 bp in length and consists of six exons that encode the signal peptide, α-1, α-2, α-3, the transmembrane region, and the cytoplasmic tail. Of the 275 SNPs identified in Jeju horses, 51 SNPs were located in the exon regions of eqCD1a6 and the most SNPs were found at Exon 2 and Exon 3 (18 and 25 SNPs, respectively) (
Figure 6). We compared the amino acid sequence of the eqCD1a6 of Jeju horses with its counterpart in the horse reference genome. As a result, the eqCD1a6 gene has accumulated 37 nonsynonymous changes, but no stop codons have been found. Most nonsynonymous changes occurred in α-1, α-2, and α-3 (14, 16, and 5 nonsynonymous substitutions, respectively) .
Figure 6. Amino acid (AA) sequence comparison of eqCD1A6 gene. Using BioEdit, eqCD1A6 sequences were visually compared to detect sequence signatures that distinguished between the two species. (a) The location of Jeju horse-specific SNPs in the exon region of the eqCD1a6 gene. Most of the SNPs are located in exon 2 and exon 3. (b) AA sequences of the eqCD1A6 gene searched by NCBI blast were aligned. Dots indicate AA sequences identical in nine eqCD1A6 isoforms. Orange lines denote the 37 conservative AA substitution spots in Jeju-horses. The eqCD1A6 protein domains, including the signal peptide, α-1, α-2, α-3, transmembrane, and cytoplasmic tail, are boxed with annotations.
32.3. Positive Selection of eqCD1a6 Gene in Jeju Horses
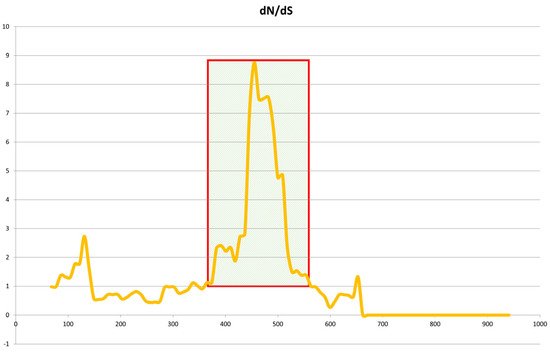
In order to confirm the correct Jeju horse-specific SNP of the eqCD1a6 gene, we used additional DNA samples of 35 horses (Jeju horse 15, Halla horse 3, and Thoroughbred (raised in Jeju Island) 17), which were used to PCR the exon region of eqCD1a6 and confirmed by Sanger sequencing. As a result, out of 51 SNPs, we identified 36 SNPs unique to Jeju horses, which most Jeju horse samples have in common in the Jeju horse genome. We conducted a dN/dS ratio analysis based on Jeju horse-specific SNP data
[24][20] (
Figure 7). The dN/dS ratios estimate the evolution rate by considering synonymous and nonsynonymous variations. The eqCD1a6 gene in Jeju horses appears to have been a positive selection to escape from the current stage when compared to Thoroughbred horses.
Figure 7. Sliding-window analysis of Jeju horse and Thoroughbred eqCD1a6 genes. Sliding-window analysis of dN/dS ratios was performed along the length of the eqCD1a6 gene, comparing Jeju horse and Thoroughbred gene sequences. dN/dS is plotted against base-pair coordinates in the coding sequence. dN/dS ratios of 1.0 indicate neutral evolution, while ratios of <1.0 are indicative of purifying selection.
2.4. Genotyping Assay for Molecular Markers
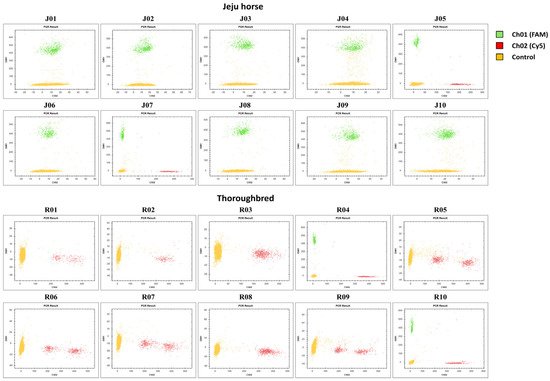
Korea is conducting pedigree management to protect species and manage individual Jeju horses, and species identification is performed through the appearance of Jeju horses and various genetic tests. However, sometimes inaccurate results are obtained because Jeju horse genome data are not compared with other Jeju horses. We proceeded with the development of a molecular marker. Based on the Jeju horse-specific CD1a6 obtained through the research results, we expected that the development of a species-specific molecular marker would enable a more accurate and faster test, and digital PCR was applied to this. Digital PCR has become accessible and easier to handle due to recent advances in technology and the diversification of equipment. The LOAA equipment used in this study is a semiconductor method that is different from the existing droplet digital PCR and has ultra-fast, ultra-light, ultra-compact, and ultra-sensitive features. We designed the probe and primer set based on the SNPs of the eqCD1a6 gene with the most variation between the Jeju horse and Thoroughbred. For the sample, 10 gDNA samples were used for each Jeju horse and Thoroughbred. As a result, it was shown that the unique aspect of the Jeju horse was confirmed through the molecular marker, and the accuracy reached 80% (
Figure 8)
Figure 8. A molecular marker was applied to Jeju horse and Thoroughbred samples in digital PCR assays. A schematic dot plot diagram showing the molecular marker result. The yellow cluster on the plot expresses the control droplets. The green cluster (FAM) and red cluster (SFC620) express the positive droplets for Jeju horse-specific and Thoroughbred-specific, respectively.
In this study, since only one probe was used, it showed an accuracy of 80%. However, we predict that designing Jeju horse-specific probes based on sequence information of various SNPs will be a more accurate species molecular marker. Based on these results, it is thought that this experimental method can be applied to various fields. Furthermore, if digital PCR is as easy to operate and lightweight as LOAA, it is expected that digital PCR is expected to be fully utilized in point of care testing (PoCT).
