Identifying patients at increased risk of coronary artery disease, before the atherosclerotic complications become clinically evident, is the aim of cardiovascular prevention. Imaging techniques provide direct assessment of coronary atherosclerotic burden and pathological characteristics of atherosclerotic lesions which may predict the progression of disease. Atherosclerosis imaging has been traditionally based on the evaluation of coronary luminal narrowing and stenosis. However, the degree of arterial obstruction is a poor predictor of subsequent acute events. More recent techniques focus on the high-resolution visualization of the arterial wall and the coronary plaques. Most acute coronary events are triggered by plaque rupture or erosion. Hence, atherosclerotic plaque imaging has generally focused on the detection of vulnerable plaque prone to rupture.
1. Introduction
Atherosclerosis is the primary cause of coronary artery disease (CAD)
[1][2][1,2]. The underlying pathophysiologic mechanisms develop and progress for decades before the disease becomes clinically evident. Traditionally, atherosclerosis imaging has focused on the assessment of arterial luminal narrowing and occlusion. However, most acute coronary events occur from atherosclerotic plaque rupture or erosion causing arterial thrombosis
[3]. The aim of performing imaging diagnostic tests is the assessment of patients at risk of acute coronary events associated with plaque formation, before atherosclerotic complications occur. This objective is based on the identification of coronary atherosclerotic burden, its extent and pathological characteristics which are closely associated with progression and rupture of vulnerable plaques.
The choice of imaging modality depends on the cardiovascular risk level of the patient. Non-invasive imaging is best suited in primary prevention for low- intermediate- risk population, in order to improve risk stratification and identify individuals who may benefit from intensive treatment. In high-risk patients, intravascular imaging provides accurate assessment of vulnerable plaques and early stage of their development.
2. Non-invasive imaging
2.1. Plaque Morphology
Non-invasive visualization of the morphology of coronary atherosclerotic lesions is performed using computed tomography (CT), computed tomography coronary angiography (CTCA), and cardiac magnetic resonance (CMR).
2.2. Computed Tomography (CT)
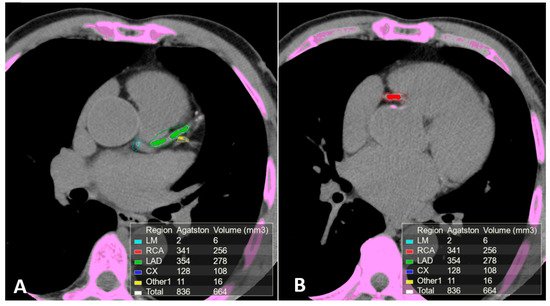
Non-contrast electrocardiographic (ECG)-gated multidetector CT provides a direct quantitative assessment of coronary artery calcium (CAC)
[4][44]. (
Figure 1). The standard method for CAC quantification is the Agatston score which measures the density of calcification in each coronary segment, multiplied by the area and summed for all arteries
[5][45]. CAC score correlates with the total coronary plaque burden and is an independent predictor for CV events irrespective of ages
[6][7][8][9][10][11][12][46,47,48,49,50,51,52]. Extensive calcification is associated with higher risk of CAD, because the presence of more plaques increases the chance that one may rupture. Current guidelines recommend CAC score assessment in individuals at low- to intermediate-risk in whom treatment decision may be improved by CV risk stratification
[13][14][15][16][53,54,55,56]. In individuals without known atherosclerotic disease, a CAC score of zero is associated with a high negative predictive value in excluding significant CAD
[17][57]. However, although only 5% of individuals with zero CAC have significant stenosis, low CAC scores do not exclude obstructive CAD
[17][18][19][57,58,59]. Instead, a CAC score >100 is associated with a risk of events similar to patients with previous CAD
[20][21][60,61].
Figure 1. Calcium scoring (CAC) performed on a non-contrast ECG-gated CT scan of a patient with coronary arteries calcifications using commercial software Vitrea 6.0. The software automatically highlights all the structures attenuating at least 130 Hounsfield units (pink). Regions of interest (ROI) were manually placed around the coronary arteries calcifications using different colors for each coronary segment. The partial and overall Agatston score and volume of the calcifications included in the regions of interest are summarized in the box on the bottom of the images. (A) Calcifications in the left main, anterior descending and 1st diagonal branch. (B) Calcification in the proximal segment of the right coronary artery.
The relevance of CAC in the prediction of acute events is also demonstrated by the observation that individuals free of clinical CAD and without conventional risk factors but elevated CAC have substantially higher rates of all-cause mortality than those who have multiple risk factors but no CAC
[22][62]. Also, combining CAC score and conventional risk factors carries significant sensitivity for prediction of >50% coronary stenosis which is higher than luminal stenosis measured by CTCA
[8][48]. The relationship of the Agatston score with subsequent coronary events appear to be mainly based on the volume component of the CAC score, while calcification density has an inverse relationship with risk of CAD
[23][24][25][26][63,64,65,66]. Since CAC density refers to the concentration of calcium in the plaques, this inverse relationship may reflect the protective role of stable macrocalcifications. Serial coronary CT for the assessment of the effects of treatment is now feasible due to rapid advances in image reconstruction that have substantially reduced the radiation dose without compromising the imaging quality
[27][67]. Although calcified plaque burden assessment is important in identifying the subclinical phase of CAD, CT calcium scoring does not quantify the burden of non-calcified and unstable plaques nor coronary stenosis.
2.3. Computed Tomography Coronary Angiography (CTCA)
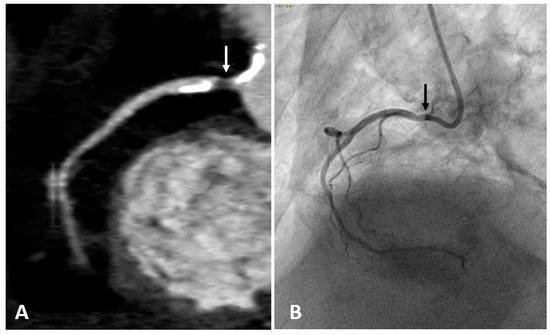
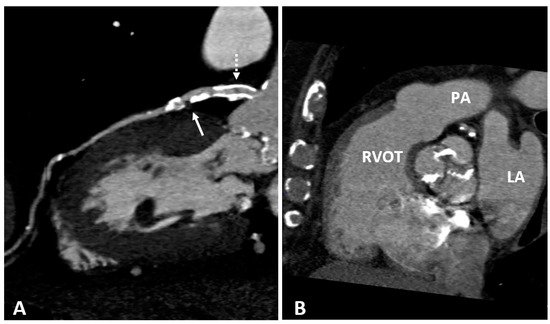
The intravenous administration of iodine contrast media allows the assessment of coronary stenosis and several adverse coronary plaque characteristics, such as spotty calcification, positive remodeling, and low-attenuation non-calcified plaques which identify a large necrotic core
[28][29][68,69]. (
Figure 2 and
Figure 3). However, smaller components such as microcalcifications and TCFA cannot be detected because their dimension is ten times lower than the spatial resolution of CTCA (about 500 microns)
[30][70].
Figure 2. Right coronary artery (RCA) studied with CTCA (A) and with coronary angiography (B) in the same patient. Both examinations show a narrowing of the arterial lumen in the proximal RCA segment (arrows), indicating the presence of an atherosclerotic plaque. CTCA imaging shows a low-attenuation non-calcified plaque which identifies a lipid or necrotic core. Calcifications are hyperdense on CTCA, while not visible on coronary angiography.
Figure 3. (A) CTCA showing the left main (LM) and left anterior descending (LAD) coronary arteries of a patient who underwent coronary angioplasty (PTCA) and stent positioning in the LM. A non-calcified low density soft plaque (white arrow) is shown between calcific plaques; the hypodense spot (dashed white arrow) within the stent may indicate initial intrastent restenosis. Calcification of the aortic valve leaflets. (B) CTCA of the same patient reformatted in the plane of the aortic valve shows calcification of the aortic leaflets. RVOT: right ventricle outflow tract; LA: left atrium; PA: pulmonary artery.
CTCA is mainly appropriate for symptomatic moderate-risk patients without known CAD
[31][71]. A negative CTCA is associated with very low risk of coronary events (negative predictive value about 99%)
[32][33][34][72,73,74]. Hence, the test is appropriate to rule-out significant CAD, thus reducing the need for invasive tests. Compared to intravascular ultrasound (IVUS), CTCA has excellent correlation for coronary luminal and plaque area
[35][36][75,76]. The prognostic value of obstructive compared to non-obstructive CAD has been assessed with CTCA, showing that it is the extent of disease, regardless of whether obstructive or non-obstructive, that provides additional prognostic value
[37][77]. Indeed, patients with non-obstructive CAD who had extensive disease, showed similar rates of acute events as those with obstructive but less extensive disease.
Compared to conventional angiography, CTCA has been reported to have higher accuracy in identifying calcified and non-calcified plaques, and coronary positive remodeling
[38][39][78,79]. While more than 95% of arterial stenosis documented with angiography are confirmed by CTCA, only one-third of those detected with CTCA are identified by angiography.
The relationship between morphological plaque characteristics and patient clinical presentation has been investigated with CTCA in three population groups with different cardiovascular risk
[40][80]. Plaque volumes and the proportion of necrotic core progressively increased with worsening risk profile, while the proportion of densely calcified plaques reduced. These observations seem to confirm that individuals with high clinical risk profile are associated with potentially unstable lesions, while those with low-risk are associated with greater proportion of calcified and more stable plaques
[28][68].
2.4. Cardiac Magnetic Resonance (CMR)
CMR provides non-invasive accurate soft tissue contrast imaging, visualization of coronary lumen and arterial wall, atherosclerotic disease burden, plaque composition and activity
[41][42][81,82]. Coronary atherosclerosis characterization by CMR is based on electromagnetic signal intensity from protons in free water, triglycerides and free fatty acids in a strong magnetic field. Morphologic appearance of the atherosclerotic lesions depends on their free water concentration. Because calcification does not contain free water, densely calcified plaques appear as dark region on CMR. In contrast, plaques with low CT density, usually associated with vulnerable features, appear with high intensity on MR.
Non-contrast enhanced CMR can identify some vulnerable plaque characteristics, such as vascular remodeling, inflammation, and intra-plaque hemorrhage due to high T1 weighted signal which is associated with methaemoglobin, a key constituent of acute coronary thrombus
[43][83]. While high-intensity intracoronary signals have been associated with early thrombus formation, high-intensity intra-wall signals have been related to the presence of macrophages and lipid-rich plaques, validated by intravascular imaging
[44][84]. Contrast enhanced CMR based on gadolinium contrast agent provides better spatial resolution (CMR angiography). Also, the accumulation of gadolinium in the arterial wall is associated with increased endothelial permeability and inflammation
[45][85]. CMR has also been able to assess significant coronary stenosis with a high negative predictive value
[46][47][48][86,87,88]. However, the limited spatial resolution (1.3–1.8 mm with most current techniques), may limit the diagnostic use of CMR in clinical practice, whereas it has important research interest for future application. CMR has been recently combined with positron emission tomography (PET) for the simultaneous assessment of anatomic details and disease activity
[49][50][89,90]. This hybrid PET/MR system has lower level of radiation exposure compared to PET/CT, thus allowing to monitor the progression of chronic atherosclerosis over time.
3. Disease Activity Imaging
Positron Emission Tomography (PET)
Although structural imaging techniques provide an assessment of the plaque burden, they give no indication as to the extent of inflammatory plaque activity. Hence, they cannot accurately distinguish between patients with stable disease from those with increased disease activity, expressed by macrophages and microcalcifications which are associated with increased risk of developing acute CV events. Nuclear imaging such as PET can visualize different components of the atherosclerotic process, thus providing a highly sensitive assessment of coronary disease activity
[51][91]. Specific radioactively labelled tracers targeted to pathological components of the atherosclerotic process, such as macrophages (
18F-fluorodeoxyglucose and 68-Gallium-dotatate targeting the somatostatin receptor on the surface of macrophages) and microcalcification (
18F-sodium fluoride), accumulate at sites of increased disease activity, releasing radiation which are detected by the PET scanner
[43][83]. However, PET imaging has limited anatomic definition and needs to be combined with an anatomic imaging modality, such as CT or MR to provide simultaneous assessment of disease activity and morphological information. Hybrid imaging systems that incorporate PET with CT or MR scanners within the same gantry, provide simultaneous imaging combining the molecular specificity of PET imaging with the anatomic and functional characterization provided by CT or MR
[52][53][92,93].
18F-fluorodeoxyglucose (
18F-FDG) is a glucose analogue which is extensively used for malignancy staging a marker of metabolic activity. Its uptake by macrophages has been recently used to image vascular inflammation because the glucose metabolic activity of the macrophages involved in the atherosclerotic plaque is higher than the surrounding cells
[54][94]. While
18F-FDG PET has been most investigated in the carotid arteries and aorta, its use in the assessment of coronary plaque inflammation is limited by the close proximity to myocardial tissue which has a high affinity to tracer uptake due to its high glucose metabolism. This obscures the coronary visualization, thus limiting accurate plaque analysis, and require a special patient preparation to minimize the myocardial glucose uptake
[41][81].
18F-sodium fluoride (
18F-NaF) has been originally studied to identify bone metastasis and is now used to visualize coronary calcification
[55][95]. Fluoride ions are incorporated into hydroxyapatite which is a central component of the osteogenic mineralization
[51][91]. Coronary atherosclerosis is strongly associated with macrophages osteogenic activity in the early stages of atherosclerosis, which results in microcalcifications found in the lipid-rich necrotic core of atherosclerotic plaques. This allows
18F-NaF to detect active microcalcification which are beyond the resolution of CT scan. The stronger affinity of the radiotracer with newly formed hydroxyapatite compared to the old crystals makes it possible to distinguish between actively inflamed coronary calcifications from stable ones. This is confirmed by the observation that large areas of coronary calcium detected by CT scan do not show increased
18F-NaF uptake. Conversely, regions with absent or minimal CT calcium demonstrate intense
18F-NaF uptake
[56][96]. The preferential binding of
18F-NaF uptake to microcalcification is also explained by high surface area of hydroxyapatite in microcalcifications compared to large macroscopic calcifications where hydroxyapatite is internalized and not available for binding
[57][97]. This discordance between morphologic and nuclear imaging provide complementary information and may improve differentiating stable from vulnerable plaques
[58][59][98,99].


