Your browser does not fully support modern features. Please upgrade for a smoother experience.
Please note this is a comparison between Version 2 by Lily Guo and Version 1 by Joselito Quirino.
Alkenylbenzenes are potentially toxic (genotoxic and carcinogenic) compounds present in plants such as basil, tarragon, anise star and lemongrass. These plants are found in various edible consumer products, e.g., popularly used to flavour food. Thus, there are concerns about the possible health consequences upon increased exposure to alkenylbenzenes especially due to food intake. It is therefore important to constantly monitor the amounts of alkenylbenzenes in our food chain.
- alkenylbenzenes
- food
1. Introduction
Throughout human history, plants and their constituents have been used as a source of medicine [1]. The availability and health benefits of plants also allow them to become part of the common human diet; thus, they are found as ingredients in many foods and food/health supplements [2]. However, not all chemicals in plants (phytochemicals) are associated with positive health effects and many of these natural chemicals are potentially toxic. Rietjens, et al. [3] have listed out several phytochemicals that are (or potentially) toxic such as aristolochic acids, pyrrolizidine alkaloids, coumarin, ephedrine alkaloids, synephrine, kavalactones, β-carotene, anisatin, solanine, chaconine, thujone, cyanogenic glycosides and glycyrrhizinic acid. The focus of this review is on the alkenylbenzenes (especially the carcinogenic and genotoxic alkenylbenzenes) that are naturally found in many plants and used in food and food/health related products. A brief introduction and importance of the different aspects of analytical methods for their determination will be highlighted.
Alkenylbenzenes are present in many edible consumer products including spices, plant food supplements and herbal medicines. The most common spices containing alkenylbenzenes are anise star, basil, black pepper, cinnamon, coriander, dill, nutmeg, parsley and tarragon. In particular, estragole is present in significant amounts in fennel [4] while methyleugenol in basil and nutmeg [5]. These spices are used in alcoholic and non-alcoholic beverages, and in preparing baked goods and sweets [6]. Safrole in particular is known for its ‘candy shop’ aroma [7,8][7][8].
The alkenylbenzenes apiol, elemicin, estragole, methyleugenol, myristicin, and safrole have been considered toxic [9,10,11,12][9][10][11][12] (structures are shown in Figure 1). Safrole had been prohibited in the US since 1960 while estragole and methyleugenol are currently being revaluated as safe (generally recognised as safe status). In addition, in the light of exposure estimates from all sources, the European Union (EU) Scientific Committee on Food (EU-SCF) concluded that estragole, methyleugenol and safrole fall in the priority for risk management and are considered genotoxic and carcinogenic. Therefore, restrictions on using these compounds as food additive is in place [9,10,11][9][10][11]. Nevertheless, there have been reports that some foods and beverages contain levels higher than the maximum levels of safrole. For example, cola beverages may contain up to 4.5 mg/kg of safrole, which is 4× the EU maximum level [7,8][7][8]. The EU maximum level is 1 mg/kg of safrole in foods and beverages. In the case of methyleugenol and estragole, the EU-SCF cannot establish their exposure limits on food [9,11][9][11]. Clearly, more studies are required to clarify exposure limits which will influence legal regulations of these phytochemicals.
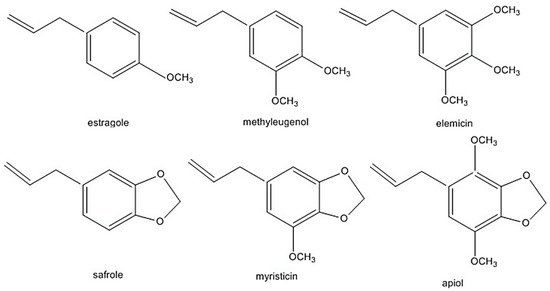
Figure 1.
Alkenylbenzenes that are genotoxic and carcinogenic. Reprinted with permission from the Authors [13].
All phytochemicals are possibly toxic and large doses can lead to poisoning effects [3]. Chemical risk assessment aims to quantify chemical exposures from food for a given human population. It then determines safe chemical levels and quantifies the risk associated with the exposures. An essential aspect of chemical risk assessment is to obtain dependable occurrence data on the phytochemicals in food. Occurrence data relies on the availability and reliability of analytical methods that can handle complex food matrices and quantify the phytochemicals at mostly low concentration levels. The objective of this review is to discuss the background and applications of the analytical methods (sample preparation and separation) used for the determination of alkenylbenzenes, especially in foods and related products.
To conduct a comprehensive research on alkenylbenzenes studies, Scopus database was used. The search parameter involved different sets of keywords “alkenylbenzenes”, “methyleugenol”, “myristicin”, “estragole”, “safrole” and “analytical separation technique”, and the year of publication was limited between 2010 to 2020. Liquid chromatography (LC), gas chromatography (GC) or capillary electrophoresis (CE) are the analytical separation techniques. There were >20 research papers, and most papers were on GC and LC. The latest study conducted using CE was in 2008, which was also included in this review. Sample preparation is an important step in the analysis, thus the extraction and clean-up methods reported in the considered papers were categorised and discussed. For GC, these were liquid- liquid extraction (LLE), liquid-phase microextraction (LPME), Quick Easy Cheap Effective Rugged Safe (QuEChERS), distillation (steam and hydro-), and solid phase extraction (SPE). Interestingly, only solvent extraction (primarily with methanol) was reported in combination with HPLC.
2. Gas Chromatography
2.1. Analysis
Gas chromatography was invented in 1952 by A. T. James and A. J. P. Martin. GC is a simple and fast analytical separation technique that is applicable to many volatile compounds (with high vapour pressure at temperature below 350 °C to 400 °C) such as alkenylbenzenes [14]. It utilises solid or liquid as stationary phase and gas as mobile phase. A typical gas chromatography system consists of carrier gas (mobile phase), injector, GC column (stationary phase), detector and data system. GC operates by injecting a sample into one end (inlet) of the column. The mobile phase is passed through the inlet and carries the sample onto the column. The separation occurs while the sample travels through the column, which is temperature controlled. When the sample exits the column, it enters the detector where it produces an electronic signal [15]. The results are plotted in a so-called chromatogram.
Table 1 summarizes the papers that used GC for the determination of alkenylbenzenes in different foods and related samples. The amount of alkenylbenzenes found in sample/s, sample preparation method, GC conditions, detector used, and references were included in the table. Flame ionisation detector (FID) and mass spectrometry (MS) are the dominant detectors for quantitation. FID has several advantages such as high sensitivity, low noise level and a wide linear range. However, FID cannot unambiguously identify the peaks in GC chromatograms or distinguish components in overlapping peaks [16]. On the other hand, MS is a very powerful detector as it can be used to identify the alkenylbenzenes at a molecular level.
Table 1. Application of GC for the determination of alkenylbenzenes.
| Alkenylbenzenes | Sample/s | Sample Preparation | Amount of Alkenylbenzenes Found in Sample/s | GC Conditions | Detector | Ref. |
|---|---|---|---|---|---|---|
| myristicin elemicine cis-isosafrole borneol caryophyllene |
Chinese Ainsliacea fragrans Champ ex Benth | hydrodistillation | myristicin (41.3%) elemicine (11.9%) cis-isosafrole (11.5%) borneol (9.1%) caryophyllene (8.8%) - % values were the % found in the extracted essential oil - the essential oil was 0.06% v/w of sample |
column:HP-5, 5% diphenyl and 95% dimethylpolysiloxane, 30 m × 0.25 mm × 0.25 µm program:initial temperature at 60 °C hold for 1 min, ramp to 180 °C (10 °C/min), hold for 1 min, ramp to 280 °C (20 °C/min), hold for 15 min. carrier gas:helium, 1 mL/min injection:split, 1:10, 1 µL, 270 °C run time: 34.0 min LOD: not reported LOQ: not reported |
FID | [22] |
| safrole apiol myristicin |
essential oils from Vietnam | hydrodistillation | safrole (38.1%) apiol (10.8%) myristicin (8.0%) - % values were the % found in the extracted essential oil - the essential oil was 0.2% v/w of sample |
column: SE-52 capillary column, 50 m × 0.25 mm × 1.0 µm program: 60 °C for 1 min, heating to 230 °C (3 °C/min), hold for 12.3 min carrier gas: helium, 1.5 mL/min injection:split/splitless, 1:100, 0.1 µL, 230 °C run time: 70.0 min LOD:not reported LOQ:not reported |
FID | [23] |
| eugenol methyleugenol |
holy basil essential oils | hydrodistillation | eugenol (37–45%) methyleugenol (65%) - % values were the % found in the extracted essential oil - the essential oil was 7.9 ± 3.2 mg/g of sample |
column:HP-5 fused silica capillary, 5% phenyl methylpolysiloxane, 30 m × 0.32 mm, 0.25 µm program:initial temperature 50 °C held for 5 min, increase to 120 °C (3 °C/min), to 250 °C (5 °C/min), to 300 °C (15 °C/min) and hold for 5 min. carrier gas:helium, 25 mL/min injection: split, 50:1, 250 °C run time: 62.6 min LOD: 0.21 µg/mL LOQ: 0.54 µg/mL |
FID | [18] |
| MS for identification only | column:HP-5 MS fused-silica capillary column, 5% phenyl methylpolysiloxane, 30 m × 0.25 mm i.d × 0.25 µm program:50 °C for 5 min, increase to 120 °C (3 °C/min), to 250 °C (5 °C/min), hold for 0.67 min. carrier gas:helium, 25 mL/min injection:split, 50:1, 1 µL, 250 °C run time:55.0 min LOD:not reported LOQ:not reported |
MS | ||||
| eugenol estragole |
Ocimum species | hydrodistillation | eugenol (566.8 ± 98.0 mg/g–859.3 ± 151.3 mg/g) estragole (448.8 ± 126.8 mg/g–640.2 ± 44.8 mg/g) |
column: RTX-5 column, methylpolysiloxane, 30 m × 0.25 mm × 0.25 µm program:initial temperature at 70 °C, heating ramp up to 180 °C (4 °C/min), ramp at 250 °C (10 °C/min) carrier gas:nitrogen, 1 mL/min injection:split, 1:30, 1 µL, 250 °C run time:34.5 min LOD:1.2 µg/mL LOQ:not reported |
FID | [17] |
| MS was used for identification only | column:HP-5MS column, methylpolysiloxane, 30 m × 0.25 mm × 0.25 µm program:initial temperature at 70 °C, heating ramp up to 180 °C (4 °C/min), ramp at 250 °C (10 °C/min) carrier gas: helium, 1 mL/min injection: split, 1:100, 1 µL, 250 °C run time: 34.5 min LOD: not reported LOQ: not reported |
MS | ||||
| 16 alkenylbenzenes | essential oils | not described | different % values of alkenylbenzenes in 23 essential oils | column: capillary column 30 m × 0.32 mm × 0.25 µm program:hold at 40 °C for 2 min, increase from 40 °C to 200 °C (10 °C/min), to 300 °C (20 °C/min). carrier gas: nitrogen, 2.1 mL/min injection:split, 1:50, 300 °C run time: 31.0 min LOD:not reported LOQ:not reported |
FID | [19] |
| human serum | not described | eugenol (222 ± 34 ng/mL), geraniol (6.18 ± 0.67 ng/mL), methyleugenol (0.74 ± 0.08 ng/mL), cis-isoeugenol (1.87 ± 0.69 ng/mL), acetyl eugenol (30.2 ± 11 ng/mL), myristicin (12.8 ± 1.6 ng/mL) after administration of clove essential oil cream | ||||
| essential oils and human serum | not described | MS was used for identification only | column:DB-5 fused silica capillary column, 5% phenyl methylpolysiloxane, 30 m × 0.25 mm i.d × 0.25 µm program:increase from 45 °C to 250 °C (5 °C/min) carrier gas:helium, 0.82 mL/min injection: not reported run time:41 min LOD: not reported LOQ: not reported |
MS | ||
| methyleugenol | Cymbo-pogon khasia-nus Hack. | hydrodistillation | methyleugenol (73.2%) - % values were the % found in the extracted essential oil - the essential oil was 0.73% v/w of sample |
column: HP-5 fused silica capillary, 30 m × 0.25 mm × 0.25 µm program:initial temperature at 40 °C, hold for 2 min, increase to 250 °C (5 °C/min), to 300 °C (30 °C/min), hold for 10 min carrier gas: helium, 1 mL/min injection:split, 1:20, 1 µL, 250 °C run time:55.7 min LOD:not reported LOQ:not reported |
MS | [24] |
| methyleugenol | Melaleuca alternifolia oils | solvent dilution | methyleugenol (160.0 µg/mL–552.0 µg/mL) | column: Varian Factor Four VF-5, 30 m × 0.25 mm × 0.25 µm program: 130 °C to 180 °C (15 °C/min), increase to 230 °C (30 °C/min), hold for 4 min carrier gas:helium, 1.2 mL/min injection:split, 7:1, 1 µL, 240 °C run time:9.0 min LOD: 150 ppb LOQ: 500 ppb |
MS | [25] |
| anethole estragole eugenol methyleugenol safrole myristicin |
aroma-therapy massage oil products | dispersive liquid-liquid microextraction (DLLME), dual DLLME | anethole (up to 862.1 µg/g) estragole (up to 0.7 µg/g) eugenol (0.5 µg/g–851.5 µg/g) methyleugenol (0.1 µg/g–0.5 µg/g) safrole (up to 0.2 µg/g) myristicin (up to 0.7 µg/g) |
column:VF-5MS fused silica capillary column, 30 m × 0.25 mm × 0.25 µm program:initial temperature at 90 °C for 1 min, ramp to 130 °C (40 °C/min), ramp to 137 °C (3.5 °C/min), ramp to 139.4 °C (0.3 °C/min), ramp to 280 °C (70 °C/min), hold for the remaining time carrier gas: helium, 2 mL/min injection: split, 10:1, 1 µL, 260 °C run time: 16.0 min LOD: 1.0–3.0 ng/mL LOQ: 2.5–10.0 ng/mL |
MS | [26] |
| eugenol methyleugenol |
Ocimum micran-thum | hydrodistillation | eugenol (12%) methyleugenol (14%) of the total area in the chromatogram of the distillate |
column: ZB-5HT INFERNO, 5% phenyl 95% polydimethylsiloxane, 30 m × 0.25 mm i.d × 0.25 µm program: 60 °C to 68 °C (0.7 °C/min), hold for 7 min, increase to 100 °C (10 °C/min), to 130 °C (5 °C/min), hold for 7 min, to 135 °C (1 °C/min) and hold for 6 min carrier gas:helium, 1 mL/min injection:split, 1:100, 1 µL, 280 °C run time: 45.6 min LOD: not reported LOQ:not reported |
MS | [21] |
| estragole eugenol |
basil species and pot cultures | steam distillation | estragole (2.3 mg/mL in Lettuce Leaf) eugenol (1.2 mg/mL in Mammolo Genovese, 0.4 mg/mL in Manes) |
column: DB-WAX, 30 m × 0.25 mm × 0.25 µm program: 40 °C for 3 min, increase to 60 °C (8 °C/min), to 70 °C (5 °C/min), to 230 °C (4 °C/min), keep for constant for 1 min. carrier gas: helium, 0.5 mL/min injection:split, 1:100, 1 µL, 240 °C run time:48.5 min LOD:0.0085 mg/mL (estragole), 0.0063 mg/mL (eugenol) LOQ:0.0118 mg/mL (estragole), 0.0066 mg/mL (eugenol) |
MS | [27] |
| estragole methyleugenol safrole |
food and beverage samples | QuEChERS | estragole (0.7 mg/kg–5.2 mg/kg in fish samples) methyleugenol (0.6 mg/kg–3.3 mg/kg in bakery, meat, dairy and vegetable samples) safrole (up to 2.4 mg/kg in butter with spices sample) |
column: REStek Rtx®- CLPesticides, 30 m × 0.25 mm × 0.25 µm program: 60 °C for 1 min, increase to 80 °C (50 °C/min), to 125 °C (3 °C/min), to 300 °C (10 °C/min), hold for 5 min carrier gas: helium, 1 mL/min injection: splitless, 1 µL, 250 °C run time: 38.9 min LOD:not reported LOQ: 0.05 mg/kg (non-alcoholic beverages), 0.5 mg/kg (other food matrices) |
MS | [28] |
| methyleugenol estragole |
Anthriscus cerefolium L. Hoffm |
hydrodistillation | methyleugenol (47.2% in El-Sharkia essential oil) El-Sharkia essential oil is 0.075–0.083 mL/plant estragole (18.0% in El-Fayoum essential oil) El-Fayoum essential oil is 0.12–0.16 mL/plant |
column: TG-WAX, 30 m × 0.25 mm × 0.25 µm program: 40 °C for 1 min, increase to 160 °C (4 °C/min), hold for 6 min, increase to 210 °C (6 °C/min), hold for 1 min. carrier gas: helium, 1 mL/min injection: split, 1:10, 0.2 µL, 210 °C run time: 46.3 min LOD: not reported LOQ: not reported |
MS | [29] |
| eugenol isoeugenol methyleugenol |
fish fillet | solvent extraction and solid phase extraction (SPE) | eugenol (259.0 µg/kg–2329.0 µg/kg) isoeugenol (86.2 µg/kg–1032.0 µg/kg) methyleugenol (not found) |
column:DB-17 capillary column, 30 m × 0.25 mm × 0.25 µm program:initial temperature at 80 °C, hold for 2 min, increase to 220 °C (25 °C/min) and hold for 1 min, increase to 280 °C (30 °C/min), hold for 1 min carrier gas: helium, 2 mL/min injection:split, 1 µL, 260 °C run time:11.6 min LOD: 0.4 µg/kg (eugenol), 1.2 µg/kg (isoeugenol), 0.2 µg/kg (methyleugenol) LOQ: 1.2 µg/kg (eugenol), 4 µg/kg (isoeugenol), 0.7 µg/kg (methyleugenol) |
MS | [30] |
| methyleugenol | food samples | QuEChERS | methyleugenol (6.1 ± 0.4 mg/kg) | column: DB-1 capillary column, 30 m × 0.25 mm × 0.25 µm program: 70 °C for 1 min, increase to 120 °C (40 °C/min), to 180 °C (8 °C/min), hold for 1 min, to 280 °C (40 °C/min) and hold for 1 min carrier gas: not reported injection:splitless, 2 µL, 280 °C run time: 14.3 min LOD:20 µg/kg (solid/semi-solid food samples), 0.4 µg/kg (beverages) LOQ: 50 µg/kg (solid/semi-solid food samples), 1 µg/kg (beverages) |
MS | [31] |
| methyleugenol estragole |
food samples | liquid-liquid extraction | methyleugenol (4288.0 mg/kg for allspice pimento, 1351.0 mg/kg for nutmeg and n.d–1184.0 mg/kg for basil) estragole (not reported) |
column: HP-Innowax, fused silica capillary column, 41 m × 0.25 mm × 0.25 µm program: 40 °C for 1 min, increase to 200 °C (8 °C/min), hold for 5 min carrier gas: helium, 1 mL/min injection:split, 1:5, 1 µL, 240 °C run time: 26.0 min LOD: 2.1 mg/L (methyleugenol), 1.3 mg/L (estragole) LOQ: 5.3 mg/L (methyleugenol), 4.7 mg/L (estragole) |
MS | [32] |
| estragole tr-anethole safrole eugenol tr-iso-eugenol acetyl eugenol methyleugenol myristicin |
pepper and its varieties | ultrasound-assisted extraction | estragole (2.2 mg/kg–45.7 mg/kg) tr-anethole (10.7 mg/kg–42.7 mg/kg) safrole (0.2 mg/kg–3.0 mg/kg) eugenol (10.5 mg/kg–120.0 mg/kg) tr-iso-eugenol (0.7 mg/kg–3.6 mg/kg) acetyl eugenol (45.8 mg/kg in red pepper) methyleugenol (0.5 mg/kg–20.1 mg/kg) myristicin (0.2 mg/kg–6.1 mg/kg) |
column: BP5MS capillary analytical, 30 m × 0.25 mm × 0.25 µm program:initial temperature at 70 °C (3 min), increase from 70 °C to 250 °C (10 °C/min) then increase to 280 °C (50 °C/min) and maintain for 3 min carrier gas: helium, 1 mL/min injection:splitless, 2 µL, 280 °C run time: 24.6 min LOD:0.02 mg/kg (estragole), 0.02 mg/kg (trans-anethole), 0.01 mg/kg (safrole), 0.01 mg/kg (eugenol), 0.01 (trans-iso-eugenol), 0.01 mg/kg (acetyl eugenol), 0.01 mg/kg (methyleugenol), 0.01 mg/kg (myristicin) LOQ:0.2 mg/kg (estragole), 0.2 mg/kg (trans-anethole), 0.2 mg/kg (safrole), 0.2 mg/kg (eugenol), 0.2 (trans-iso-eugenol), 0.2 mg/kg (acetyl eugenol), 0.2 mg/kg (methyleugenol), 0.2 mg/kg (myristicin) |
HRMS-Q-Orbitrap | [20] |
For high-sensitivity analysis with confident identification of alkenylbenzenes, a few studies combined FID with MS [17,18,19][17][18][19]. Meanwhile, Rivera-Pérez, et al. [20] developed a GC method with high-resolution mass spectrometry (HRMS) and Q-Orbitrap. They believed HRMS was highly accurate and allowed retrospective analysis. It can elucidate unknown components in complex matrices due to its highly sensitive full-scan mode. In addition, Q-Orbitrap was able to separate isobaric compounds. They concluded that GC with HRMS and Q-Orbitrap enabled post-targeted analysis of other alkenylbenzenes compounds without having to reanalyse them.
In terms of GC conditions (see Table 1), majority of studies used helium as the carrier gas and only one study used nitrogen. Vaporisation injection with temperatures between 230 °C to 300 °C were implemented. Open-tubular capillary columns that provided high separation performance were used rather than packed columns. The open-tubular capillary column was fused silica with inner diameter of 0.25–0.32 mm. The inner surface of a capillary was coated with a stationary phase with film thickness of 0.1–5 µm. The stationary phases varied in polarity, non-polar to highly polar. A nice example is the work of Caamal-Herrera, et al. [21], where they used a ZB-5HT INFERNO column coated with 5% phenyl 95% polydimethylsiloxane. The GC chromatogram of the essential oil of Ocimum micranthum Willd leaves using this mid-polar coated stationary phase is shown in Figure 2. The targeted alkenylbenzenes eugenol and methyleugenol was successfully separated from the other components in the multi-component essential oil with high separation efficiencies and sharp peaks.
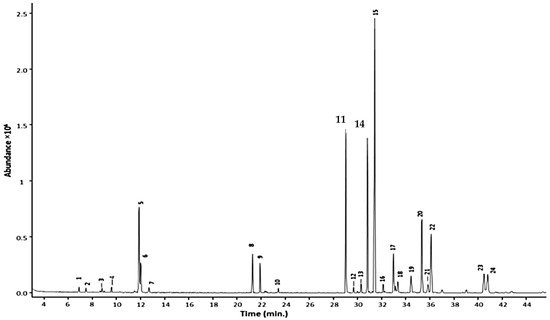
Table 1. Application of GC for the determination of alkenylbenzenes.
Figure 2.
GC chromatogram of Ocimum micranthum Willd leaves’ essential oil obtained with a capillary column coated with a mid-polar stationary phase 50%-phenyl-methylpolysiloxane. Peaks: eugenol (11); methyleugenol (14). Reprinted with permission from the Authors [21].
2.2. Sample Preparation
In GC, the sample is vaporised and injected into a port at the head of GC column. Food samples are not amenable to directly injection into GC columns; therefore, sample preparation is essential prior to analysis. The aim of sample preparation is to alter the sample to a form that is suitable for final chemical analysis. The number of steps in the sample preparation method depends on the concentration of the analyte in the sample, complexity of the sample, and the limit of quantitation (LOQ) and linear range of the analytical separation method (e.g., GC). Some of the earliest sample preparation methods is simple dilution and extraction (e.g., liquid-liquid extraction (LLE)). In the case of extraction, this method allows the analyte of interest to be extracted from a sample matrix with optimum yield and selectivity [33][22]. A multiple of techniques have been used for the sample preparation of alkenylbenzenes in variety of foods and related products prior to GC analysis. These include solvent dilution/extraction, LLE, LPME, SPE, QuEChERS, and distillation (steam and hydro-).
2.2.1. Solvent Dilution/Extraction
Addition of an appropriate solvent to the sample is the simplest way for sample preparation prior to GC analysis. For example, hexane was used as dilution solvent in the determination of methyleugenol in tea tree oils. To 5 µL of oil in 2 mL GC vials, 1 mL of n-hexane and 50 mg/L internal standard (IS) (n-tetradecane) were added and mixed thoroughly prior to measurement [25][23]. Meanwhile in another study, hexane was used as extraction solvent in the determination of methyleugenol, eugenol and isoeugenol in fish fillets [30][24]. However, due to the complexity of the extracts, further sample preparation (clean-up) by solid phase extraction (SPE) was implemented.
The use of ultrasound is known to be useful in diminishing the cost of processing and handling time in the food and chemistry industry. Ultrasound is also a key player in achieving the objective of green chemistry especially in extractions [34][25]. In ultrasound assisted solvent extraction, the ultrasonic energy passes through a liquid solvent containing the sample in the form of waves. When the waves hit the sample’s surface, it generates a perpendicular or parallel force to the surface. Sonic energy is converted to mechanical energy and presented in the form of shock waves equivalent to several thousand atmospheric pressure. The rapid localised surge in pressure and temperature contributes improved migration of the solvent into the sample. This results in the improved extraction of the analytes [35][26].
In a recent study for the determination of eight alkenylbenzenes (eugenol, methyleugenol, acetyl eugenol, trans-isoeugenol, safrole, estragole, myristicin and trans-anethole) in pepper and its varieties using GC, a solvent extraction aided by ultrasound was developed. Ethyl acetate (AcOEt) was chosen as extraction solvent because it was suitable for the extraction of non-polar alkenylbenzenes. The procedure was very straightforward, a weighed sample (1 g), AcOEt (20 mL) and dicyclohexylmethanol (10 µL, internal standard) was sonicated at 37 kHz for 45 min at room temperature in an ultrasonic bath. After centrifugation at 3700 rpm (5 min), an aliquot of the AcOEt supernatant was subjected to GC analysis. The mean recovery reported was acceptable in the range of 70% to 120% [20].
2.2.2. LLE
LLE is widely used to transfer an analyte from an aqueous matrix into an extraction solvent. The aqueous matrix and extraction solvent should be immiscible or partially miscible with each other so that the two solvents can be separated easily. Moreover, the analytes from the aqueous matrix should be soluble in the extraction solvent and ideally exhibit high partition coefficients in the solvent. The common extraction solvents used are dichloromethane, chloroform, n-butyl chloride, hexane and toluene [36][27]. An example of an LLE procedure was in the quantification study of methyleugenol in 120 food samples including basil, laurel, tarragon, allspice, nutmeg, lemongrass, cinnamon and anise [32][28]. In this work, 60% ethanol (that showed highest extraction efficiency) was used as aqueous matrix and methyl tert-butyl ether (MTBE) was used as extraction solvent. Three extraction solvents used for evaluation were 1,1,2-trichloro-1,2,2-trifluoroethane, n-hexane and MTBE. MTBE and 1,1,2-trichloro-1,2,2-trifluoroethane showed a similar extraction behaviour (about 90% at first extraction), whereas n-hexane had a lower yield (about 65% at first extraction). 1,1,2-trichloro-1,2,2-trifluoroethane was an ozone-depleting chemical; therefore, MTBE was used for further experiments in the study. Cyclodecaneone was used as internal standard (IS) in the experiment to improve the accuracy of quantification. For solid samples, ethanolic homogenate was made by mixing with 100 mL of 60% ethanol. Beverage solution or 1 mL of the ethanolic homogenate was spiked with 200 µL of 40 mg/L cyclodecanone (IS), 5 mL of water and 1 mL of extraction solvent. After shaking and centrifugation, the organic phase was subjected to GC analysis. The recovery for this sample preparation was notable in the range from 95% to 105%.
2.2.3. LPME
LPME which is a miniaturized version of LLE was introduced by Jeannot can Cantwell in the early 1990s [37][29]. It is designed to be a simple, low cost, high recovery, low solvent consumption and rapid extraction method. LPME is a three-phase extraction method where analytes are extracted from a liquid matrix using a small amount (e.g., tens of microliters) of immiscible extraction solvent with the aid of another solvent. There are three main types of LPME including dispersive liquid-liquid microextraction (DLLME), single-drop microextraction and hollow-fiber LPME [38][30].
An innovative dual DLLME [39][31] was used for the enrichment of six phenylpropenes, including anethole, estragole, methyleugenol, eugenol, safrole and myristicin in oil samples [26][32]. In DLLME, a dispersant is used to help the extractant to form fine droplets in the sample solution. The dispersant and extractant are typically organic solvents. The formation of fine droplets increases the extraction efficiency by increasing the contact between extractant and analytes [39][31]. The procedure for the dual DLLME (forward and back DLLME) method for the alkenylbenzenes is shown in Figure 3. In the first (forward) DLLME, a biodegradable surfactant (TX-100) was used to reduce the surface tension of oil by adsorption at the liquid–liquid interface, increasing the dispersion of extraction phase (n-hexane) into the sample oil phase. The organic phase was then subjected to the second (backward) DLLME in order to remove the surfactant which was detrimental during GC-MS analysis. In the backward DLLME, water and ethyl acetate (dispersant) were added to the hexane extract, and the surfactants were removed into the water phase. The efficiency of the dual DLLME method was determined by calculating the enrichment factor which were 4.5, 9.1, 9.8, 16.7 and 37.1× for estragole, eugenol, methyleugenol, safrole and myristicin, respectively [26][32].
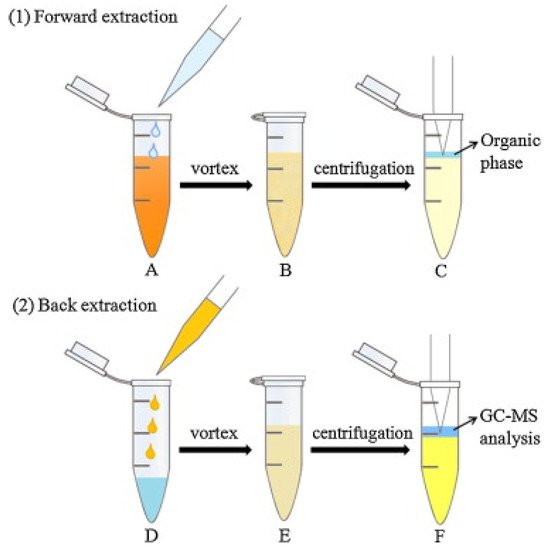
Figure 3. Dual DLLME method (forward and back DLLME) for alkenylbenzenes in oil. Forward DLLME (1): (A) The n-hexane and extraction solution (containing TX-100) were injected into the oil sample; (B) a cloudy solution was obtained; (C) the supernatant was transferred to another tube. Back DLLME (2) (D) water and AcOEt were added to the resulting supernatant; (E) a turbid solution was obtained; (F) the organic phase was mixed with internal standard, for GC-MS analysis. Reprinted with permission from the Authors [26][32].
2.2.4. QuEChERS
QuEChERS was initially established to detect pesticide residues in fruits and vegetables but had now rapidly gained attention in the extraction of analytes from different matrices. It is a very popular technique with thousands of papers published according to PubMed [40][33]. QuEChERS involves two simple steps. The first step is sample preparation and extraction. During this step, the sample is homogenised and an internal standard is added to enhance quantification accuracy. Various acids, salts and buffer are also added to improve the extraction efficiency. Second step is sample extract clean-up. The solvent extract from the first step is cleaned-up using dispersive solid-phase extraction to eliminate possible interfering compounds especially from food extracts [41][34].
QuEChERS was recently used in the determination of methyleugenol in food samples [31][35]. For both solid and semi-solid food samples, the sample (2 g) was weighed and placed in a 15 mL centrifuge tube. Methyleugenol-D3 (100 µL) and AcOEt (10 mL) was added, and the mixture was vortexed (1 min). Anhydrous magnesium sulphate (2 g) and sodium chloride (0.5 g) was added and the resulting mixture was sonicated for 10 min. After centrifugation, 1 mL of supernatant was collected for clean-up. This was by adding anhydrous magnesium sulphate (500 mg) and primary/secondary amine PSA (100 mg). PSA is a solid phase extraction adsorbent used for sample clean-up, which is available commercially. After the vortex and centrifugation steps, the sample was filtered through a 0.22 µm polytetrafluoroethylene (PTFE) syringe filter and analysed by GC. Satisfactory recoveries were obtained in the range of 94.3–100.3% by this method [31][35]. In another study aimed to determine flavouring substances in food, a similar extraction method was developed but was less time consuming, straightforward and matrix-independent. The samples (2.5 g) were weighed in a plastic centrifuge tube and spiked with dicyclohexylmethanol (25 µL, IS). AcOEt (5 mL) was added, and the mixture was shaken at room temperature for 30 min. Subsequently, magnesium sulfate (2 g) and sodium chloride (0.5 g) were added. The mixture was then shaken by hand and centrifuged (3500 rpm) for 10 min. 0.5 mL of supernatant were collected and filtered with a mini-uniprep PTFE filter. The recoveries for this extraction method were considered acceptable within the range of 70–120% [28][36], which was a little poorer than the first extraction method described.
2.2.5. SPE
SPE uses a liquid phase and a solid phase to separate analytes from a solution. It is often used to clean-up the sample before final chemical analysis. In general, the procedure starts by loading a sample solution into a SPE column, and undesired components are removed by flushing with a non-eluting solvent. An appropriate (eluting) solvent is loaded into the column to wash off the desired analytes that were retained in SPE material during the initial steps.
A phenyl-containing group SPE material was used to clean-up the hexane extract of fish fillets that potentially contained methyleugenol, eugenol and isoeugenol [30][24] (see Section 2.2.1). The SPE column was preconditioned with hexane and AcOEt. It was then flushed with hexane (clean-up) and then AcOEt was used to elute the targeted analytes for GC analysis. The authors examined the efficiency of hexane, AcOEt, acetonitrile (ACN) and dichloromethane (DCM) to elute targets from phenyl SPE columns. They found that hexane was not able to elute eugenol, isoeugenol and methyleugenol but was able to wash off the interferences from the fish fillet samples during SPE. In contrast, AcOEt, ACN and DCM were able to elute the analytes from the phenyl SPE columns. However, AcOEt was chosen to elute the analytes because ACN and DCM can produce adverse effects on human health [42][37]. Overall, the proposed solvent extraction and SPE clean-up methodology produced acceptable recovery values for methyleugenol, eugenol, isoeugenol from 76.4% to 99.9%. The methodology is also free from rotary evaporation and nitrogen blowing.
2.2.6. Distillation
According to the type of interaction between the water and/or steam, there are two main variants for extraction using distillation: steam distillation and hydro-distillation. Steam distillation has been used for a long time in the analysis of volatiles from high-water-content foods, beverages and essential oils [43,44][38][39]. It employs steam and/or water as extracting agent to vaporise the volatile analytes from the raw material. The volatile analytes are vaporised by absorbing heat from the steam. The vapor phase resulted from the process is cooled and condensed. Based on their immiscibility, water separates from the organic phase. As a result, two products are formed which are called the volatile oil (upper phase) and the hydrosol (bottom phase). In dry steam distillation, the steam is forced to flow through a supported matrix. This variant enables the steam to be heated above the boiling point and thus becomes superheated steam. In direct steam distillation, the matrix is inserted above the water in the boiling flask, supported by perforated grid or screen [45][40]. Steam distillation had been conducted by Muráriková, et al. [27][41] on basil essential oil which contains alkenylbenzenes.
Hydro-distillation is a common extraction method used in GC analysis. In hydro-distillation, there are three main physicochemical processes involved: hydro-diffusion, hydrolysis and decomposition by heat [46][42]. Clevenger apparatus is the equipment employed in hydro-distillation as shown in Figure 4. The name was titled after its inventor, Joseph Franklin Clevenger in 1928. The round-bottomed flask at the bottom contains the mixture of material and water. As the steam rises, the steam assembles in the condenser and the condensate falls into a burette. In the burette, oil floats (Oi) on the water. After few hours of extraction, the oil can be collected for further use [47][43].
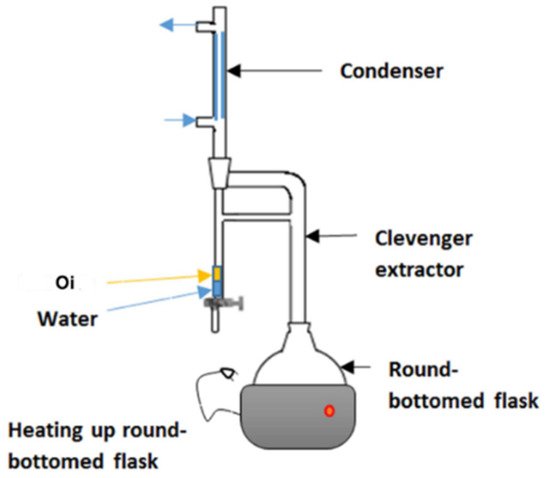
Figure 4. Clevenger apparatus used for hydrodistillation. Reprinted with permission from the Authors [47].
Since 2010, eight articles described hydro-distillation for the extraction of alkenylbenzenes in various types of food related samples. In the analysis of methyleugenol present in Cymbopogon khasianus Hack., Gogoi, et al. [24][44] collected fresh plant materials that were shade dried for 24 h. Shade drying results in significant increase in essential oil contents [48][45], most likely by the significant reduction of the water content. In the extraction of alkenylbenzenes in essential oil, the amount of sample used ranged from 50 g to 300 g and the distillation time were carried out between 2 to 3.5 h. The extracted oils were collected and treated with anhydrous sodium sulfate to remove the water in the oil. Subsequently, the samples were stored at 4 °C until GC analysis [17,18,21,22,23,24,29][17][18][21][46][47][44][48]. Joy, Berle, Affolter and Pegg [18] showed the average recovery was 85.3 ± 3.2% using hydrodistillation technique in their study. An interesting study by Niculau, et al. [49] used the Clevenger type apparatus for the hydro-distillation (at 110 °C for 2 h) of Pimenta pseudocaryophyllus essential oil which contained chavibetol and methyleugenol. Semi-preparative HPLC was then used to purify chavibetol and methyleugenol from the crude essential oil. GC with FID was used to determine the purity, with chavibetol (98.7%) having a higher purity compared to methyleugenol (85.3%). The purification method of hydrodistillation method coupled with semi-preparative HPLC can provide chavibetol with high purity and recovery. HPLC will be discussed in the next section, but for analysis.
3. HPLC
3.1. Analysis
The development of modern HPLC has been commonly linked to the research achievements of Prof. C. Horvath of Yale University. HPLC is one of the most important analytical separation techniques nowadays. A HPLC system consists of five main components: pump, injector, column, detector, data acquisition and control system. The pump provides constant and continuous flow of liquid mobile phase throughout the system. The sample is injected at the injector port and enters the column. The column contains a stationary phase, and it is where the separation of the components in the mixture happens. Once the components exit the column, it enters the detector and produces signals. Data acquisition and control system is a computer-based system that monitors all HPLC parameters [50].
HPLC was used to determine different types of alkenylbenzenes in various plants (e.g., Cinnamomum zeylanicum Blume), foods and commercial herbal formulations as shown in Table 2 [51,52,53][51][52][53]. Table 2 also summarizes the sample preparation used, amount of alkenylbenzenes found in the sample, HPLC conditions, detectors, and pertinent reference. All studies except one used reversed phase HPLC, where the stationary phase is non-polar (e.g., C18 stationary phase column) and the mobile phases are typically water-organic solvent (e.g., ACN) mixtures. On the other hand, normal phase HPLC uses a polar stationary phase and the analytes are eluted with a non-polar mobile phase (e.g., with hexane). A hexane and methanol containing mobile phase was used in the normal phase HPLC of Pimenta pseudocaryophyllus [49]. Normal phase separations are normally avoided due to the chemical waste generated by the mobile phase used. Interestingly, there were three studies conducted on ultra-performance liquid chromatography (UPLC) using stationary phase particle size of 1.7 µm [13,54,55][13][54][55]. UPLC is an ultra-modern version of conventional HPLC. The main different between HPLC and UPLC is particle size of the solid stationary phase. UPLC uses particle size less than 2 µm therefore it is faster, and results to better resolution and high sensitivity [56]. The common mobile phase used in the determination of alkenylbenzenes by HPLC/UPLC contained different percentages of ACN and water with 0.1% trifluoroacetic acid. ACN is popularly used because it has low viscosity, high elution strength and high chemical stability [57]. However, for the advancement of green analytical chemistry, future studies should replace ACN with the bioderived and safe organic solvent methanol [57]. Methanol on the one hand has a higher viscosity and lower eluting strength compared to ACN.
Table 2. Application of HPLC/UPLC in the study of alkenylbenzenes.
Application of HPLC/UPLC in the study of alkenylbenzenes.
| Analytes | Sample/s | Sample Preparation | Amount of Alkenylbenzenes Found in Sample/s | HPLC/UPLC Conditions | Detectors | Ref. |
|---|---|---|---|---|---|---|
| methyleugenol | pimenta pseudocaryo-phyllus | hydrodistillation | methyleugenol (27.9 mg/g) | mobile phase:hexane (A), ethanol (B) column:Phenomenex Luna amino (4.6 mm × 150 mm × 10 µm) condition:isocratic condition with ratio hexane and ethanol at 92:8 flow rate: 1 mL/min injection volume:10 µL wavelength: 230 nm LOD: not reported LOQ: not reported |
UV-VIS | [49] |
| methyleugenol | cinnamomum zeylanicum blume | methanol extraction | methyleugenol (0.5 mg/g) | mobile phase:water (A), ACN & methanol (B) at ratio 45:20:35 column: reversed-phase C18 Intersil ODS-3V-C18 (150 mm × 4.6 mm × 5 µm) condition:isocratic with the ratio of methanol:ACN:water is 35:20:45 flow rate:1 mL/min injection volume: not reported wavelength: 221 nm LOD: 0.10 µg/mL (methyleugenol) LOQ: 0.30 µg/mL (methyleugenol) |
UV-VIS | [51] |
| myristicin | commercial herbal formulation |
methanol extraction | myristicin (0.3 mg/g) † | mobile phase: water (A), ACN (B) column:Supelco 516 C18 (250 mm × 4.6 mm × 5 µm) condition: ACN:water is 85:15 flow rate: 1 mL/min injection volume: 20 µL wavelength: 205 nm LOD: 0.63 µg/mL (myristicin) LOQ: 1.91 µg/mL (myristicin) |
UV-VIS | [52] |
| myristicin | plants | n-hexane-diethyl ether extraction | myristicin (66.3 µg/mL) | mobile phase:water (A), ACN (B) column: LiChrosorb RP-18 (250 mm × 4 mm × 5 µm) condition:start from 0 to 1 min with 100%B, decrease to 25%B in 15 min. flow rate: 1 mL/min injection volume: 5 µL wavelength: 201 nm LOD:32.68 µg/mL (myristicin) LOQ: 64.57 µg/mL (myristicin) |
DAD | [53] |
| estragole myristicin apiol |
plant food supplements | methanol extraction | estragole (17.2 µg/g) myristicin (26.0 µg/g–1804.5 µg/g) apiol (93.0 µg/g–6486.6 µg/g) |
mobile phase: water with 0.1%TFA (A), ACN (B) column: Waters Acquity C18 (50 mm × 2.1 mm × 1.7 µm) condition: start at 31% ACN, keep at 31%ACN for 5 min, increase to 80%ACN over 4 min and keep for 1 min, decrease to 0% over 1.5 min and keep for 1 min, increase back to 31%ACN. flow rate: 0.6 mL/min injection volume:not reported wavelength:209 nm (apiol, myristicin), 201 nm (estragole) LOD: not reported LOQ: not reported |
DAD | [58] |
| elemicin methyleugenol myristicin safrole apiol estragole |
Indonesian jamu | methanol extraction | elemicin (not found) methyleugenol (4.8 ± 1.6 µg/g–128.6 ± 0.9 µg/g) myristicin (33.9 ± 7.2 µg/g–440.1 ± 24.8 µg/g) safrole (3.8 ± 0.5 µg/g–18.8 ± 3.2 µg/g) apiol (not found) estragole (13.3 ± 1.3 µg/g–23.9 ± 6.3 µg/g) |
mobile phase: water with 0.1%TFA (A), ACN (B) column: Waters Acquity UPLC BEH RP 18 (25 mm × 2.1 mm × 1.7 µm) condition: start at 30.5%ACN for 15 min, increase to 80%ACN over 1 min, keep at 80%ACN for 0.5 min, decrease to 0%ACN over 1.5 min, keep at 0%ACN for 1 min and back to 30.5%ACN. flow rate:0.6 mL/min injection volume: 3.5 µL wavelength: 206 nm (elemicin), 202 nm (methyleugenol, safrole), 210 nm (myristicin, apiol) and 225 nm (estragole) LOD: actual w/w values were not reported LOQ: actual w/w values were not reported |
DAD | [13] |
| methyleugenol myristicin estragole apiol |
pesto sauce | methanol extraction | methyleugenol (22.9 ± 3.1 µg/g–56.4 ± 7.5 µg/g) estragole (3.2 ± 1.5 µg/g–34.1 ± 2.8 µg/g) myristicin (13.2 ± 1.2 µg/g–15.8 ± 0.0 µg/g) apiol (3.4 ± 0.2 µg/g) |
mobile phase: water with 0.1%TFA (A), ACN (B) column: Acquity UPLC BEH C18 (50 mm × 2.1 mm × 1.7 µm) condition:isocratic at 40%ACN for 4 min flow rate:0.6 mL/min injection volume: 3.5 µL wavelength: 201 nm (methyleugenol, estragole), 210 nm (myristicin, apiol) LOD: not reported LOQ: not reported |
DAD | [55] |
A common detector employed in HPLC is based on photometry, i.e., ultraviolet-visible (UV-VIS)/diode array detector (DAD). UV-VIS/DAD is highly applicable to alkenylbenzenes because these compounds contain a UV active chromophore (see Figure 1, e.g., benzene ring in their structures). The studies considered (see Table 2) did not implement mass spectrometry detection most likely because alkenylbenzenes are neutral compounds which are not ionisable with common ionisation sources used in mass spectrometry (e.g., electrospray ionisation). In UV-VIS/DAD detection, visible and UV light passes through a flow cell. The mobile phase that contains the analytes passes through the flow cell, and a plot of signal intensity and time can be constructed (chromatogram). Quantitation from the obtained signal intensities can be done using one or more wavelengths. DAD can measure the absorption at different wavelengths and the components can be identified from the spectra obtained. HPLC with photometry was reported in the determination of boswellic acid and myristicin present in commercial herbal formulation [52]. A sample chromatogram obtained from the standards is shown in Figure 5, where the two targeted analytes were well separated within a short period of time (~5 min). Another fast HPLC separation (~7 min) of two alkenylbenzenes in plants was done by Lung, Stan, Opriş and Soran [53] as shown in Figure 6. The myristicin and linalool peaks were well resolved from each other, as well as the other components in the real sample.
Figure 5. Chromatogram of boswellic acid (1) and myristicin (2) by HPLC with UV-VIS detection. Reprinted with permission from the Authors [52].
Figure 6. Chromatogram of myristicin and linalool in a plant by HPLC with DAD. Reprinted with permission from the Authors [53].
3.2. Sample Preparation
Solvent Extraction
Many studies evaluated the use of different solvents such as hexane, methanol and ethanol for the solvent extraction of secondary metabolites in various plant parts (e.g., leaves and seeds) [59][58]. They have found that highly polar solvents like methanol gave better recoveries. This was the most likely reason leading to the authors’ decision to use methanol as extraction solvent during the determination of alkenylbenzenes using HPLC. In fact, during this review period, only solvent extraction was used in conjunction with HPLC. First, Gursale, et al. [51] used methanol in the solvent extraction of alkenylbenzenes in Cinnamomum zeylanicum Blume. Recovery of methyleugenol was 99% after solvent extraction with sonication followed by simple filtration. The recovery value was considered acceptable because the recovery value was within 80% to 110% (see FDA Guidelines for the Validation of Chemical Methods) [60][59]. This study was an inspiration for later studies. For example, Alajlouni, et al. [58][60] used methanol to extract alkenylbenzenes from plant food supplements. The recoveries found for estragole, myristicin, apiol was 85.3% ± 2.9%, 101.1% ± 5.4% and 94.5 ± 7.6%, respectively. Suparmi, et al. [13] determined alkenylbenzenes in Indonesian jamu. The recoveries found for methyleugenol, elemicin, safrole, myristicin and estragole were 103.8% ± 0.1%, 108.1% ± 1.8%, 105.6% ± 23.0%, 96.1% ± 1.3%, 99.7% ± 3.4, respectively. However, solvent extraction with methanol cannot extract all alkenylbenzenes with good repeatability (e.g., safrole with ~20% error).
In the determination of myristicin in pesto sauce, Al-Malahmeh and co-workers [55] used the methanol extraction method of Ávila and co-workers [61] with few modifications. Originally, Ávila and team macerated dry samples (e.g., basil leaves) with only 15 mL methanol for 12 h at 50 °C. The sample was filtered and wash with water and methanol. The filtrates were collected and quantitatively diluted and then stored at 5 °C [61]. In the Al-Malahmed and team extraction method, a larger volume of methanol (i.e., 80 mL) was used for maceration. The resulting samples were centrifuged for 5 min and an aliquot of the supernatant was stored at −20 °C [55]. They used the margin of exposure (MOE) approach to evaluate the potential risk of myristicin from intake of pesto sauce. Based on the levels of myristicin found in the pesto sauces studied, >30 g consumption of pesto sauce on a daily basis will achieve MOE levels that will warrant priority for risk management.
Meanwhile, the study by Lung et al. [53] was interested to know the effect of microwave irradiation on the levels of linalool and myristicin in plants. The plants were exposed to microwave irradiation prior to extraction. Similar to methanol extraction, the sample was soaked in the solvent, sonicated and then filtered prior to HPLC analysis. No explanation or systematic studies on other solvents were conducted, however very high recovery for myristicin was achieved between 98%–98.48%. Interestingly, they found that the concentration of myristicin in plants was significantly affected by microwave irradiation, but not linalool.
4. Capillary Electrophoresis
Capillary electrophoresis (CE) is an electric field driven analytical technique used for the separation of compounds in a mixture [62,63][62][63]. In CE, a fused silica capillary is filled with a separation media (e.g., buffer), and the nature of the separation media defines the mode of the separation. In the CE mode where a buffer is used a separation media, only charged analytes are separated. The separation mechanism is based on differences in the electrophoretic mobility of the analytes. The general procedure in CE is as follows, after conditioning the capillary with separation media, sample is injected at one end of the capillary, a high voltage is applied at both ends of the capillary that is dipped into vials that contain the separation media. The analytes migrate to the detector at the other side of the capillary via electrophoretic mobility and electroosmotic flow. Detection is typically using on-line (on-capillary) with a UV/VIS detectore. Another mode of CE is micellar electrokinetic chromatography (MEKC), where the addition of a pseudostationary phase (e.g., micelles) to the buffer allows the separation of both neutral and charged analytes. The pseudostrationary phase acts similarly to the stationary phase in HPLC. The components in the mixture separate based on the partition differences of the analyte between aqueous buffer solution (mobile phase) and micelles (pseudostationary phase) [64,65][64][65]. Neutral analytes gain an ‘effective’ electrophoretic mobility due to its interaction with a charged pseudostationary phase. MEKC is the suitable CE mode for alkenylbenzenes separation because these analytes are electrically neutral (see Figure 1).
Indeed in 2008, Huhn, et al. [66] utilized the principle of MEKC to separate the hydrophobic neutral alkenylbenzenes eugenol, safrole, methyleugenol and myristicin. The separation media consisted of 60 mM sodium dodecyl sulphate (SDS) in 7.5 mM sodium borate (pH 9). SDS forms micelles above its critical micelle concentration (which is ~3 mM in the presence of salts [67]). Three separation media additives that improved the separation were urea, ACN and calcium chloride. The study concluded that addition of urea and ACN makes it possible to reduce the retention factor of hydrophobic solutes without compromising separation efficiency. The addition of CaCl2 allowed to fine-tune the electroosmotic flow without influencing the effective electrophoretic mobility. A sample electrochromatogram of the separation of the sassafras essential oil components, including the targeted alkenylbenzenes is shown in Figure 7.
Figure 7. MEKC electrochromatogram of sassafras essential oil. Peaks: (3) eugenol; (6) methyleugenol; (7) safrole; (8) myristicin. Reprinted with permission from the Authors [66].
References
- Veeresham, C. Natural products derived from plants as a source of drugs. J. Adv. Pharm. Technol. Res. 2012, 3, 200–201.
- Pimentel, D.; Pimentel, M. Sustainability of meat-based and plant-based diets and the environment. Am. J. Clin. Nutr. 2003, 78, 660S–663S.
- Rietjens, I.M.C.M.; Martena, M.J.; Boersma, M.G.; Spiegelenberg, W.; Alink, G.M. Molecular mechanisms of toxicity of important food-borne phytotoxins. Mol. Nutr. Food Res. 2005, 49, 131–158.
- Monien, B.H.; Sachse, B.; Niederwieser, B.; Abraham, K. Detection of N-Acetyl-S-[3′-(4-methoxyphenyl)allyl]-l-Cys (AMPAC) in human urine samples after controlled exposure to fennel tea: A new metabolite of estragole and trans-anethole. Chem. Res. Toxicol. 2019, 32, 2260–2267.
- Tremmel, R.; Herrmann, K.; Engst, W.; Meinl, W.; Klein, K.; Glatt, H.; Zanger, U.M. Methyleugenol DNA adducts in human liver are associated with SULT1A1 copy number variations and expression levels. Arch. Toxicol. 2017, 91, 3329–3339.
- Sangster, S.A.; Caldwell, J.; Hutt, A.J.; Anthony, A.; Smith, R.L. The metabolic disposition of [methoxy- 14 C]-labelled trans -anethole, estragole and p -propylanisole in human volunteers. Xenobiotica 1987, 17, 1223–1232.
- Choong, Y.M.; Lin, H.J. A rapid and simple gas chromatographic method for direct determination of safrole in soft drinks. J. Food Drug Anal. 2001, 9, 27–32.
- Raffo, A.; D’Aloise, A.; Magrì, A.L.; Leclercq, C. Quantitation of tr-cinnamaldehyde, safrole and myristicin in cola-flavoured soft drinks to improve the assessment of their dietary exposure. Food Chem. Toxicol. 2013, 59, 626–635.
- European Commission Health & Consumer Protection Directorate-General. Opinion of the Scientific Committee on Food on Estragole (1-Allyl-4-methoxybenzene); Scientific Committee on Food: Brussel, Belgium, 2001.
- European Commission Health & Consumer Protection Directorate-General. Opinion of the Scientific Committee on Food on Methyleugenol 4-Allyl-1, 2-Dimethoxybenzene; Scientific Committee on Food: Brussel, Belgium, 2001.
- European Commission Health & Consumer Protection Directorate-General. Opinion of the Scientific Committee on Food on the Safety of the Presence of Safrole (1-allyl-3, 4-Methylene Dioxy Benzene) in Flavourings and other Food Ingredients with Flavouring Properties; Scientific Committee on Food: Brussel, Belgium, 2002.
- Auerbach, S.S.; Shah, R.R.; Mav, D.; Smith, C.S.; Walker, N.J.; Vallant, M.K.; Boorman, G.A.; Irwin, R.D. Predicting the hepatocarcinogenic potential of alkenylbenzene flavoring agents using toxicogenomics and machine learning. Toxicol. Appl. Pharmacol. 2010, 243, 300–314.
- Suparmi, S.; Widiastuti, D.; Wesseling, S.; Rietjens, I.M.C.M. Natural occurrence of genotoxic and carcinogenic alkenylbenzenes in Indonesian jamu and evaluation of consumer risks. Food Chem. Toxicol. 2018, 118, 53–67.
- McNair, H.M.; Miller, J.M.; Snow, N.H. Basic Gas Chromatography; John Wiley & Sons: Hoboken, NJ, USA, 2019.
- Stauffer, E.; Dolan, J.A.; Newman, R. Chapter 8—Gas chromatography and gas chromatography—Mass spectrometry. In Fire Debris Analysis; Academic Press: Burlington, VT, USA, 2008; pp. 235–293.
- Zhao, J.; Lv, G.-P.; Chen, Y.-W.; Li, S.-P. Advanced development in analysis of phytochemicals from medicine and food dual purposes plants used in China. J. Chromatogr. A 2011, 1218, 7453–7475.
- Freitas, J.V.B.; Alves Filho, E.G.; Silva, L.M.A.; Zocolo, G.J.; de Brito, E.S.; Gramosa, N.V. Chemometric analysis of NMR and GC datasets for chemotype characterization of essential oils from different species of Ocimum. Talanta 2018, 180, 329–336.
- Joy, N.; Berle, D.; Affolter, J.; Pegg, R.B. Employing predicted response factors and a validated chromatographic method for the relative quantitation of holy basil essential oils. J. Essent. Oil Res. 2020, 32, 407–418.
- Wang, L.H.; Wang, C.C.; Chuang, S.K. Simultaneous determination of alkenyl benzenes in essential oils and human serum by gas chromatrography and GC-MS. Asian J. Chem. 2010, 22, 3835–3842.
- Rivera-Pérez, A.; López-Ruiz, R.; Romero-González, R.; Garrido Frenich, A. A new strategy based on gas chromatography–high resolution mass spectrometry (GC–HRMS-Q-Orbitrap) for the determination of alkenylbenzenes in pepper and its varieties. Food Chem. 2020, 321, 126727.
- Caamal-Herrera, I.O.; Muñoz-Rodríguez, D.; Madera-Santana, T.; Azamar-Barrios, J.A. Identification of volatile compounds in essential oil and extracts of ocimum micranthum willd leaves using GC/MS. Int. J. Appl. Res. Nat. Prod. 2016, 9, 31–40.
- Falaki, F. Sample Preparation Techniques for Gas Chromatography; IntechOpen: London, UK, 2019.
- Raymond, C.A.; Davies, N.W.; Larkman, T. GC-MS method validation and levels of methyl eugenol in a diverse range of tea tree (Melaleuca alternifolia) oils. Anal. Bioanal. Chem. 2017, 409, 1779–1787.
- Ke, C.; Liu, Q.; Li, L.; Chen, J.; Wang, X.; Huang, K. Simultaneous determination of eugenol, isoeugenol and methyleugenol in fish fillet using gas chromatography coupled to tandem mass spectrometry. J. Chromatogr. B Anal. Technol. Biomed. Life Sci. 2016, 1031, 189–194.
- Chemat, F.; Rombaut, N.; Sicaire, A.-G.; Meullemiestre, A.; Fabiano-Tixier, A.-S.; Abert-Vian, M. Ultrasound assisted extraction of food and natural products. Mechanisms, techniques, combinations, protocols and applications. A review. Ultrason. Sonochem. 2017, 34, 540–560.
- Mussatto, S.I. Chapter 11—Generating biomedical polyphenolic compounds from spent coffee or silverskin. In Coffee in Health and Disease Prevention; Preedy, V.R., Ed.; Academic Press: San Diego, CA, USA, 2015; pp. 93–106.
- Kyle, P.B. Toxicology: GCMS. In Mass Spectrometry for the Clinical Laboratory; Nair, H., Clarke, W., Eds.; Academic Press: San Diego, CA, USA, 2017; pp. 131–163.
- Grosch, S.; Monakhova, Y.B.; Kuballa, T.; Ruge, W.; Kimmich, R.; Lachenmeier, D.W. Comparison of GC/MS and NMR for quantification of methyleugenol in food. Eur. Food Res. Technol. 2013, 236, 267–275.
- Bicchi, C.; Cordero, C.; Liberto, E.; Sgorbini, B.; Rubiolo, P. Headspace sampling in flavor and fragrance field. In Comprehensive Sampling and Sample Preparation; Pawliszyn, J., Ed.; Academic Press: Oxford, UK, 2012; pp. 1–25.
- Kim, J.; Choi, K.; Chung, D.S. Sample Preparation for Capillary Electrophoretic Applications. In Comprehensive Sampling and Sample Preparation; Pawliszyn, J., Ed.; Academic Press: Oxford, UK, 2012; pp. 701–721.
- Rezaee, M.; Assadi, Y.; Milani Hosseini, M.-R.; Aghaee, E.; Ahmadi, F.; Berijani, S. Determination of organic compounds in water using dispersive liquid–liquid microextraction. J. Chromatogr. A 2006, 1116, 1–9.
- Tsai, C.J.; Li, J.H.; Feng, C.H. Dual dispersive liquid-liquid microextraction for determination of phenylpropenes in oils by gas chromatography-mass spectrometry. J. Chromatogr. A 2015, 1410, 60–67.
- Perestrelo, R.; Silva, P.; Porto-Figueira, P.; Pereira, J.A.M.; Silva, C.; Medina, S.; Câmara, J.S. QuEChERS—Fundamentals, relevant improvements, applications and future trends. Anal. Chim. Acta 2019, 1070, 1–28.
- González-Curbelo, M.Á.; Socas-Rodríguez, B.; Herrera-Herrera, A.V.; González-Sálamo, J.; Hernández-Borges, J.; Rodríguez-Delgado, M.Á. Evolution and applications of the QuEChERS method. Trac. Trends Anal. Chem. 2015, 71, 169–185.
- Li, J.; Liu, H.; Wang, C.; Yang, J.; Han, G. Stable isotope labeling-assisted GC/MS/MS method for determination of methyleugenol in food samples. J. Sci. Food Agric. 2018, 98, 3485–3491.
- Lopez, P.; Van Sisseren, M.; De Marco, S.; Jekel, A.; De Nijs, M.; Mol, H.G.J. A straightforward method to determine flavouring substances in food by GC-MS. Food Chem. 2015, 174, 407–416.
- Joshi, D.R.; Adhikari, N. An overview on common organic solvents and their toxicity. J. Pharm. Res. Int. 2019, 28, 1–18.
- Mottram, D.S.; Elmore, J.S. Sensory evaluation—Aroma. In Encyclopedia of Food Sciences and Nutrition, 2nd ed.; Caballero, B., Ed.; Academic Press: Oxford, UK, 2003; pp. 5174–5180.
- Pushpangadan, P.; George, V. Basil. In Handbook of Herbs and Spices, 2nd ed.; Peter, K.V., Ed.; Woodhead Publishing: Cambridge, UK, 2012; pp. 55–72.
- Prado, J.M.; Vardanega, R.; Debien, I.C.N.; Meireles, M.A.d.A.; Gerschenson, L.N.; Sowbhagya, H.B.; Chemat, S. Conventional extraction. In Food Waste Recovery; Galanakis, C.M., Ed.; Academic Press: San Diego, CA, USA, 2015; pp. 127–148.
- Muráriková, A.; Ťažký, A.; Neugebauerová, J.; Planková, A.; Jampílek, J.; Mučaji, P.; Mikuš, P. Characterization of essential oil composition in different basil species and pot cultures by a GC-MS Method. Molecules 2017, 22, 1221.
- Oreopoulou, A.; Tsimogiannis, D.; Oreopoulou, V. Chapter 5—Extraction of polyphenols from aromatic and medicinal plants: An overview of the methods and the effect of extraction parameters. In Polyphenols in Plants, 2nd ed.; Watson, R.R., Ed.; Academic Press: Cambridge, MA, USA, 2019; pp. 243–259.
- Tahina Rabeharitsara, A. Determination of water rate in gas oil and fuel oil by extraction with betacarotenes molecules using a heavy oil clevenger extractor, process validation by SPC. Am. J. Appl. Chem. 2016, 4, 111.
- Gogoi, R.; Loying, R.; Sarma, N.; Begum, T.; Pandey, S.K.; Lal, M. Comparative analysis of in-vitro biological activities of methyl eugenol rich Cymbopogon khasianus hack., leaf essential oil with pure methyl eugenol compound. Curr. Pharm. Biotechnol. 2020, 21, 927–938.
- El Hassan, G.M. Effect of drying method on spearmint (Mentha spicata var. Viridis L.) oil content and physicochemical properties. Am. J. Phytomed. Clin. Ther. 2018, 10, 151–159.
- Zhao, M.P.; Liu, X.C.; Liu, Q.Z.; Liu, Z.L. Gas chromaotography-mass spectrometry analysis of insecticidal essential oil derived from Chinese Ainsliaea fragrans Champ ex Benth (Compositae). Trop. J. Pharm. Res. 2015, 14, 1685–1689.
- Schmidt, E.; Huong, L.T.; Dai, D.N.; Thang, T.D.; Wanner, J.; Jirovetz, L. Analysis and olfactory description of four essential oils from Vietnam. Nat. Prod. Commun. 2016, 11, 1551–1554.
- Hendawy, S.F.; Hussein, M.S.; El-Gohary, A.E.; Soliman, W.S. Chemical constituents of essential oil in chervil (Anthriscus cerefolium L. Hoffm.) cultivated in different locations. J. Essent. Oil-Bear. Plants 2019, 22, 264–272.
- Niculau, E.D.S.; Ribeiro, L.D.P.; Ansante, T.F.; Fernandes, J.B.; Forim, M.R.; Vieira, P.C.; Vendramim, J.D.; da Silva, M.F.D.G.F. Isolation of chavibetol and methyleugenol from essential oil of Pimenta pseudocaryophyllus by high performance liquid chromatography. Molecules 2018, 23, 2909.
- Kazakevich, Y.V.; Lobrutto, R. HPLC for Pharmaceutical Scientists; John Wiley & Sons: Hoboken, NJ, USA, 2007.
- Gursale, A.; Dighe, V.; Parekh, G. Simultaneous quantitative determination of cinnamaldehyde and methyl eugenol from stem bark of cinnamomum zeylanicum blume using RP-HPLC. J. Chromatogr. Sci. 2010, 48, 59–62.
- Jain, R.A.; Rajput, S.J.; Raval, R.R. Development and validation of RP-HPLC method for determination of boswellic acid and myristicin in commercial herbal formulation. Int. J. Pharm. Pharm. Sci. 2013, 5, 379–383.
- Lung, I.; Stan, M.; Opriş, O.; Soran, M.L. Determination of myristicin and linalool in plants exposed to microwave radiation by high-performance liquid chromatography. Anal. Lett. 2015, 48, 567–574.
- Al-Malahmeh, A.J.; Al-Ajlouni, A.; Wesseling, S.; Soffers, A.E.M.F.; Al-Subeihi, A.; Kiwamoto, R.; Vervoort, J.; Rietjens, I.M.C.M. Physiologically based kinetic modeling of the bioactivation of myristicin. Arch. Toxicol. 2017, 91, 713–734.
- Al-Malahmeh, A.J.; Al-ajlouni, A.M.; Wesseling, S.; Vervoort, J.; Rietjens, I.M.C.M. Determination and risk assessment of naturally occurring genotoxic and carcinogenic alkenylbenzenes in basil-containing sauce of pesto. Toxicol. Rep. 2017, 4, 1–8.
- Rahman, M. Application of computational methods in isolation of plant secondary metabolites. In Computational Phytochemistry; Sarker, S.D., Nahar, L., Eds.; Elsevier: Amsterdam, The Netherlands, 2018; pp. 107–139.
- Quirino, J.P.; Alejandro, F.M.; Bissember, A.C. Towards cleaner downstream processing of biomass waste chemical products by liquid chromatography: A review and recommendations. J. Clean. Prod. 2020, 253, 119937.
- Altemimi, A.; Lakhssassi, N.; Baharlouei, A.; Watson, D.G.; Lightfoot, D.A. Phytochemicals: Extraction, isolation, and identification of bioactive compounds from plant extracts. Plants 2017, 6, 42.
- U.S. Food and Drug Administration. Guidelines for the Validation of Chemical Methods for the FDA FVM Program. FDA Foods Program Regulatory Science Steering Committee; U.S. Food and Drug Administration: Rockville, ML, USA, 2019; Volume 3.
- Alajlouni, A.M.; Al-Malahmeh, A.J.; Wesseling, S.; Kalli, M.; Vervoort, J.; Rietjens, I.M.C.M. Risk assessment of combined exposure to alkenylbenzenes through consumption of plant food supplements containing parsley and dill. Food Addit. Contam. Part A Chem. Anal. Control Expo. Risk Assess. 2017, 34, 2201–2211.
- Ávila, M.; Zougagh, M.; Escarpa, A.; Ríos, Á. Determination of alkenylbenzenes and related flavour compounds in food samples by on-column preconcentration-capillary liquid chromatography. J. Chromatogr. A 2009, 1216, 7179–7185.
- Muhandiramge, R.; Quirino, J.P. Sample preparation in capillary electrophoresis for the determination of small molecule drugs and metabolites in urine. Bioanalysis 2021, 13, 533–536.
- Quirino, J.P.; Wuethrich, A. Electrophoresis|capillary electrophoresis: Overview. In Encyclopedia of Analytical Science; Elsevier: Amsterdam, The Netherlands, 2019; pp. 377–386.
- Quirino, J.P.; Terabe, S. Electrokinetic chromatography. J. Chromatogr. A 1999, 856, 465–482.
- Yu, R.B.; Quirino, J.P. Ionic liquids in electrokinetic chromatography. J. Chromatogr. A 2021, 1637, 461801.
- Huhn, C.; Pütz, M.; Pyell, U. Separation of very hydrophobic analytes by micellar electrokinetic chromatography. III. Characterization and optimization of the composition of the separation electrolyte using carbon number equivalents. Electrophoresis 2008, 29, 783–795.
- Quirino, J.P.; Tarongoy, F.M. Liquid chromatography with micelles in open-tube capillaries. Green Chem. 2018, 20, 2486–2493.
More