Your browser does not fully support modern features. Please upgrade for a smoother experience.
Please note this is a comparison between Version 2 by Vivi Li and Version 1 by Robert Rogers.
Tropical cyclones (TCs) plague coastal communities around the world, threatening millions of lives and causing many billions of dollars in damage to infrastructure. The primary hazards responsible for many of the fatalities and damage in coastal communities include storm surge and wind damage, while further inland hazards include torrential rainfall and severe weather that often accompany landfalling TCs. The danger from these hazards is only increasing due to greater coastal development worldwide, increasing sea surface temperature, and sea level rise.
- airborne observations
- tropical cyclones
- intensity change
1. Introduction
Tropical cyclones (TCs) plague coastal communities around the world, threatening millions of lives and causing many billions of dollars in damage to infrastructure. The primary hazards responsible for many of the fatalities and damage in coastal communities include storm surge and wind damage, while further inland hazards include torrential rainfall and severe weather that often accompany landfalling TCs. The danger from these hazards is only increasing due to greater coastal development worldwide, increasing sea surface temperature, and sea level rise.
The ongoing threat from these hazards has necessitated significant efforts to improve their prediction. The intensity of TCs, as indicated by the minimum sea-level pressure and the peak winds, is a key parameter in determining how much damage occurs when a TC makes landfall. Compared to TC track forecasting, which has seen steady improvement over the past several decades, progress in predicting TC intensity, while improving in recent years [1], has advanced more slowly [2,3][2][3]. When considering cases of a TC undergoing rapid intensification (RI), defined as when the peak winds increase by ~15 m s−1 over a 24 h period [4], intensity forecasts perform even worse, sometimes by as much as a factor of three compared with forecasts of non-RI cases (Figure 1). Clearly improvements in the prediction of intensifying TCs—RI, in particular—are a crucial step in improving overall TC intensity forecasts.
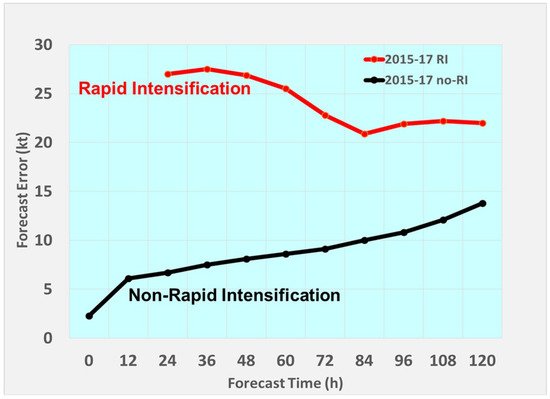
Figure 1. Intensity forecast errors (kt) from consensus of two statistical/dynamical models (Decav-SHIPS, Logistical Growth Equation Model) and two regional deterministic models (intelpolated HWRE, COAMPS-TC) for TCs between 2015 and 2017. Black line shows intensity forecast errors for all TCs not undergoing RI; red line shows errors for all TC’s undergoing RI.
As with any forecast system, an improved understanding of the underlying physical processes is a vital step in making better forecasts. TC intensity change is difficult to predict largely because of its multiscale nature, with physical processes ranging from thousands of kilometers and multiple days (e.g., environmental vertical shear, trough interactions) to ~100 km and 12–24 h (e.g., eyewall replacement cycles) to 0.1–10 km and 0.1–3 h (e.g., deep convection and turbulent mixing) to micron to centimeter-scale and seconds (e.g., hydrometeor production and conversion, latent heat release). Accurately representing these processes and their interactions across spatiotemporal scales requires a comprehensive understanding of them and a faithful depiction, or reasonable approximation of them in the initial conditions, governing equations, and physical parameterizations of numerical modeling systems.
A great deal of resources has been dedicated on a global scale to improving spaceborne, airborne, and ground-based observing systems [5] that monitor TC position, intensity, and structure. Data from these observing systems are key as inputs to the numerical model guidance crucial in making forecasts of TC hazards. Each of these observing systems bring their own advantages to the ability to sample the TC and its environment. Aircraft and the associated remote-sensing instrumentation and expendables released from them provide a unique capability to sample many different aspects of TCs, including environmental conditions ranging from the lower stratosphere to the air–sea interface and below as well as inner-core structures in the most hostile environments possible.
The unique capabilities of airborne observing systems allow them to be an important complement to satellites and ground-based assets in providing data sets for fundamental process studies as well as assimilation in and evaluation of numerical modeling systems. In recognition of this importance, numerous efforts within the United States (U.S.) and, increasingly, in the international community have taken advantage of aircraft. In recent years, there have been multiple aircraft field campaigns designed to study aspects of the TC intensity change problem. In the U.S., this began ~15 years ago, with the National Oceanic and Atmospheric Administration (NOAA) Intensity Forecasting Experiment (IFEX; [3,6][3][6]). There was additionally the NOAA Sensing Hazards with Operational Unmanned Technology (SHOUT) experiment in 2015–2016 [7]. Other U.S.-based field campaigns include the National Aeronautical and Space Administration (NASA) extension to the African Monsoon Multidisciplinary Analyses (NAMMA; [8]), Genesis and Rapid Intensification Project (GRIP; [9]), and Hurricane and Severe Storm Sentinel (HS3; [10]); the National Science Foundation (NSF) Pre-depression Investigation of Cloud Systems in the Tropics (PREDICT; [11]); and the Office of Naval Research (ONR) Tropical Cyclone Structure—08 Experiment (TCS-08), Tropical Cyclone Intensity Experiment (TCI; [12]), and Impact of Typhoons on the Ocean in the Pacific (ITOP; [13]). The aircraft used in these experiments include crewed aircraft capable of penetrating the inner core of TCs at altitudes of ~0.5–5 km (NOAA WP-3D, Air Force C-130) and sampling broad regions of the environment and over the inner core at altitudes as high as ~12–18 km (NOAA G-IV, National Center for Atmospheric Research (NCAR)/NSF G-V, and NASA DC-8, ER-2, WB-57). They also include uncrewed aircraft capable of sampling the lowest altitudes within the TC boundary layer (Raytheon Corporation’s Coyote) and highest altitudes for extremely long durations of ~24 h (NASA Global Hawk). Many of the experiments mentioned above occurred in partnership with one another, leveraging airborne assets to provide an even greater ability to sample TCs.
Recent years have also seen increasing capacity for airborne sampling of TCs internationally, with many field campaigns primarily concentrated in the west Pacific basin. These include the Dropwindsonde Observations for Typhoon Surveillance near the Taiwan Region program (DOTSTAR; [14]); typhoon reconnaissance missions flown by the Hong Kong Observatory [15,16][15][16]; the Experiment on Typhoon Intensity Change in Coastal Area (EXOTICCA; [17]) in China; and the Tropical cyclone-Pacific Asian Research Campaign for Improvement of Intensity estimates/forecasts (T-PARCII; [18]) in Japan. These experiments have used platforms with generally similar capabilities to those in the U.S., and their teams have sometimes collaborated in ways similar to those of U.S. experimental teams.
2. Characterizing TC Structure and Its Relationship to Intensity Change
With several decades worth of TC missions flown by aircraft, there is a tremendous database of airborne observations that has been accumulated. Such a database allows for analyses of individual cases to provide in-depth exploration of physical processes and their evolution in time, and composite studies to identify statistically robust differences in vortex- and convective-scale structures of TCs encountering a variety of environmental conditions and structure and intensity changes. Most of the recent research involving aircraft data for TC intensity change studies has used dropsondes, which collect in situ near-vertical profiles of winds, temperature, moisture, and pressure; airborne radar (often tail Doppler radar; TDR), which remotely samples reflectivity and three-dimensional winds (if it is a Doppler radar and when adequate scatterers are present); and flight-level measurements of winds, temperature, moisture, and pressure. In some cases, these data sets have been used in combination, providing a rich context for observing TC kinematic, thermodynamic, and precipitation structures and understanding their interactions. These studies span a range of topics, locations in the atmosphere, ocean, and its interface, and stages of the TC lifecycle. This range of topics is discussed below.2.1. Characteristics of Inner-Core Structure
Rogers et al. [21][19] was the first paper to demonstrate the ability of multicase composites of TDR data to capture the inner-core structure of TCs seen in previous single-case studies (e.g., [22][20]). This study showed the composite mean structure of tangential and radial wind, vertical velocity, reflectivity, and vorticity and divergence for missions into eight hurricanes that occurred over a ~11-year period (Figure 2). In addition to the vortex-scale properties shown in Figure 2, Rogers et al. [21][19] also showed statistics of convective-scale properties of vertical velocity and reflectivity and turbulent-scale properties of turbulent kinetic energy (TKE), as well as the variance of different parameters within the data set. This approach set the stage for several composite-based studies that followed, including the development of a more extensive database of TDR measurements spanning a much broader time and larger number of TCs [23][21].
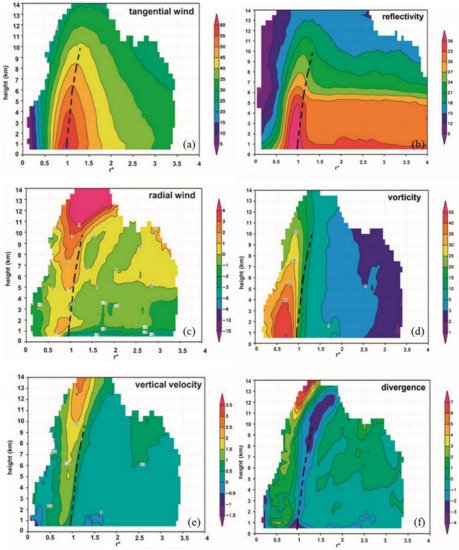
Figure 2. Composite azimuthally-averaged fields of three-dimensional analyses from cases in Rogers et al. (2012). (a) tangential wind (m s−1); (b) Reflectivity (dBZ); (c) Radial wind (m s−1). (d) Relative vorticity (×10−4 s−1); (e) Vertical velocity (m s−1); (f) Horizontal divergence (×10−4 s−1). Data from a minimum of 20 analyses are required for plotting. All composites plotted as a function of normalized radius r* and height above ground level. The dashed line denotes the axis of peak axisymmetric tangential wind from 0.5- to 10-km altitude calculated from the composite in (a). Adapted from [21][19].
Characteristics of eyewall slope were explored using TDR data first in [24][22], and subsequently by [25[23][24],26], who considered variations in eyewall slope relative to the environmental wind shear vector. Lorsolo et al. (2010) [27][25] calculated two-dimensional profiles of TKE using the TDR data, finding that the strongest turbulence was generally located in convective regions, such as the eyewall, and in the boundary layer in the lowest kilometer. The strong turbulence was generally associated with strong horizontal shear of vertical and radial wind components in the eyewall and strong vertical shear of horizontal wind in the boundary layer. Creasey and Elsberry [28][26] showed a novel technique for using high-altitude dropsondes to estimate the variation of TC centers with height. This technique was used in a study of the structural evolution of Hurricane Joaquin (2015) during its rapid decay [29][27].
2.2. Response of TC Structure to Environmental Forcing
Following the TDR composite methodology described in [21][19], the response of TC structure to environmental vertical shear was investigated in [30][28]. Their analysis showed many of the vortex-scale characteristics seen in previous studies for TCs of hurricane strength encountering moderate to strong shear (850–200 hPa shear > 7 m s−1); e.g., downshear tilt, a precipitation maximum downshear left, low-level (midlevel) inflow (outflow) downshear right (DSR) and downshear left (DSL), and midlevel (low-level) inflow (outflow) upshear left (USL) and upshear right (USR; Figure 3). A similar composite approach focusing on variations in convective-scale structure relative to the vertical shear was shown in DeHart et al. (2014) [31][29]. A schematic from their paper (Figure 4) shows that convective initiation occurs primarily in the DSR quadrant, matures DSL, and becomes predominantly downdrafts in the USL and USR quadrants.
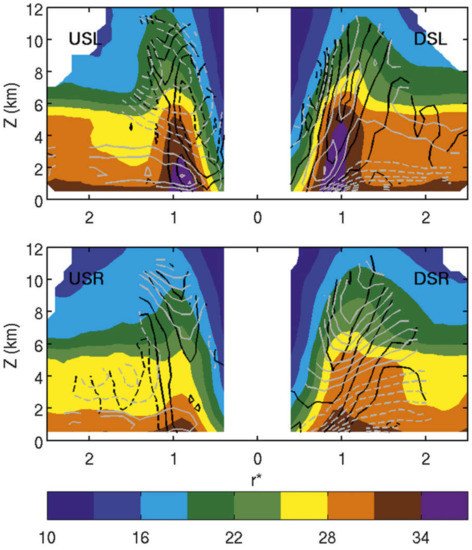
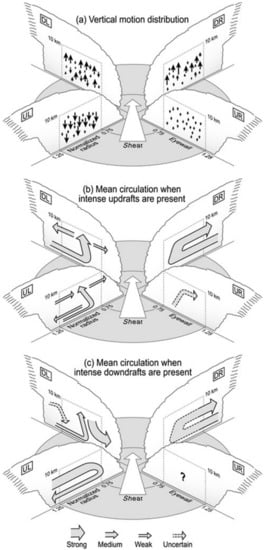
Figure 3. Quadrant-average cross sections of shear-relative composite reflectivity (dBZ, shaded), vertical velocity (m s−1, black contours), and radial velocity (m s−1, gray contours) for cases with peak winds >31 m s−1 and 850–200 hPa vertical shear >7 m s−1. The quadrants are arranged such that the shear vector points to the right of the page. Regions of negative vertical motion are highlighted by the 0 and −0.25 m s−1 dashed black contours. Contours of positive vertical motion (solid black) are drawn at 0.25, 0.5, 1, 1.5, 2, and 2.5 m s−1. The contour interval for radial inflow (dashed gray) and outflow (solid gray) is 1 m s−1 (zero contour omitted). The radial coordinate r* represents the radius normalized bythe RMWat 2 km altitude. Adapted from [30][28].
Figure 4. (a) Three-dimensional schematic depicting the vertical motion distribution in each quadrant. The environmental shear vector is denoted by an arrow pointing toward the top of the figure, and quadrants are labeled according to their direction relative to the shear vector (DR, DL, UL, and UR). Concentric circles below the clouds show the locations of the eyewall normalized radius values between 0.75 and 1.25), which connect to gray dashed boxes encompassing the eyewall up to 10-km altitude. Vertical arrows denote the vertical motion distribution, where size is proportional to magnitude. (b) As in (a), except illustrating the mean circulation that occurs when intense updrafts are present. Arrow width corresponds to composite velocity magnitude, as noted in the legend at the bottom. Dashed arrows refer to features that were present in the composite analysis but were shown to be not significant. (c) As in (b), except illustrating the mean circulation that occurs when intense downdrafts are present. The question mark denotes the structure existing UR is weak, disorganized, and not robust. Adapted from [31][29].
Other composite studies, using dropsonde and flight-level data, have further elucidated TC structure and its response to environmental forcing, such as the relationship between azimuthal asymmetries in surface and flight-level wind speed and vertical shear and storm motion (e.g., [32][30]). Zhang et al. [33][31] used composites of dropsonde data to investigate TC structure in response to another environmental forcing, i.e., the diurnal cycle. They found oscillations in the strength of inflow in the planetary boundary layer that varied in phase with the diurnal cycle, consistent with numerical model studies and satellite observations showing expanding cold cloud shields also tied to the diurnal cycle (e.g., [34,35][32][33]).
2.3. Relationship between TC Structure and Intensity Change
Composites of TC structure have also been related to subsequent intensity change. A composite analysis of TDR data for intensifying (ΔVmax ≥ 20 kt in 24 h after mission, where Vmax is best-track wind speed) vs. nonintensifying (−10 kt ≤ ΔVmax ≤ 10 kt in 24 h) TCs of hurricane strength found that intensifying TCs were associated with a ring-like vorticity structure inside the RMW, lower vorticity in the outer core, and a stronger and deeper inflow layer compared to steady-state TCs [36][34]. Another key result from this study was that intensifying TCs had the majority of grid points with the strongest updrafts, identified as “convective bursts” in this study, inside the radius of maximum wind (RMW) at 2 km altitude. By contrast, steady-state TCs had the majority of their convective bursts outside the 2-km RMW (Figure 5). A similar relationship was noted in a case study of Hurricane Earl (2010; Rogers et al., 2015, [37,38,39][35][36][37]). The relationship between bursts inside the RMW and TC intensification was initially interpreted as providing a more efficient, vorticity-rich environment for the conversion of diabatic heating into increases in the TC primary circulation [40,41,42,43][38][39][40][41]. Recent work, however, has challenged that interpretation, and instead emphasized the role of deep convection inside the RMW as providing a favorable environment for spinning up angular momentum in the planetary boundary layer (PBL; [44,45,46][42][43][44]).
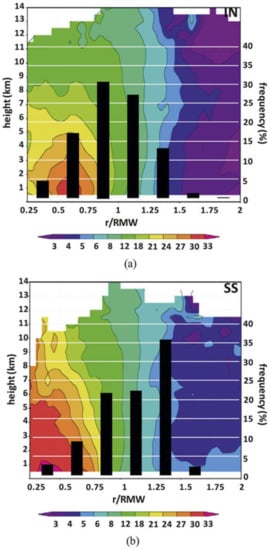
Figure 5. Frequency of convective burst points as a function of normalized radial location (bar chart, %) overlain on normalized radius-height plot of composite-mean axisymmetric vertical vorticity (color shaded, ×10−4 s−1) for the (a) intensifying (IN) and (b) steady-state (SS) TC composites. Adapted from Rogers et al. (2013).
Regardless of the mechanism for intensification, the occurrence of the bulk of deep convection inside the RMW has been identified as an indicator of TC intensification by a diverse array of observational platforms. Stevenson et al. [47][45] used an aircraft flight-level database (FLIGHT+, Extended Flight Level Dataset for Tropical Cyclones; [48][46]) in conjunction with ground-based lightning detection (World Wide Lightning Location Network, WWLLN; [49][47]) to note a similar relationship. This study related the radial location of lightning flashes with the flight-level RMW (Figure 6). The average 24-h intensity change of TCs with an inner-core lightning burst inside the RMW was 5.3 m s−1, with seven TCs intensifying and only one weakening after the onset of the lightning burst. By contrast, the average intensity change for TCs with a lightning burst outside the RMW (between 1 and 1.5 ×RMW) was −2.6 m s−1. This result, using a completely different data set in different TCs, supports the notion that deep convection inside the RMW is a favorable configuration for TC intensification.
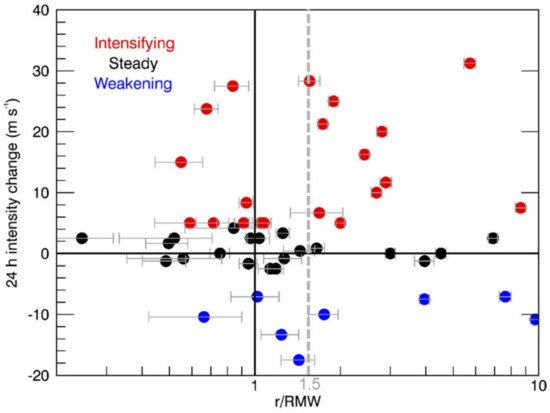
Figure 6. The 24-h intensity change (m s−1) of North Atlantic TCs with an inner-core lightning burst (ICLB) relative to the RMW (r/RMW; logarithmic scale) with aircraft reconnaissance within 1 h of the observed ICLB. The error bars indicate one standard deviation of 10,000 random errors (+0.2°) added to the NHC best-track position. Adapted from [47][45].
Similar relationships between vortex structure and TC intensity change were found in other composites of flight-level data, along with higher inner- and outer-core moisture for intensifying TCs [50][48]. Case study analyses were conducted for the record-breaking rapidly intensifying East Pacific Hurricane Patricia [51][49], including a novel analysis of potential vorticity using airborne Doppler and dropsonde data [52][50] that found that Patricia’s rapid intensification was closely related to the distribution of diabatic heating and eddy mixing. Guimond et al. [53][51], using Doppler radar data from the high-altitude NASA ER-2 aircraft, documented an episode of convective bursts occurring during the mature stage of Hurricane Dennis (2005) that preceded a period of RI. They observed significant downdrafts on the flanks of the updrafts at high altitude, with their cumulative effects hypothesized to result in the observed increases in the warm core strength.
3. Genesis and Development of Weak TCs
Much of the research described above has focused on tropical cyclones at a mature stage of their lifecycle. “Mature” in this context means TCs of moderate tropical storm strength or stronger. Such TCs have a degree of organization (as shown, e.g., in [21][19]) typified by a well-defined primary and secondary circulation that extends from the surface to the upper troposphere, a reasonably-aligned orientation of circulation centers with height, and some degree of precipitation coverage around the low-level center. Prior to this stage, however, TCs can be quite disorganized, with a shallow (or nonexistent) primary circulation in the lower troposphere; circulation centers—when they exist—displaced by hundreds of km with height; and precipitation confined to one small region, if at all. TCs at this stage of their lifecycle are termed “weak TCs” here, which in effect means TCs ranging from pretropical depression, to tropical depression, and up through weak tropical storm strength. Before any substantial intensification can occur, the structure of a weak TC must become better organized. The formation of a deep circulation rooted in the lower troposphere falls under the category of tropical cyclogenesis, while the development of a circulation aligned between the low- and midlevels can occur through a process termed reformation.3.1. Tropical Cyclogenesis
Much of the work with aircraft data and tropical cyclogenesis has focused on precipitation processes. One line of research uses a rotating convection paradigm that focuses on deep convective towers, termed vortical hot towers (VHTs), which collectively drive a system-scale inflow during the genesis process [44,114,115,116][42][52][53][54]. Reasor et al. [117][55] and Houze et al. [118][56] used airborne Doppler data to examine deep convection and its effect on the amplification of a low-level circulation. Houze et al. [118][56] noted the importance of such an intense convective cell in stretching lower tropospheric vorticity during the development of the system that became Hurricane Ophelia (2005). Bell and Montgomery [119][57] analyzed airborne Doppler measurements of an area of deep convection in predepression Hagupit (2008) in the western Pacific, finding that the low-level circulation of the predepression disturbance was enhanced by the coupling of the low-level vorticity and convergence in the deep convection.
Other studies approach the development of a deep, aligned vortex and subsequent intensification from a more mesoscale perspective, focusing on the local thermodynamic environment, as measured by dropsondes, and examining its impact on the vertical mass flux profile within a mesoscale domain. Raymond et al. [120][58], Raymond and López Carrillo [121][59] (2011), and Gjorgjievska and Raymond [122][60] note that a midlevel vortex is more conducive for convection with a vertical mass flux profile that peaks in the lower troposphere—what they term a “bottom-heavy” mass flux profile—which is associated with strong low-level convergence of mass and vorticity and a spin-up of the low-level cyclone. While the [118][56] Ophelia study focused on an intense convective cell, they noted that the mass flux profile in the lower troposphere within the convective cell peaked in the lower troposphere, resulting in a maximum in potential vorticity production in that layer.
Both of the approaches mentioned above presume a specific structure to the precipitation within the mesoscale environment of the low- and midlevel circulation centers. The structure of the precipitation (e.g., convective or stratiform; deep, moderate, or shallow convection) determines parameters such as the profiles of vertical velocity, vertical mass flux, and divergence, which has important implications for vorticity production. The precipitation structure can also be modulated by environmental conditions such as humidity and static stability. In an examination of deep-layer dropsondes from a variety of field campaigns in the Atlantic and Pacific basins, Raymond et al. [123][61] noted that thermodynamic profiles with a lower instability index were associated with midlevel vortices, more humid environments, and more bottom-heavy mass flux profiles. Such profiles were more likely to develop into tropical storms within 48 h. Bell and Montgomery [124][62], by contrast, argued that stretching in cycles of deep convection and stratiform precipitation in Hurricane Karl (2010), tied to the diurnal cycle, alternately build the low- and midlevel circulations episodically (Figure 17), rather than through a sustained lowering of the convective mass flux associated with stabilization as suggested by [123][61].
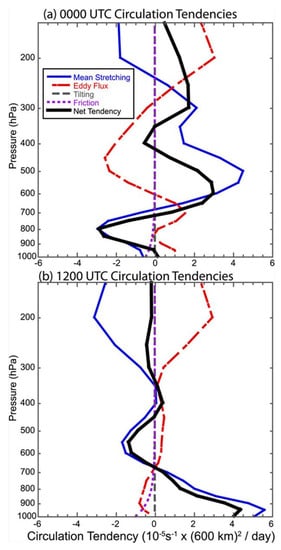
Figure 17. Meso-α-scale (600 km × 600 km) circulation tendencies with height at (a) 0000 and (b) 1200 UTC 13 Sep. Budget terms are mean stretching tendency (solid blue), eddy flux tendency (dash-dotted red), tilting tendency (long-dashed gray), friction tendency (short-dashed purple), and net tendency calculated by summation of thecomponent tendencies (thick solid black). Adapted from [124][62].
Much has been learned from comparisons of dropsondes released in developing vs. nondeveloping African easterly waves in the East Atlantic. Characteristics of those waves were found to vary widely [125][63], with some waves exhibiting a higher-amplitude trough signature that had characteristically less precipitation (drier from the Saharan Air Layer) and were less favorable for development, while some were lower amplitude, but those waves also had more precipitation, and thus were more favorable for development. Analyses of dropsondes from developing and nondeveloping cases downstream in the western Atlantic [126,127,128,129,130,131][64][65][66][67][68][69] (Komaromi, 2013) [129][67] revealed that developing cases exhibit a “priming” process where they become progressively more statically stable and humid/moist in the middle troposphere within 1–2 days of genesis. The increased stability occurred as a warm temperature anomaly grew in the middle to upper troposphere and deepened with time, while a cool anomaly developed in the lower troposphere. Nondeveloping cases were less humid in the midlevels than in developing cases and became drier and more unstable with time.
3.2. Reformation
Even if tropical cyclogenesis has occurred, a TC can still struggle to organize, as it sometimes has to contend with a disorganized structure characterized by circulation centers that are tilted or displaced (sometimes substantially) with height, considerable dry air in the developing circulation, and localized areas of vigorous convection (e.g., [126,127,128,129,132,133][64][65][66][67][70][71]. Despite the disorganized structure often seen at this stage of a TC’s lifecycle, most cases of RI onset occur then [4], suggesting a substantial improvement in organization prior to RI onset. This improvement in TC structure, into a persistently aligned vortex with a moist core, is what determines whether the TC can undergo RI, provided the environment is supportive.
Reformation, which often occurs on the downshear side of a low-level circulation and is thus termed downshear reformation, is one way in which such an aligned circulation occurs. Molinari and Vollaro [134][72] used flight-level data from Air Force aircraft combined with ground-based radar and lightning detection, model analyses, and a satellite microwave overpass to examine a weak tropical storm (Gabrielle, 2001) that underwent a 22 hPa pressure fall in a few hour period. The pressure fall occurred as an intense convective cell developed within a broader cyclonic circulation that was tilted left of the shear vector. They attributed the rapid deepening of the TC to the growth of the intense convective cell within a region of high efficiency of latent heating in the background cyclonic circulation. This evolution reflected a multiscale process in which a new circulation center formed within the downshear precipitation shield, continued ambient shear created a favored region for cell formation just downshear of the new center, and an intense convective cell produced enhanced diabatic heating located close to the center in a region of high efficiency of kinetic energy production.
Rogers et al. [135][73] examined a weak TC undergoing a similar evolution (Hermine, 2016) to that studied in [134][72]. Using airborne Doppler data and Global Hawk dropsondes, Rogers et al. [135][73] examined the vertical structure of latent heating and its temporal evolution during the period when Hermine intensified from a tropical depression to a hurricane over a 72 h period prior to landfall in the northeast Gulf of Mexico. Tracking the location of initially displaced low- and midlevel centers from pass to pass of the P-3 aircraft, they showed a clear shift over a ~5 h period of the low-level center toward a region of high echo tops, indicative of deep convection, located nearly coincident with the midlevel center (Figure 18). They identified a multiscale cooperative interaction between deep and moderate convection that fostered a persistently aligned vortex, marking the onset of RI. The transition of precipitation on the downshear side of the TC from deep convection to mostly moderate convection was associated with a moistening environment that was less unstable than previous days, resulting in a vertical mass flux profile maximized in the lower troposphere with stretching on the mesoscale that sustained the aligned vortex as RI occurred. Alvey et al. (2021) [58][74] showed a similar evolution in the early stages of Hurricane Dorian (2019), using a combination of airborne Doppler and ground-based radar data as Dorian moved through the Windward Islands in the Caribbean.
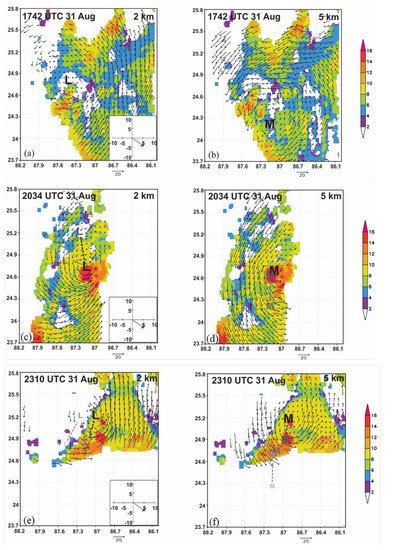
Figure 18. (a) Plot of 20 dBZ echo top heights (shaded, km) and storm-relative winds (vectors, m s−1) at 2-km altitude forindividual center passes centered at 1742 UTC August 31 in Tropical Depression #9 (future Hermine); (b) As in (a), but for winds at 5-km altitude; (c) As in (a), but for 2034 UTC August 31; (d) As in (b), but for 2034UTC August 31; (e) As in (a), but for 2310 UTC August 31; (f) As in (b), but for 2310 UTC August 31. “L”and “M” denote locations of subjectively-determined circulation centers at 2- and 5-km altitudes, respectively. Lighter, smaller letters denote locations from previous center passes. Inset in lower right corner in (a,c,e) denotes SHIPS-derived 850–200 hPa shear. Adapted from [135][73].
References
- Cangialosi, J.P.; Blake, E.; DeMaria, M.; Penny, A.; Latto, A.; Rappaport, E.; Tallapragada, V. Recent Progress in Tropical Cyclone Intensity Forecasting at the National Hurricane Center. Weather. Forecast. 2020, 35, 1913–1922.
- Elsberry, R.L.; Chen, L.; Davidson, J.; Rogers, R.F.; Wang, Y.; Wu, L. Advances In Understanding And Forecasting Rapidly Changing Phenomena In Tropical Cyclones. Trop. Cyc. Res. Rev. 2013, 2, 13–24.
- Rogers, R.; Aberson, S.; Aksoy, A.; Annane, B.; Black, M.; Cione, J.; Dorst, N.; Dunion, J.; Gamache, J.; Goldenberg, S.; et al. NOAA’S Hurricane Intensity Forecasting Experiment: A Progress Report. Bull. Am. Meteorol. Soc. 2013, 94, 859–882.
- Kaplan, J.; DeMaria, M.; Knaff, J.A. A Revised Tropical Cyclone Rapid Intensification Index for the Atlantic and Eastern North Pacific Basins. Weather. Forecast. 2010, 25, 220–241.
- Rogers, R.F.; Velden, C.S.; Zawislak, J.; Zhang, J.A. Tropical Cyclones and Hurricanes: Observations. In Reference Module in Earth Systems and Environmental Sciences; Elsevier: Amsterdam, The Netherlands, 2019; p. 25.
- Rogers, R.; Aberson, S.; Black, M.; Black, P.; Cione, J.; Dodge, P.; Dunion, J.; Gamache, J.; Kaplan, J.; Powell, M.; et al. The Intensity Forecasting Experiment: A NOAA Multiyear Field Program for Improving Tropical Cyclone Intensity Forecasts. Bull. Am. Meteorol. Soc. 2006, 87, 1523–1538.
- Wick, G.A.; Dunion, J.P.; Black, P.G.; Walker, J.R.; Torn, R.D.; Kren, A.C.; Aksoy, A.; Christophersen, H.; Cucurull, L.; Dahl, B.; et al. NOAA’s Sensing Hazards with Operational Unmanned Technology (SHOUT) Experiment Observations and Forecast Impacts. Bull. Am. Meteorol. Soc. 2020, 101, E968–E987.
- Zipser, E.J.; Twohy, C.H.; Tsay, S.-C.; Thornhill, K.L.; Tanelli, S.; Ross, R.; Krishnamurti, T.N.; Ji, Q.; Jenkins, G.; Ismail, S.; et al. The Saharan Air Layer and the Fate of African Easterly Waves—NASA’s AMMA Field Study of Tropical Cyclogenesis. Bull. Am. Meteorol. Soc. 2009, 90, 1137–1156.
- Braun, S.A.; Kakar, R.; Zipser, E.; Heymsfield, G.; Albers, C.; Brown, S.; Durden, S.L.; Guimond, S.; Halverson, J.; Heymsfield, A.; et al. NASA’s Genesis and Rapid Intensification Processes (GRIP) Field Experiment. Bull. Am. Meteorol. Soc. 2013, 94, 345–363.
- Braun, S.A.; Newman, P.A.; Heymsfield, G.M. NASA’s Hurricane and Severe Storm Sentinel (HS3) Investigation. Bull. Am. Meteorol. Soc. 2016, 97, 2085–2102.
- Montgomery, M.T.; Davis, C.; Dunkerton, T.; Wang, Z.; Velden, C.; Torn, R.; Majumdar, S.J.; Zhang, F.; Smith, R.K.; Bosart, L.; et al. The Pre-Depression Investigation of Cloud-Systems in the Tropics (PREDICT) Experiment: Scientific Basis, New Analysis Tools, and Some First Results. Bull. Am. Meteorol. Soc. 2012, 93, 153–172.
- Doyle, J.D.; Moskaitis, J.R.; Feldmeier, J.W.; Ferek, R.J.; Beaubien, M.; Bell, M.M.; Cecil, D.L.; Creasey, R.L.; Duran, P.; Elsberry, R.L.; et al. A View of Tropical Cyclones from Above: The Tropical Cyclone Intensity Experiment. Bull. Am. Meteorol. Soc. 2017, 98, 2113–2134.
- D’Asaro, E.; Black, P.G.; Centurioni, L.R.; Chang, Y.-T.; Chen, S.S.; Foster, R.C.; Graber, H.C.; Harr, P.; Hormann, V.; Lien, R.-C.; et al. Impact of Typhoons on the Ocean in the Pacific. Bull. Am. Meteorol. Soc. 2014, 95, 1405–1418.
- Wu, C.-C.; Lin, P.-H.; Aberson, S.; Yeh, T.-C.; Huang, W.-P.; Chou, K.-H.; Hong, J.-S.; Lu, G.-C.; Fong, C.-T.; Hsu, K.-C. Dropwindsonde Observations for Typhoon Surveillance near the Taiwan Region (DOTSTAR): An overview. Bull. Amer. Meteor. Soc. 2005, 86, 787–790.
- Chan, P.; Hon, K.; Foster, S. Wind data collected by a fixed-wing aircraft in the vicinity of a tropical cyclone over the south China coastal waters. Meteorol. Z. 2011, 20, 313–321.
- Wong, W.K.; Tse, S.M.; Chan, P.W. Impacts of reconnaissance flight data on numerical simulation of tropical cyclones over South China Sea. Meteorol. Appl. 2013, 21, 831–847.
- Lei, X.T.; Wong, W.K.; Fong, C. A Challenge of the Experiment on Typhoon Intensity Change in Coastal Area. Trop. Cyclone Res. Rev. 2017, 6, 94–97.
- Ito, K.; Yamada, H.; Yamaguchi, M.; Nakazawa, T.; Nagahama, N.; Shimizu, K.; Ohigashi, T.; Shinoda, T.; Tsuboki, K. Analysis and Forecast Using Dropsonde Data from the Inner-Core Region of Tropical Cyclone Lan (2017) Obtained during the First Aircraft Missions of T-PARCII. SOLA 2018, 14, 105–110.
- Rogers, R.; Lorsolo, S.; Reasor, P.; Gamache, J.; Marks, F. Multiscale Analysis of Tropical Cyclone Kinematic Structure from Airborne Doppler Radar Composites. Mon. Weather. Rev. 2012, 140, 77–99.
- Marks, F.D.; Houze, R.A. Inner Core Structure of Hurricane Alicia from Airborne Doppler Radar Observations. J. Atmos. Sci. 1987, 44, 1296–1317.
- Fischer, M.S.; Rogers, R.F.; Reasor, P.D.; Gamache, J. An Analysis of Tropical Cyclone Vortex and Convective Characteristics in Relation to Storm Intensity using a Novel Airborne Doppler Radar Database. Bull. Am. Meteorol. Soc. 2021, 87, 1503–1522, Manuscript in preparation.
- Stern, D.P.; Nolan, D.S. Reexamining the Vertical Structure of Tangential Winds in Tropical Cyclones: Observations and Theory. J. Atmos. Sci. 2009, 66, 3579–3600.
- Hazelton, A.T.; Hart, R.E. Hurricane Eyewall Slope as Determined from Airborne Radar Reflectivity Data: Composites and Case Studies. Weather. Forecast. 2013, 28, 368–386.
- Hazelton, A.T.; Rogers, R.; Hart, R.E. Shear-Relative Asymmetries in Tropical Cyclone Eyewall Slope. Mon. Weather. Rev. 2015, 143, 883–903.
- Lorsolo, S.; Zhang, J.A.; Marks, F., Jr.; Gamache, J. Estimation and Mapping of Hurricane Turbulent Energy Using Airborne Doppler Measurements. Mon. Weather. Rev. 2010, 138, 3656–3670.
- Creasey, R.L.; Elsberry, R.L. Tropical Cyclone Center Positions from Sequences of HDSS Sondes Deployed along High-Altitude Overpasses. Weather. Forecast. 2017, 32, 317–325.
- Hendricks, E.A.; Elsberry, R.L.; Velden, C.S.; Jorgensen, A.C.; Jordan, M.S.; Creasey, R.L. Environmental Factors and Internal Processes Contributing to the Interrupted Rapid Decay of Hurricane Joaquin (2015). Weather. Forecast. 2018, 33, 1251–1262.
- Reasor, P.D.; Rogers, R.; Lorsolo, S. Environmental Flow Impacts on Tropical Cyclone Structure Diagnosed from Airborne Doppler Radar Composites. Mon. Weather. Rev. 2013, 141, 2949–2969.
- Dehart, J.C.; Houze, R.A., Jr.; Rogers, R.F. Quadrant Distribution of Tropical Cyclone Inner-Core Kinematics in Relation to Environmental Shear. J. Atmos. Sci. 2014, 71, 2713–2732.
- Uhlhorn, E.W.; Klotz, B.W.; Vukicevic, T.; Reasor, P.D.; Rogers, R.F. Observed Hurricane Wind Speed Asymmetries and Relationships to Motion and Environmental Shear. Mon. Weather. Rev. 2014, 142, 1290–1311.
- Zhang, J.A.; Dunion, J.P.; Nolan, D.S. In Situ Observations of the Diurnal Variation in the Boundary Layer of Mature Hurricanes. Geophys. Res. Lett. 2020, 47, 2019GL086206.
- Dunion, J.P.; Thorncroft, C.D.; Velden, C.S. The Tropical Cyclone Diurnal Cycle of Mature Hurricanes. Mon. Weather. Rev. 2014, 142, 3900–3919.
- Dunion, J.P.; Thorncroft, C.D.; Nolan, D.S. Tropical Cyclone Diurnal Cycle Signals in a Hurricane Nature Run. Mon. Weather. Rev. 2019, 147, 363–388.
- Rogers, R.; Reasor, P.; Lorsolo, S. Airborne Doppler Observations of the Inner-Core Structural Differences between Intensifying and Steady-State Tropical Cyclones. Mon. Weather. Rev. 2013, 141, 2970–2991.
- Rogers, R.F.; Reasor, P.D.; Zhang, J.A. Multiscale Structure and Evolution of Hurricane Earl (2010) during Rapid Intensification. Mon. Weather. Rev. 2015, 143, 536–562.
- Rogers, R.F.; Reasor, P.D.; Zhang, J.A. Reply to “Comments on ‘Multiscale Structure and Evolution of Hurricane Earl (2010) during Rapid Intensification’”. Mon. Weather. Rev. 2017, 145, 1573–1575.
- Susca-Lopata, G.; Zawislak, J.; Zipser, E.J.; Rogers, R.F. The Role of Observed Environmental Conditions and Precipitation Evolution in the Rapid Intensification of Hurricane Earl (2010). Mon. Weather. Rev. 2015, 143, 2207–2223.
- Nolan, D.S.; Moon, Y.; Stern, D.P. Tropical Cyclone Intensification from Asymmetric Convection: Energetics and Efficiency. J. Atmos. Sci. 2007, 64, 3377–3405.
- Pendergrass, A.G.; Willoughby, H.E. Diabatically Induced Secondary Flows in Tropical Cyclones. Part I: Quasi-Steady Forcing. Mon. Weather. Rev. 2009, 137, 805–821.
- Schubert, W.H.; Hack, J.J. Inertial Stability and Tropical Cyclone Development. J. Atmos. Sci. 1982, 39, 1687–1697.
- Vigh, J.L.; Schubert, W.H. Rapid Development of the Tropical Cyclone Warm Core. J. Atmos. Sci. 2009, 66, 3335–3350.
- Montgomery, M.T.; Zhang, J.A.; Smith, R.K. An analysis of the observed low-level structure of rapidly intensifying and mature hurricane Earl (2010). Q. J. R. Meteorol. Soc. 2014, 140, 2132–2146.
- Smith, R.K.; Montgomery, M.T. The efficiency of diabatic heating and tropical cyclone intensification. Q. J. R. Meteorol. Soc. 2016, 142, 2081–2086.
- Smith, R.K.; Montgomery, M.T.; Van Sang, N. Tropical cyclone spin-up revisited. Q. J. R. Meteorol. Soc. 2009, 135, 1321–1335.
- Stevenson, S.N.; Corbosiero, K.L.; DeMaria, M.; Vigh, J.L. A 10-Year Survey of Tropical Cyclone Inner-Core Lightning Bursts and Their Relationship to Intensity Change. Weather. Forecast. 2017, 33, 23–36.
- Vigh, J.L.; Dorst, N.M.; Williams, C.L.; Stern, D.P.; Uhlhorn, E.W.; Klotz, B.W.; Martinez, J.; Willoughby, H.E. FLIGHT+: The Extended Flight Level Dataset for Tropical Cyclones; Tropical Cyclone Data Project, National Center for Atmospheric Research, Research Applications Laboratory: Boulder, CO, USA, 2016; Available online: (accessed on 17 May 2021).
- Price, C.; Asfur, M.; Yair, Y. Maximum hurricane intensity preceded by increase in lightning frequency. Nat. Geosci. 2009, 2, 329–332.
- Martinez, J.; Bell, M.M.; Vigh, J.L.; Rogers, R.F. Examining Tropical Cyclone Structure and Intensification with the FLIGHT+ Dataset from 1999 to 2012. Mon. Weather. Rev. 2017, 145, 4401–4421.
- Rogers, R.F.; Aberson, S.; Bell, M.M.; Cecil, D.J.; Doyle, J.D.; Kimberlain, T.B.; Morgerman, J.; Shay, L.K.; Velden, C. Rewriting the Tropical Record Books: The Extraordinary Intensification of Hurricane Patricia (2015). Bull. Am. Meteorol. Soc. 2017, 98, 2091–2112.
- Martinez, J.; Bell, M.M.; Rogers, R.F.; Doyle, J.D. Axisymmetric Potential Vorticity Evolution of Hurricane Patricia (2015). J. Atmos. Sci. 2019, 76, 2043–2063.
- Guimond, S.R.; Heymsfield, G.M.; Turk, F.J. Multiscale Observations of Hurricane Dennis (2005): The Effects of Hot Towers on Rapid Intensification. J. Atmos. Sci. 2010, 67, 633–654.
- Hendricks, E.A.; Montgomery, M.T.; Davis, C.A. The role of “vortical” hot towers in the formation of Tropical Cyclone Diana. J. Atmos. Sci. 2004, 1984, 1209–1232.
- Montgomery, M.T.; Nicholls, M.E.; Cram, T.A.; Saunders, A.B. A Vortical Hot Tower Route to Tropical Cyclogenesis. J. Atmos. Sci. 2006, 63, 355–386.
- Nguyen, S.V.; Smith, K.R.; Montgomery, T.M. Tropical cyclone intensification and predictability in three dimensions. Q. J. R. Meteorol. Soc. 2008, 134, 563–582.
- Reasor, P.D.; Montgomery, M.T.; Bosart, L.F. Mesoscale Observations of the Genesis of Hurricane Dolly (1996). J. Atmos. Sci. 2005, 62, 3151–3171.
- Houze, R.A.; Lee, W.-C.; Bell, M.M. Convective Contribution to the Genesis of Hurricane Ophelia (2005). Mon. Weather. Rev. 2009, 137, 2778–2800.
- Bell, M.M.; Montgomery, M.T. Sheared deep vortical convection in pre-depression Hagupit during TCS08. Geophys. Res. Lett. 2010, 37, 5.
- Raymond, D.J.; Sessions, S.L.; Carrillo, C.L. Thermodynamics of tropical cyclogenesis in the northwest Pacific. J. Geophys. Res. Space Phys. 2011, 116.
- Raymond, D.J.; Carrillo, C.L. The vorticity budget of developing typhoon Nuri (2008). Atmos. Chem. Phys. Discuss. 2011, 11, 147–163.
- Gjorgjievska, S.; Raymond, D.J. Interaction between dynamics and thermodynamics during tropical cyclogenesis. Atmos. Chem. Phys. Discuss. 2014, 14, 3065–3082.
- Raymond, D.; Gjorgjievska, S.; Sessions, S.; Fuchs, K. Tropical cyclogenesis and mid-level vorticity. J. South. Hemisphere Earth Syst. Sci. 2014, 64, 11–25.
- Bell, M.M.; Montgomery, M.T. Mesoscale processes during the genesis of Hurricane Karl. J. Atmos. Sci. 2019, 76, 2235–2255.
- Zawislak, J.; Zipser, E.J. Observations of Seven African Easterly Waves in the East Atlantic during 2006. J. Atmos. Sci. 2010, 67, 26–43.
- Davis, C.A.; Ahijevych, D.A. Mesoscale Structural Evolution of Three Tropical Weather Systems Observed during PREDICT. J. Atmos. Sci. 2012, 69, 1284–1305.
- Davis, C.A.; Ahijevych, D.A. Thermodynamic Environments of Deep Convection in Atlantic Tropical Disturbances. J. Atmos. Sci. 2013, 70, 1912–1928.
- Helms, C.N.; Hart, R.E. The Evolution of Dropsonde-Derived Kinematic and Thermodynamic Structures in Developing and Nondeveloping Atlantic Tropical Convective Systems. Mon. Weather. Rev. 2015, 143, 3109–3135.
- Komaromi, W.A. An Investigation of Composite Dropsonde Profiles for Developing and Nondeveloping Tropical Waves during the 2010 PREDICT Field Campaign. J. Atmos. Sci. 2013, 70, 542–558.
- Smith, R.K.; Montgomery, M.T. Observations of the convective environment in developing and non-developing tropical disturbances. Q. J. R. Meteorol. Soc. 2012, 138, 1721–1739.
- Zawislak, J.; Zipser, E.J. Analysis of the Thermodynamic Properties of Developing and Nondeveloping Tropical Disturbances Using a Comprehensive Dropsonde Dataset. Mon. Weather. Rev. 2014, 142, 1250–1264.
- Brammer, A.; Thorncroft, C.D.; Dunion, J.P. Observations and Predictability of a Nondeveloping Tropical Disturbance over the Eastern Atlantic. Mon. Weather. Rev. 2018, 146, 3079–3096.
- Penny, A.B.; Harr, P.A.; Bell, M.M. Observations of a Nondeveloping Tropical Disturbance in the Western North Pacific during TCS-08 (2008). Mon. Weather. Rev. 2015, 143, 2459–2484.
- Molinari, J.; Vollaro, D. Rapid Intensification of a Sheared Tropical Storm. Mon. Weather. Rev. 2010, 138, 3869–3885.
- Rogers, R.F.; Reasor, P.D.; Zawislak, J.A.; Nguyen, L.T. Precipitation Processes and Vortex Alignment during the Intensification of a Weak Tropical Cyclone in Moderate Vertical Shear. Mon. Weather. Rev. 2020, 148, 1899–1929.
- Alvey, G.A.; Fischer, M.S.; Reasor, P.D.; Rogers, R.F.; Zawislak, J.A. Processes underlying the Vortex Repositioning during Dorian’s (2019) Early Stages that increased its favorability for Rapid Intensification. Mon. Weather. Rev. 2021. in review.
More