Your browser does not fully support modern features. Please upgrade for a smoother experience.
Please note this is a comparison between Version 2 by Rita Xu and Version 1 by Maciej Jarzębski.
Dentin-enamel junction (DEJ) is the boundary layer located between dentin and covering enamel. DEJ has a distinct chemical, mechanical and energetical features than surrounding tissues. Its role lies in the transport of materials between dentin and enamel. At the same time DEJ, mainly due to its scalloped structure, protects the dentin against diffusing of mechanical shocks originating at the enamel boundary.
Finally, from our transformation of micro-XRD data results, that the minimum energy of apatite crystals in tooth is located in position of DEJ (Figure 6).
- dental-enamel junction (DEJ)
- chemical microanalysis
- mechanical properties
- optical pattern
1. Introduction
Recently, an increasing number of studies have been focusing on the mechanical properties of the dentin-enamel junction (DEJ). While challenging, micro and nano levels of DEJ analyses provide valuable information. Intermolecular interactions at the nanometer level and interactions of nano- and microcrystalline structures strongly determine the properties of each material, also biological ones. The bone and the dental structures are special examples of nano- and micro-composite materials, of which the constituent particles and macromolecular structures are both of organic and inorganic nature [1,2][1][2].
The dentin-enamel junction has attracted the attention of scientists for years. Dentists and biomaterial science specialists have been interested in the determination of the structure and role of this small fragment of the tooth. The tooth is a partially living organ (role of pulp-dentin complex), strong and well-protected (role of enamel and cementum). In between, the narrow, clearly distinctive layer is located, strictly joining the abovementioned phases. Together with the function of integration of the phases in the tooth structure, this strip avoids expansion of mechanical pressures inside the dentin and prevents sliding of the phases each other. The DEJ layer provides the integrity to the agglomerates of both above phases. As it was explained by Arsenault and Robinson [3] and confirmed by Fang et al. [4], the matrix composed of organic matter plays a basic role in setting the continuity between dentin and enamel crystallites along the DEJ. The dentin and enamel are composed of roughly the same inorganic matter (modified hydroxyapatites), supplemented with an organic matrix, the latter different in quality and quantity in both phases. The need for research on the DEJ and its considerable role results from the awareness that two dissimilar phases should be joined in a durable way to buffer the spread of cracks from the damaged enamel into the dentin zone [5,6][5][6]. At the same time, the possibility of material transport between dentin and enamel through the junction should be guaranteed. The optical images and the sizes of the DEJs are surprisingly uniform across various species from different locations and epochs such as extinct dinosaurs, horses, and recent beaver [7[7][8][9],8,9], with exception of the inverted coloration of dentin and enamel in living tissues and fossils [10]. However, the estimation of the size of the junction in humans varied greatly depending on the kind of tooth as well as the method of observation and measurement, with the data ranging from 2–3 µm up to several tens of µm [11,12,13][11][12][13]. For example, it was found in the study by Gallagher et al. [14] that the DEJ width derived from their micromechanical measurements was in the range 4.7–6.9 µm, while it was 7.6–8.5 µm as estimated from micro-Raman measurements. Another important factor of the variability in DEJ size is the scalloped structure of the tooth which makes the width vary in different places. However, our thesis is that the linear cross-sections through DEJ show self-affinity, i.e., they look extremely similar, independent of the spectral and spatial resolution of the instrument used for the studies. As a rule, a single method of measurement was considered for the estimation of the width. A complex topographical structure was observed at the junction, with some convex structures directed inside the dentin and some cavities in the enamel on the junction-enamel boundary [13,15][13][15]. The spread of the parallel organic fibrils of collagen I can be detected via SEM observations [16]. The fibrils expand from the dentin towards the dentin-enamel junction where they enter at a shallow depth within the enamel zone. The problem in studies on DEJ is that the layer cannot be isolated from the enamel and the dentin.
The progress in atomic force microscopy (AFM) associated with nano-indentors has enabled measurements of the microhardness and elastic modulus [17[17][18][19][20],18,19,20], while an attachment of the nanoscratch tester provided the opportunity to measure the friction coefficient on the border of the DEJ-dentin [21]. There have been attempts to maps the results of nanoindentation [22[22][23],23], regardless of the challenges due to the small width of the DEJ. It is worth considering that AFM, although a typical nanoscale device, was applied at a microscale level in the measurements for microhardness and elastic modulus, except in the investigations described by Habelitz et al. [20]. It was due to the fact that the mechanical tests had damaged the material structure in the measured area on a micrometer range. Each next undisturbed measurement was only possible in a location some micrometers far away from the previous trial. The application of scanning acoustic microscopy (SAM) seems to be a non-damaging alternative for the mentioned mechanical tests [24]; however, it depends on spatial resolution of the method which is important for studies of DEJ.
2. Cross-Sectional Outline of the DEJ
We have collected three sets of results from the electron probe microanalysis (EPMA), µ-particle induced X-Ray emission (PIXE), and µ-Raman measurements. The results are presented in Figure 1, Figure 2 and Figure 3, respectively. All the scans were carried out at distances up to 250 µm, centered around the DEJ, to cover fully the DEJ zone together with surrounding regions of enamel on one side and dentin on the other side. Scanning for P, Ca, C, Na, and Mg was possible with EPMA, using the Kα1 lines of the elements and for carbon-Kα. Here, in Figure 1a, we could observe the clear anticorrelation between the concentrations of P and C in the enamel layer, the DEJ zone, and the first layer of the dentin, which testifies to mainly the inorganic, carbonate form of the C in this zone. At the same time, the levels of Ca concentrations seemed to be stable. Where the carbonate ion was included in a greater amount into the apatite structure, an automatic deficit of the phosphate ions occurred [35][25], and it could testify to the “B-type” substitution of CO32− ion in the previous PO43− site [24]. One can suppose that it occurred mainly in a direction oblique to the “c” axis of the apatite crystal, i.e., on a × a plane. This relationship is especially pronounced in the first layer of the enamel, adhering to the DEJ. The mentioned relationship is much more obscure in the deeper dentin locations, due to the mainly organic form of the carbon here. One can observe very clear oscillations in the composition of magnesium along the whole scan length, with consecutive maxima distant by more or less 50 µm. In the dentin phase, Mg seems to be anticorrelated with the C signal, except the DEJ region, and it is shown in Figure 1b. Similarly, Na content also shows oscillations, although in locations other than those of Mg. Figure Figure 11c shows the delimitation of the DEJ from these measurements, emphasized by the same delimitation derived from the optical microscope. There is an occasion to define the size of DEJ. Here, we estimate that such delimitation should be set between the halves of slopes on the enamel/DEJ and DEJ/dentin boundaries. Essentially, although not always, the half of the slope is equivalent to the inflexion points on the relevant curves (e.g., on the linear scan of Ca concentrations). It can be observed in Figure 1c, where crossbeam shows the width of DEJ touches on both ends the deflection points on optical, P and C curves.
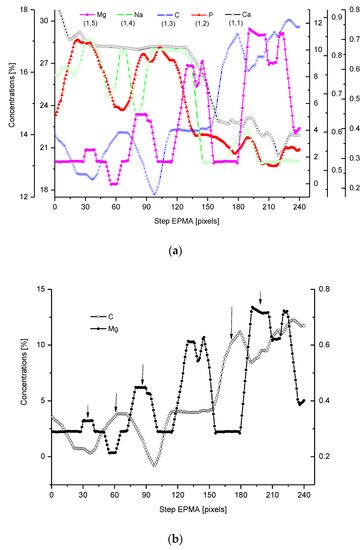
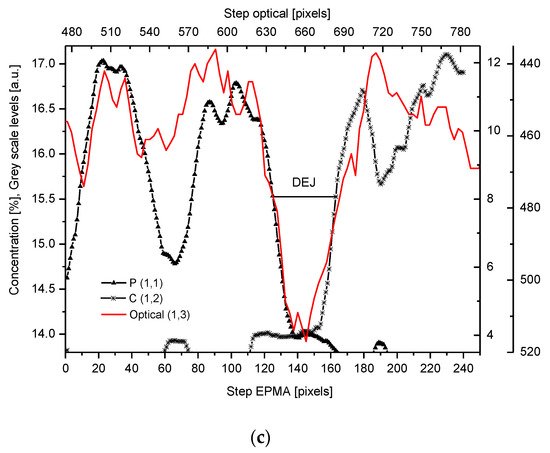
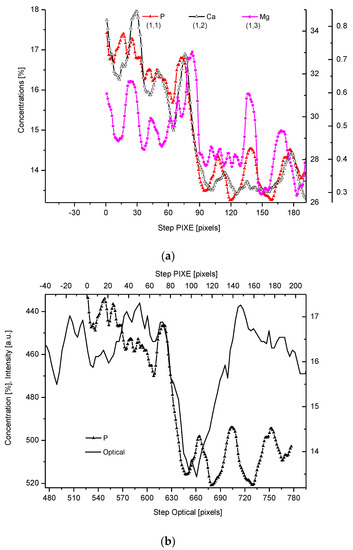
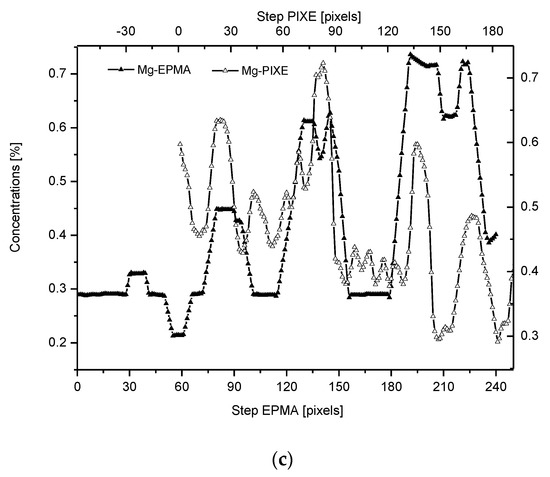
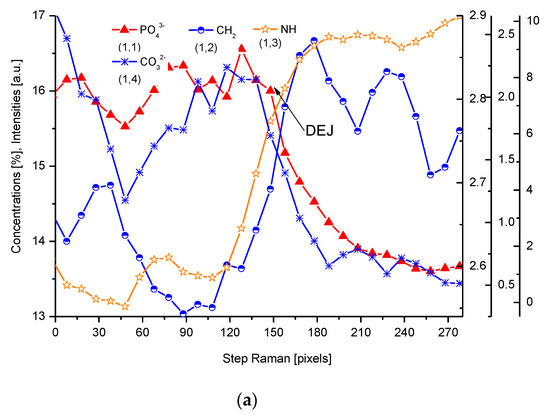
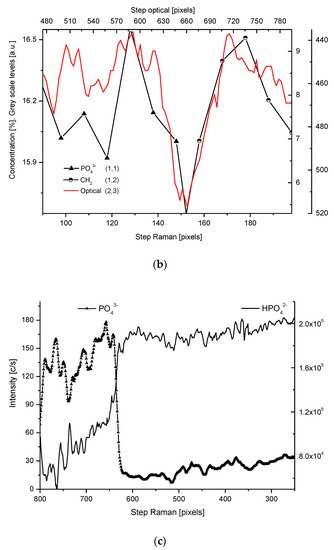
Figure 1. (a) Results of EPMA measurements along the DEJ zone. The direction is from the enamel (left) towards the dentin and always the same direction is preserved in the next figures (where relevant), and the length is equal to 250 µm. 1 step = 1 µm. (b) Sequence of C and Mg variability, in majority cases inversely directed. (c) Outline of the DEJ space with optical signal and in parallel by two spectral signals of P and C. On multiscale figures the numerical markers were introduced where the first number denotes x-axes, calculated in the system down-up and the second one y-axes, calculated from left to right side of the figure.
Figure 2. (a) Results of µ-PIXE measurements. 1 step = 1.25 µm. (b) Outline of the DEJ space with optical signal and with P signal, for left boundary only; please observe missing boundary DEJ-dentin due to the air path of measurements and inability of detection of carbon. (c) Parallelism of Mg measurements with the use of EPMA and µ-PIXE.
Figure 3. (a) Results of µ-Raman measurements around the DEJ. PO43−-ν1 oscillation; CH2-ν symmetric oscillation; NH line; CO32−, sub. B; 1 step = 1.61 µm; (b) Outline of DEJ space with optical and Raman PO43− and CH2 signals. (c) Divergent spatial profiles of PO43− and HPO42− ions, with visible DEJ.
The PIXE scans of P, Ca, and Mg were made (Figure 2). One should notice the very clear variable periodic oscillations in the P and especially Mg signals, the latter distant from one another by about 50 µm. Once more, the clear local maximum could be observed in the first layer of enamel, adhering to the DEJ. We can note some discrepancies between P and Ca signals, reaching 15 and 45 µm on the length axis. They can be attributed to the elevated levels of CO32− ions, not detected here due to the X-Ray detection threshold of the Si (Li) detector window. The profile of phosphor was superimposed on the optical profile (Figure 2b). This time, only the left side of the DEJ was represented among chemical signals, since the C signal was not observed. Both in the EPMA and PIXE measurements, the Mg elevated concentrations were located even beyond the slope of Ca concentration towards the DEJ, thus, in half of the DEJ zone (Figure 2c). If one compares the elemental scans from different methods, the correlation between the signals of the same element measured often fails a little. It is not unexpected since the signals were collected along the lines shifted by micrometers; they were collected from different depths (PIXE allows collecting signals from depths which are an order of magnitude greater than in EPMA). However, the drop/growth of the measured values on the DEJ-enamel and DEJ-dentin boundaries is a very stable factor in this environment.
For µ-Raman, the lines of PO43− (960 cm−1), C-H (~2935 cm−1), CO32−, substitution B (1086 cm−1), and NH (3470 cm−1) were detected. The two first of abovementioned lines, necessary for delimitation of the DEJ, were compared with the optical profile (Figure 3). Interestingly, profiles of PO43− and HPO42− lines are completely opposite (Figure 3c). Hence, we might delimit the DEJ using those two lines.
The collection of chemical results by the use of three different methods is not a question of trivial repetition. The EPMA and PIXE measurements inform us about the inorganic constituents of the sample while µ-Raman gives some information about the inorganic (phosphates, carbonates) and the organic (CH2, NH2) components. The PIXE data are collected from deeper layers (useful signal range spans from the surface up to ~30 µm) than the data from EPMA (~3 µm) and are not so disturbed by the surface roughness. In addition, a greater number of trace and/or heavier elements can be detected more easily. Comparing the repeatability of the results of analyses made by different methods was not the least important aim.
The quality of the data was highest for µ-PIXE measurements, but due to the X-Ray detection threshold of the detector, the measuring of C and thus the delimitation of the DEJ-dentin boundary was impossible. Different data were used to supplement one another. None of the results were repeated in strictly the same location on a particular sample, due to different technical and preparative difficulties. The lateral deviations of scans were estimated as <3 µm. Thus, the scans express the self-affinity rather than the very rigorous identity of results.
One of the results is the observation of clear coincidence between the optical, microchemical, and micromechanical images of the DEJ. The DEJ differs clearly in its optical characteristics both from the enamel and the dentin (e.g., Figure 4b). It is undoubtedly promising, since the optical observation is incomparably easier than by other applied methods and is easy to use in diagnostics.
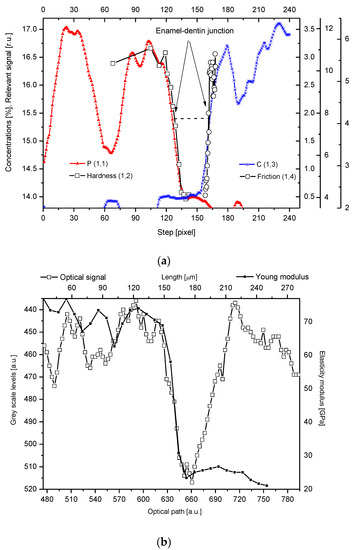
Figure 4. (a) Parallel delimitation of the DEJ zone with the EPMA measurements and micromechanical results. The micro-hardness and micro-friction results are adopted from Marshall et al. [12]. The horizontal dashed line delimits the width of the DEJ. (b) Superposition of Young modulus on the optical outline of DEJ. (c) Superposition of changes in density from Weatherell [35][25] on P measurement from PIXE.
Some tendency can be observed for the widening of the DEJ in the images from the optical microscope, but it is probably associated with the poor level of the beam collimation in such a device. The beam collimation is the ultimate limit for the accuracy in the DEJ delimitation. We tried to compare our chemical and optical results with the available results of the ultrasonographic studies on the DEJ [36,37][26][27]. Some quite encouraging convergence of the general shapes of the DEJ was observed. On the other hand, the significant widening of the zone in the resonant ultrasound approach is discouraging. We understand that it results from the poor collimation and scattering of the ultrasound beam.
3. Discussion of DEJ Model
Our studies clarified some of the controversies concerning the DEJ. We suggested the following model of the junction, taking the results of our investigations into account and comparing them with the micromechanical results by Marshall et al. [12], Fong et al. [11], and finally, with our optical results. It is a zone with a width in the range of 15–35 µm (see Figure 1, Figure 2 and Figure 3, the split between P and C slopes in the halves of heights). Our results, although scattered for different samples (here not shown), were kept in the mentioned range. In our opinion, although it is a scatter in the estimation of the width, there is no support to the much lower widths suggested by Schultze et al. [25][28] and Balooch et al. [23]. Moreover, the higher values often result from the too great measurement steps (insufficient spatial resolution), as in an otherwise very interesting paper by Kolmas et al. [38][29]. The zone is of a complex structure. One can imagine both the existence of the enamel-DEJ boundary (it can be called the frontal wall) and a second boundary DEJ–dentin (the rear wall) and the middle zone—in-between. Therefore, not only the DEJ is different from the bulk enamel and dentin, but the adhering layers of enamel and dentin have their specific features as well. The DEJ imagination is shown in Figure 4. This figure is supported by our chemical studies from EPMA and the results of Marshall et al. [12] (hardness and friction)—tailored to our data. Please note that even with such mixed data (the teeth were taken from different European and American populations; ours are for molars, other for incisors) the variables can be matched very easily to one another. It acts as the self-affinity rule. From the enamel side, a rapid drop in the hardness occurs. This drop certainly coincides with the sudden decrease in the P and Ca (not shown here) concentrations. The drop in the Ca concentration is about 4% and in P about 2% over the distance of ~15 µm and corresponds to a drop in hardness by ~2.75 GPa over the same distance of 15 µm, and in a reduction of the elasticity modulus by ~50 GPa, as shown in Figure 4b (see Marshall et al. [12], their Figure 7). The density data, taken from Weatherell [35][25] and Anderson et al. [39][30] can also be tailored to our results which it is shown in Figure 4c.
Here, we invoke Figure 3 from our previous paper [40][31]. We presented the relative influence of Ca drop on the mechanical parameters. Figure 5 in recent contribution resembles to much extent Figure 3 in the mentioned paper. The order of devastation occurring when the relative content of Ca diminishes is the same: density < Young modulus < hardness, but the degree of devastation is much greater for the DEJ. One must remember that the point of convergence of curves for relative values, which is equal to one, is another for the DEJ (it is point in enamel very close to DEJ) and another for enamel (it is point very close to the enamel–air boundary). Nevertheless, the influence of Ca drop is much more serious in the enamel–DEJ boundary than inside whole enamel and it occurs on a much smaller distance.
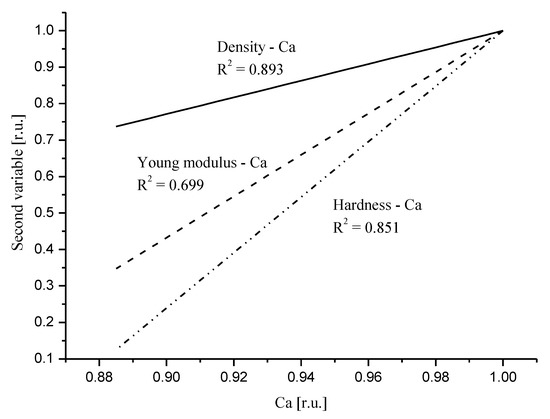
Figure 5. Comparison of the linear fits to the correlation relationships between relative values of density and Ca (solid line); Young modulus and Ca (dotted line); hardness and Ca (dot-drop line). Relevant equations are: RDen = −1.27 + 2.287 × [RCa]; RYM = −4.68 + 5.678 × [RCa]; RH = −6.61 + 7.609 × [RCa].
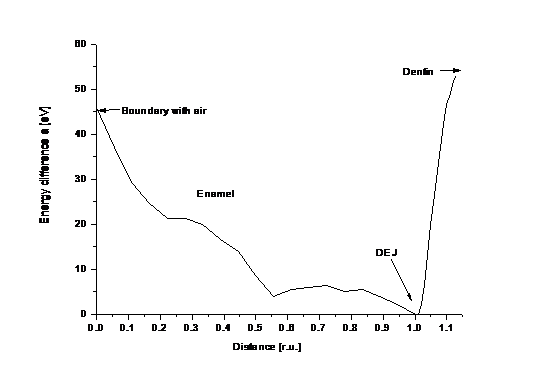
Figure 6.
Energetic profile of whole enamel, DEJ and fragment of dentin.
References
- Sharma, V.; Rani, K.; Roychoudhury, A.; Chawla, A.; Nikolajeff, F.; Kumar, S. Novel insights into regulation of human teeth biomineralization: Deciphering the role of post-translational modifications in a tooth protein extract. Int. J. Mol. Sci. 2019, 20, 4035.
- Gil-Bona, A.; Bidlack, F.B. Tooth enamel and its dynamic protein matrix. Int. J. Mol. Sci. 2020, 21, 4458.
- Arsenault, A.L.; Robinson, B.W. The dentino-enamel junction: A structural and microanalytical study of early mineralization. Calcif. Tissue Int. 1989, 45, 111–121.
- Fang, P.-A.; Lam, R.S.K.; Beniash, E. Relationships between dentin and enamel mineral at the dentino-enamel boundary: Electron tomography and high-resolution transmission electron microscopy study. Eur. J. Oral Sci. 2011, 119, 120–124.
- Lin, C.P.; Douglas, W.H. Structure-property relations and crack resistance at the bovine dentin-enamel junction. J. Dent. Res. 1994, 73, 1072–1078.
- Imbeni, V.; Kruzic, J.J.; Marshall, G.W.; Marshall, S.J.; Ritchie, R.O. The dentin-enamel junction and the fracture of human teeth. Nat. Mater. 2005, 4, 229–232.
- Hoppe, K.A.; Stover, S.; Pascoe, J.; Amundson, R. Tooth enamel biomineralization in extant horses: Implications for isotopic microsampling. Palaeogeogr. Palaeoclimatol. Palaeoecol. 2004, 206, 355–365.
- Rinaldi, C.E.; Cole, T.M. Environmental seasonality and incremental growth rates of beaver (Castor canadensis) incisors: Implications for palaeobiology. Palaeogeogr. Palaeoclimatol. Palaeoecol. 2004, 206, 289–301.
- Stanton, T.K.J.; Carlson, S.J. Microscale δ18O and δ13C Isotopic Analysis of an Ontogenetic Series of the Hadrosaurid Dinosaur Edmontosaurus: Implications for Physiology and Ecology; Elsevier: Amsterdam, The Netherlands, 2004; Volume 206, ISBN 1530752035.
- Kohn, M.J.; Schoeninger, M.J.; Barker, W. Altered states: Effects of diagenesis on fossil tooth chemistry. Geochim. Cosmochim. Acta 1999, 63, 2737–2747.
- Fong, H.; Sarikaya, M.; White, S.N.; Snead, M.L. Nano-mechanical properties profiles across dentin-enamel junction of human incisor teeth. Mater. Sci. Eng. C 1999, 7, 119–128.
- Marshall, G.W.J.; Balooch, M.; Gallagher, R.R.; Gansky, S.A.; Marshall, S.J. Mechanical properties of the dentinoenamel junction: AFM studies of nanohardness, elastic modulus, and fracture. J. Biomed. Mater. Res. 2001, 54, 87–95.
- Xu, C.; Yao, X.; Walker, M.P.; Wang, Y. Chemical/molecular structure of the dentin-enamel junction is dependent on the intratooth location. Calcif. Tissue Int. 2009, 84, 221–228.
- Gallagher, R.R.; Balooch, M.; Balooch, G.; Wilson, R.S.; Marshall, S.J.; Marshall, G.W. Coupled nanomechanical and raman microspectroscopic investigation of human third molar DEJ. J. Dent. Biomech. 2010, 1.
- Gallagher, R.R.; Demos, S.G.; Balooch, M.; Marshall, G.W.J.; Marshall, S.J. Optical spectroscopy and imaging of the dentin-enamel junction in human third molars. J. Biomed. Mater. Res. A 2003, 64, 372–377.
- Lin, C.P.; Douglas, W.H.; Erlandsen, S.L. Scanning electron microscopy of type I collagen at the dentin-enamel junction of human teeth. J. Histochem. Cytochem. 1993, 41, 381–388.
- Meredith, N.; Sherriff, M.; Setchell, D.J.; Swanson, S.A. Measurement of the microhardness and Young’s modulus of human enamel and dentine using an indentation technique. Arch. Oral Biol. 1996, 41, 539–545.
- Kinney, J.H.; Balooch, M.; Marshall, S.J.; Marshall, G.W.J.; Weihs, T.P. Hardness and Young’s modulus of human peritubular and intertubular dentine. Arch. Oral Biol. 1996, 41, 9–13.
- Zheng, J.; Zhou, Z.R.; Zhang, J.; Li, H.; Yu, H.Y. On the friction and wear behaviour of human tooth enamel and dentin. Wear 2003, 255, 967–974.
- Habelitz, S.; Marshall, S.; Marshall, G.; Balooch, M. Mechanical properties of human dental enamel on the nanometre scale. Arch. Oral Biol. 2001, 46, 173–183.
- Habelitz, S.; Marshall, S.J.; Marshall, G.W.J.; Balooch, M. The functional width of the dentino-enamel junction determined by AFM-based nanoscratching. J. Struct. Biol. 2001, 135, 294–301.
- Cuy, J.L.; Mann, A.B.; Livi, K.J.; Teaford, M.F.; Weihs, T.P. Nanoindentation mapping of the mechanical properties of human molar tooth enamel. Arch. Oral Biol. 2002, 47, 281–291.
- Balooch, G.; Marshall, G.W.; Marshall, S.J.; Warren, O.L.; Asif, S.A.S.; Balooch, M. Evaluation of a new modulus mapping technique to investigate microstructural features of human teeth. J. Biomech. 2004, 37, 1223–1232.
- Marangos, O.; Misra, A.; Spencer, P.; Bohaty, B.; Katz, J.L. Physico-mechanical properties determination using microscale homotopic measurements: Application to sound and caries-affected primary tooth dentin. Acta Biomater. 2009, 5, 1338–1348.
- Weatherell, J.A. Composition of dental enamel. Br. Med. Bull. 1975, 31, 115–119.
- Culjat, M.; Singh, R.S.; Yoon, D.C.; Brown, E.R. Imaging of human tooth enamel using ultrasound. IEEE Trans. Med. Imaging 2003, 22, 526–529.
- Kinney, J.H.; Gladden, J.R.; Marshall, G.W.; Marshall, S.J.; So, J.H.; Maynard, J.D. Resonant ultrasound spectroscopy measurements of the elastic constants of human dentin. J. Biomech. 2004, 37, 437–441.
- Schulze, K.A.; Balooch, M.; Balooch, G.; Marshall, G.W.; Marshall, S.J. Micro-Raman spectroscopic investigation of dental calcified tissues. J. Biomed. Mater. Res. A 2004, 69, 286–293.
- Kolmas, J.; Kalinowski, E.; Wojtowicz, A.; Kolodziejski, W. Mid-infrared reflectance microspectroscopy of human molars: Chemical comparison of the dentin-enamel junction with the adjacent tissues. J. Mol. Struct. 2010, 966, 113–121.
- Anderson, P.; Elliott, J.C.; Bose, U.; Jones, S.J. A comparison of the mineral content of enamel and dentine in human premolars and enamel pearls measured by X-ray microtomography. Arch. Oral Biol. 1996, 41, 281–290.
- Kuczumow, A.; Nowak, J.; ChaŁas, R. Microchemical and structural regular variability of apatites in “overbuilt” enamel and dentin of human molar teeth. Radiat. Phys. Chem. 2011, 80, 1129–1134.
More