Your browser does not fully support modern features. Please upgrade for a smoother experience.
Please note this is a comparison between Version 1 by Shaker A Mousa and Version 3 by Dean Liu.
Integrin αvβ3 receptors are overexpressed in different tumors and their associated neovascularization and hence, represent a potential cancer target.
- anticancer
- glioblastoma
- anti-angiogenesis
- thyrointegrin αvβ3
- PEG
- triazole tetrac
- P-bi-TAT
- P-m-TAT
- tetrac
1. Introduction
Glioblastoma multiforme (GBM) is the most aggressive brain tumor with a high mortality rate [1][2][1,2]. Due to the severity of the disease, patients survive an average of only 12 months, and most do not survive beyond two years. Standard treatments of surgery, radiation, and conventional chemotherapy can increase the five-year survival rate to 5–8% [3][4][3,4]. Overall survival has been improved in clinical trial populations within the last few years from 12 months to 16 months. However, tumor heterogenicity and resistance mechanisms are expressed by GBM, which limits the effectiveness of therapeutic interventions.
Integrin αvβ3, a heterodimeric cell surface adhesion membrane receptor, is overexpressed in GBM at the tumor margins (invasive regions) and tumor-relevant blood vessels [5]. It has a high affinity for the protein components of the extracellular matrix (ECM) and plays an important role in cell invasion and motility, allowing for crosstalk between the cell and the surrounding stroma as well as with adjacent vascular growth factor receptors. The arginine–glycine–aspartate (RGD) recognition site on integrins αvβ3 is involved in ECM protein interactions and may activate signal transduction pathways. Thus, integrin αvβ3 plays a pleiotropic role in GBM, and the RGD domain is a therapeutic target for antitumor products, which has allowed for the development of various RGD-based antagonists, conjugates, and nanoparticles [6][7][6,7].
The extracellular domain of integrin αvβ3 bears a novel small molecule binding site that exclusively recognizes thyroid hormones and thyroid hormone analogs [8][9][8,9]. These analogs include tetraiodothyroacetic acid (tetrac), a deaminated derivative of I-thyroxine (T4), and a “thyrointegrin” antagonist that displaces I-triiodothyronine (T3) and T4 from the thyroid hormone analog receptor site on integrin αvβ3 and also initiates a number of intracellular actions via the integrin in the absence of T4 [9][10][11][9,10,11]. Our several previous studies showed that the nano-diamino-tetrac, (NDAT) based on poly(lactic-co-glycolic acid) (PLGA) that is conjugated to tetrac, have improved activity compared to tetrac alone at the integrin in terms of reduced cancer cell proliferation and induced apoptosis. These anticancer actions primarily reflect changes in the transcription of specific genes [12][13][14][12,13,14].
RWesearchers recently synthesized a high affinity thyrointegrin αvβ3 antagonist, P-bi-TAT, a tetrac-based inhibitor with a triazole moiety on the outer ring of tetrac and covalently conjugated to a polymer via poly(ethylene glycol) (PEG, P) PEGylation (Compound 1, Figure 1A). Thus, Compound 1 is a dimer, or bis triazole tetrac (TAT); P-bi-TAT has two tetrac molecules covalently bound via triazoles to PEG4000 (MW = 4000). It is effective against xenografts of human GBM. PEG modification affords a long-circulating property by evading macrophage-mediated uptake and removal from the systemic circulation. A PEG spacer allows the ligand to remain in the systemic circulation and provides flexibility to the attached ligand for efficient interaction with its target [11]. In spite of high binding to the αvβ3 receptor and favorable anticancer effects, these long polydisperse PEG conjugates of the molecule showed analysis issues in quality control and bioanalytical assays and also difficulty in its synthesis and scalability. Hence, in order to overcome these above issues, we synthesized a smaller PEG with a molecular weight of 1600 (Compound 2, Figure 1B) and removed one TAT molecule of P-bi-TAT to form a mono-TAT agent, the P-m-TAT molecule (Compound 3, Figure 1C), retaining the excellent solubility and potency of Compound 1.
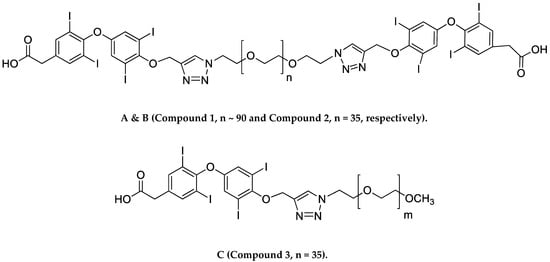
Figure 1. Schematic structures of (A) P4000-bi-TAT (Compound 1), (B) P1600-bi-TAT (Compound 2), and (C) P1600-m-TAT (Compound 3). In the structure, ‘n’ and ‘m’ indicate the PEG size. (A,B) differ in PEG size, with a molecular weight of 4000 (n ~ 90) and 1600 (n = 35), respectively.
2. Effect of TATs on Cell Proliferation of U87-Luc Cells
To compare the in vitro anticancer activity of the three TATs, an MTT assay was used. As shown in Figure 24, we evaluated the effects of these compounds on the growth of human glioblastoma U87-luc cell lines and primary cells (GBM 101813, GBM 021913). In the MTT assay, the U87-luc cell line showed decreases in proliferation of 56%, 59%, and 58% at 24 h, and 42%, 44%, and 43% at 48 h, with 100 μM of Compounds 1, 2, and 3, respectively compared to the untreated cells (Figure 24C,D). For the GBM 101813, cells with 100 μM of Compounds 1, 2, and 3 showed decreases in proliferation of 52%, 54%, and 55% at 24 h, and 41%, 43%, and 45% at 48 h, respectively (Figure 24C,D). Further, GBM 021913 showed decreases in cell proliferation of 54%, 57%, and 57% at 24 h, and 48%, 52%, and 50% with 100 μM of Compounds 1, 2, and 3 compared to the untreated cells (Figure 24E,F).
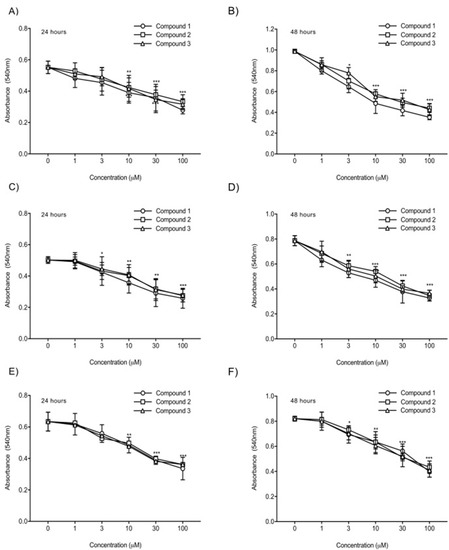
Figure 24. Cell proliferation assay. U87-luc and primary (GBM 101813, GBM 021913) cells were incubated with Compounds 1, 2, and 3 at different concentrations (1, 3, 10, 30, and 100 µM) for 24 h and 48 h and were measured with MTT assay. (A,B) U87-luc; (C,D) GBM 101813; (E,F) GBM 021913. Values are presented as the mean ± S.D of three independent experiments. *** p < 0.001, ** p < 0.01, * p < 0.05 compared to the control (PBS).
3. Anti-Angiogenesis Efficacy of TATs
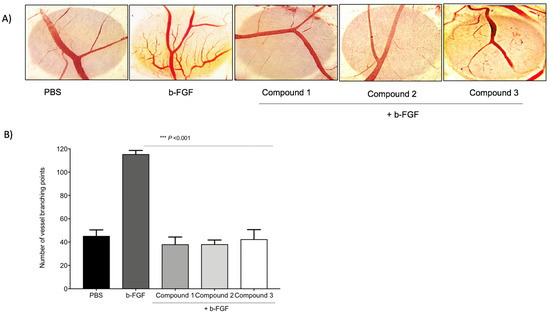
To compare the anti-angiogenic efficacy of the three TATs, a CAM assay was used. As shown in Figure 35, a basic fibroblast growth factor (FGF2 or b-FGF) was used to stimulate angiogenesis, and then the compounds were administrated. Compounds 1, 2, and 3 showed maximum inhibition of the number of vessel branch points (angiogenesis) at 1 µg/CAM. No statistically significant changes in the percentages of inhibition of angiogenesis were observed between the three TATs. The TAT molecules also showed maximum inhibition of angiogenesis in the presence of different growth factors (VEGF, HGF, and in combination).
Figure 35. Inhibition of angiogenesis in chick chorioallantoic membrane (CAM). With the development of small new blood vessels, typical neovascularization was visible with CAM assay. (A) Images represent the inhibition of the b-FGF (10 ng/CAM)-induced angiogenesis by Compounds 1, 2, and 3 at 1 µg/CAM. (B) Data illustrate the decrease of compounds. Values are presented as the mean ± S.D *** p < 0.001, compared to the control.
4. Antitumor Effect
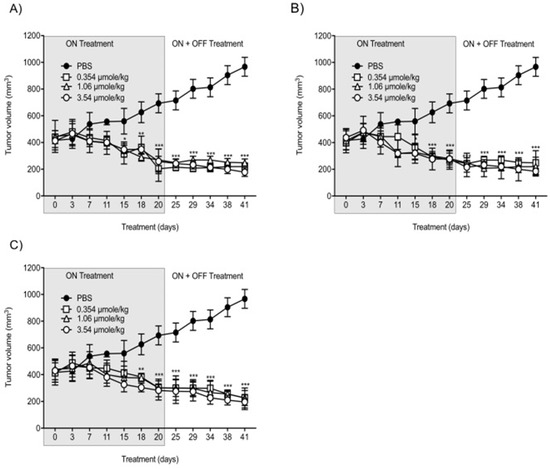
With the intent to study the in vivo antitumor efficacies of Compounds 1, 2, and 3 on tumor growth, U87-luc glioblastoma cells were implanted in each flank of the animals, and then the mice were treated daily for 21 days with Compounds 1, 2, and 3. The tumor volumes significantly decreased when treated with Compounds 1, 2, and 3 at 0.354, 1.06, and 3.54 µmole/kg, respectively, compared to the controls (Figure 46). All the treatments at 0.354, 1.06, and 3.54 µmole/kg significantly reduced the tumor weight after daily treatment for 21 days. The xenograft weights and tumor cell viabilities decreased by >90% with all doses (ON Treatment, *** p < 0.001) compared to the control (Figure 57A). In the second group, Compound 1-treated mice, the xenografts were observed for an additional 21 days with no further treatment (ON Treatment + OFF Treatment). There was no re-growth of tumors in these groups of animals and the absence of cell viability persisted (Figure 57B). Similar results were obtained from mice treated daily with Compounds 2 and 3 for 21 days (ON Treatment) and another group treated daily for 21 days followed by discontinuation for 21 days (ON + OFF Treatment).
Figure 46. Anti-cancer effects of Compounds 1, 2, and 3 on tumor volumes. (A) Compound 1; (B) Compound 2; (C) Compound 3. U87-luc glioblastoma cells implanted mice were treated daily with Compounds 1, 2, and 3 (ON Treatment) for 21 days, and in the second group, the xenografts were observed for an additional 21 days with no further treatment (ON Treatment + OFF Treatment). Values are presented as the mean tumor volume (mm3) ± S.D. *** p < 0.001, ** p < 0.01, * p < 0.05, compared to the control.
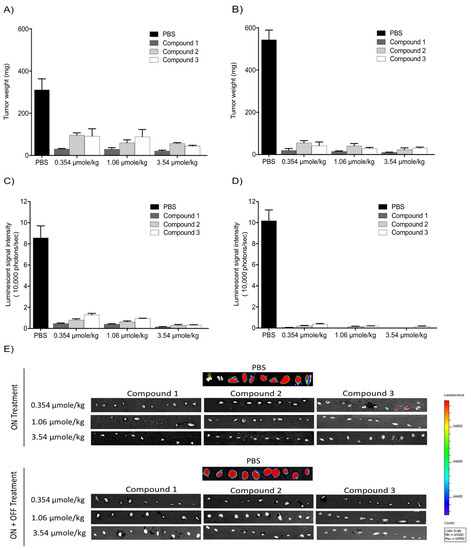
Figure 57. Antitumor effects of Compounds 1, 2, and 3 on xenografts. (A,B) Tumor weight; (C,D) luminescence signals in xenografts; (E) representative IVIS images of luminescent signals in tumors. Values are presented as the mean ± S.D.
The in vivo luminescent signals of viable cancer cells were quantified (photons/second) for the different groups using a Xenogen-IVIS Spectrum. A statistically significant (p < 0.001) decrease of viable U87-Luc cells was observed in groups treated with TATs compared to the control. No significant differences were observed when comparing the treated groups (Figure 57C,D).
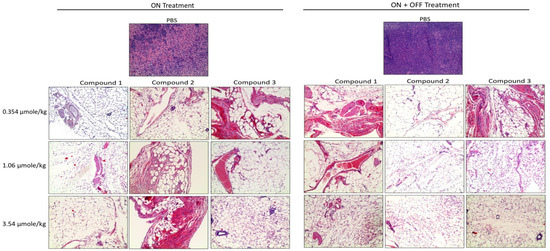
Further, the histological sections obtained from the U87 xenografts were used to evaluate the antagonist treatments on cell proliferation. A large necrotic area was observed in the tumor masses from all doses of the treatment groups. However, there was no significant difference between the three antagonist treatments (Figure 68).
Figure 68. Histopathological images of H&E staining of glioblastoma xenografts in nude mice treated with Compounds 1, 2, and 3. The scale bar is 10×. Complete infiltration with the malignant cells ~100% was observed in the controls. In the treatment groups, necrosis, and hyalinization > 90% were observed.
5. Transthyretin (TTR) Binding Assay
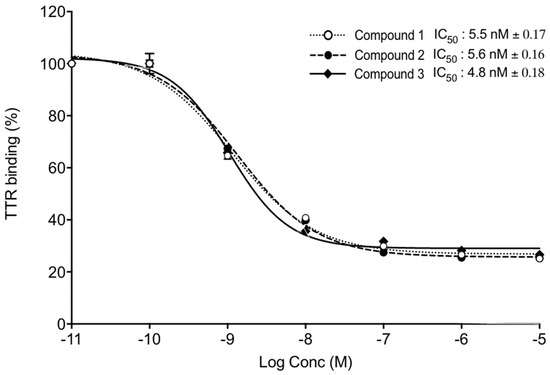
Further, we tested the ability of TTR binding using competitive fluorescence binding assay. FITC-T4 and TTR were mixed in a 96-well plate and incubated with different concentrations of Compounds 1, 2, and 3, and the intensity of fluorescence was measured at 518 nm. The IC50 values of Compounds 1, 2, and 3 were 5.5 nm, 5.6 nm, and 4.8 nm, respectively (Figure 7 9).
Figure 79. TTR binding assay. TTR and FITC-T4 were mixed and incubated with different concentrations of Compounds 1, 2, and 3. Competitive fluorescence binding curves (mean IC50 ± SD) of three independent experiments. x-axis shows Log Concentrations from −11 to −5.
(References would be added automatically after the entry is online)