A computer-aided diagnosis (CAD) expert system is a powerful tool to efficiently assist a pathologist in achieving an early diagnosis of breast cancer. This process identifies the presence of cancer in breast tissue samples and the distinct type of cancer stages. In a standard CAD system, the main process involves image pre-processing, segmentation, feature extraction, feature selection, classification, and performance evaluation. Breast cancer can be distinguished as benign (non-cancerous) and malignant (cancerous/metastatic) tumours. Benign tissue refers to changes in normal tissue of breast parenchyma, which does not relate to the development of malignancy . Contrarily, malignant tissue can be categorised into two types: in-situ carcinoma and invasive carcinoma.
- machine learning
- deep learning
- computer aided diagnosis
- breast cancer
- histopathology images
- classification
- medical imaging
1. Introduction
‘Cancer’ is a term used when a cell divides abnormally or uncontrollably, which can happen in various parts of the body. Amongst the distinct types of cancer, the most common type of cancer happening in females is breast cancer. According to the World Health Organisation (WHO), breast cancer is the most frequent cancer among women, affecting 2.1 million women each year. About 627,000 women died from breast cancer in 2018, which accounted for around 15% of all cancer deaths among women [1].
However, it has been proven that an early detection of breast cancer can significantly increase the chances of successful treatment plan and ensure a long-term survival of the patients [2]. According to the most common procedure, a ‘two-week wait’ is the procedure to diagnose breast cancer [3]. The standard procedure to diagnose breast cancer by pathologists usually requires extensive microscopic assessment. Therefore, having an automated solution like a computer-aided diagnosis (CAD) system not only contributes to an easier diagnostic process, but also reduces the subjectivity in diagnosis.
However, it has been proven that an early detection of breast cancer can significantly increase the chances of successful treatment plan and ensure a long-term survival of the patients [3]. According to the most common procedure, a ‘two-week wait’ is the procedure to diagnose breast cancer [2]. The standard procedure to diagnose breast cancer by pathologists usually requires extensive microscopic assessment. Therefore, having an automated solution like a computer-aided diagnosis (CAD) system not only contributes to an easier diagnostic process, but also reduces the subjectivity in diagnosis.
With the advanced development of artificial intelligence, many machine learning techniques have been applied for CAD systems. This technique can potentially outperform humans and learn more efficiently with time, therefore integrating machine learning in diagnosis can supply useful knowledge to assist pathologists in evaluating and analysing enormous amounts of medical data [4]. It could also speed up the process due to the capability to process large data much faster than manual diagnosis by a pathologist [4]. Breast cancer diagnosis can be considered as a classification problem in machine learning, in which the result indicates which class of cancer it belongs to.
Conventionally, several popular machine learning algorithms applied to classification problems include naïve Bayes [5], artificial neural network [6], support vector machine (SVM) [7], and many more. Recently, deep learning methods were introduced to improve on conventional machine learning methods by extracting information automatically as part of the learning process, leading to undoubtedly better solutions [8]. Deep learning was shown to outperform state-of-the-art methods in many fields of medical imaging analysis tasks.
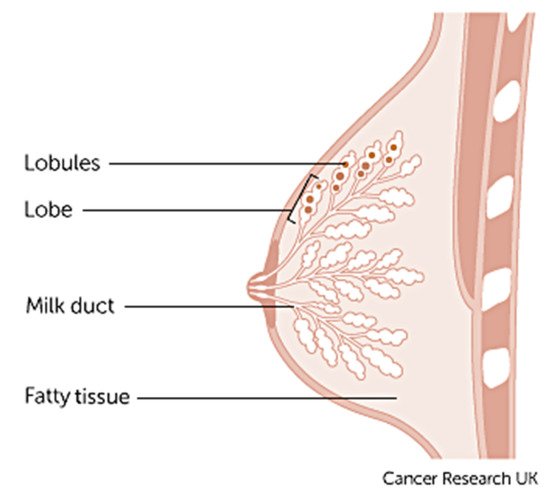
Breast cancer varies based on which part of the breast tissue becomes cancerous. Commonly, breast cancer starts in the cells that line the ducts of the breast; however, it may also grow in different areas of the breast such as the lobules, milk ducts or sometimes in between tissues, as illustrated in
Figure 1 [9].
3 [9].
 The term ‘breast cancer’ refers to a malignant tumour that has developed from cells in the breast that are considered cancerous and cause danger to health. The stage of this cancer is usually expressed as a number on a scale of 0 through IV, with stage 0 describing non-invasive cancers that are still within their original location and stage IV describing invasive cancers that have spread outside the breast [10]. In cases where cancer is detected, but no cancer cells are visible in the lymph glands, the breast cancer is of a lower risk. When spreading occurs, it carries a substantial risk of death, meaning that the cancer cells from the breast tissue have broken away, which can be carried to nearby lymph nodes by the lymph fluid (fluid that gathers waste products and drains into veins to be removed) [10].
Figure 1. Anatomy of the breast credits to Cancer Research UK [9].
Breast cancer can be distinguished as benign (non-cancerous) and malignant (cancerous/metastatic) tumours. Benign tissue refers to changes in normal tissue of breast parenchyma, which does not relate to the development of malignancy [11]. Contrarily, malignant tissue can be categorised into two types: in-situ carcinoma and invasive carcinoma. Additionally, in some cases benign breast tumours can be further divided into four subclass types, adenosis, fibroadenoma, phyllodes tumour, and tubular adenoma, whereas malignant breast tumours can be further divided into ductal carcinoma, lobular carcinoma, medullary carcinoma, mucinous carcinoma, tubular carcinoma, and papillary carcinoma [12].
The term ‘breast cancer’ refers to a malignant tumour that has developed from cells in the breast that are considered cancerous and cause danger to health. The stage of this cancer is usually expressed as a number on a scale of 0 through IV, with stage 0 describing non-invasive cancers that are still within their original location and stage IV describing invasive cancers that have spread outside the breast [10]. In cases where cancer is detected, but no cancer cells are visible in the lymph glands, the breast cancer is of a lower risk. When spreading occurs, it carries a substantial risk of death, meaning that the cancer cells from the breast tissue have broken away, which can be carried to nearby lymph nodes by the lymph fluid (fluid that gathers waste products and drains into veins to be removed) [10].
Breast cancer can be distinguished as benign (non-cancerous) and malignant (cancerous/metastatic) tumours. Benign tissue refers to changes in normal tissue of breast parenchyma, which does not relate to the development of malignancy [11]. Contrarily, malignant tissue can be categorised into two types: in-situ carcinoma and invasive carcinoma. Additionally, in some cases benign breast tumours can be further divided into four subclass types, adenosis, fibroadenoma, phyllodes tumour, and tubular adenoma, whereas malignant breast tumours can be further divided into ductal carcinoma, lobular carcinoma, medullary carcinoma, mucinous carcinoma, tubular carcinoma, and papillary carcinoma [12].
Histopathology (histology) image samples of breast lesions are obtained through either needles or surgical operation, which are then later processed and allocated to a glass slide to undergo a staining process. Currently, histopathological images play a vital role in cancer diagnosis because of the large amount of information they provide for medical image analysis [13][14]. Whole-slide images (WSI) can have multiple regions of breast lesion tissue, whereas microscopy images are patches derived from WSI, each representing one type of breast lesion only. In this paper we have chosen to study histopathology images of breast cancer in developing a machine learning based CAD system.
The main contribution of this paper is to discuss the process, methods, comparisons, and remarks on developing a CAD expert system for breast cancer. The rest of the research paper is organized as follows: Section 2 explains the publicly available datasets for breast cancer histopathology images. The process of using a computer-aided expert system using histopathology images is presented in Section 3, which includes techniques employed in (1) image pre-processing, (2a) conventional CAD methods that employ segmentation, feature extraction, feature selection (dimension reduction) and classification; (2b) deep-learning-based CAD and (3) Performance evaluation. Finally, Section 4 discusses the conclusion and future directions for researchers are given Section 5.
2. Datasets for Breast Cancer Classification
In the field of medical image analysis, machine learning methodologies applied for histopathological images are developing rapidly. To obtain a large and representative annotated dataset to develop a machine learning method for CAD system is a challenging task [14]. Recently, there has been a rise in public challenges for breast cancer diagnosis which has attracted many researchers to this area of study. This section describes various publicly accessible datasets to assist future research and development.
In the field of medical image analysis, machine learning methodologies applied for histopathological images are developing rapidly. To obtain a large and representative annotated dataset to develop a machine learning method for CAD system is a challenging task [16]. Recently, there has been a rise in public challenges for breast cancer diagnosis which has attracted many researchers to this area of study. This section describes various publicly accessible datasets to assist future research and development.
For binary classification, there are two categories of benign and malignant to determine cancer or non-cancerous. The category benign type of breast tumour consists of adenosis (A), The malignant type of breast tumour consists of ductal carcinoma (DC), lobular carcinoma (LC), mucinous carcinoma (MC), and papillary carcinoma (PC). This dataset is the most used dataset by many researchers for CAD breast cancer in histopathology images [11][15][16][17][18][19][20][21][22][23][24][25][26][27][28].
For binary classification, there are two categories of benign and malignant to determine cancer or non-cancerous. The category benign type of breast tumour consists of adenosis (A), The malignant type of breast tumour consists of ductal carcinoma (DC), lobular carcinoma (LC), mucinous carcinoma (MC), and papillary carcinoma (PC). This dataset is the most used dataset by many researchers for CAD breast cancer in histopathology images [11,17,18,19,20,21,22,23,24,25,26,27,28,29,30].
Bioimaging Challenge 2015 dataset [29]: This dataset contains 269 images of haematoxylin and eosin (H&E)-stained breast cancer histology images with image size of 2048 × 1536 pixels. To further classify, the non-cancerous categories can be categorized as normal and benign, while the cancerous ones can be categorized as in situ carcinoma and invasive carcinoma. The training set has a total of 249 images form by 55 normal class, 69 benign class, 63 in situ carcinoma class, and 62 invasive carcinoma class, while the test set has a total of 20 images with 5 images for each class. Additionally, there is an extended test set with more diversity provided with a total of 16 images available.
Bioimaging Challenge 2015 dataset [31]: This dataset contains 269 images of haematoxylin and eosin (H&E)-stained breast cancer histology images with image size of 2048 × 1536 pixels. To further classify, the non-cancerous categories can be categorized as normal and benign, while the cancerous ones can be categorized as in situ carcinoma and invasive carcinoma. The training set has a total of 249 images form by 55 normal class, 69 benign class, 63 in situ carcinoma class, and 62 invasive carcinoma class, while the test set has a total of 20 images with 5 images for each class. Additionally, there is an extended test set with more diversity provided with a total of 16 images available.
BACH (BreAst Cancer Histology) dataset [30]: The ICIAR 2018 challenge resulted in the BreAst Cancer Histology (BACH) image dataset, which is an extended version of the Bioimaging 2015 breast histology classification challenge dataset with similar image sizes and magnification levels [29]. The dataset has a total number of 400 images, respectively classified to a total number of 100 normal class, 100 benign class, 100 in situ carcinoma class, and 100 invasive carcinoma class. The test set has a total of 100 images without any labels.
BACH (BreAst Cancer Histology) dataset [32]: The ICIAR 2018 challenge resulted in the BreAst Cancer Histology (BACH) image dataset, which is an extended version of the Bioimaging 2015 breast histology classification challenge dataset with similar image sizes and magnification levels [31]. The dataset has a total number of 400 images, respectively classified to a total number of 100 normal class, 100 benign class, 100 in situ carcinoma class, and 100 invasive carcinoma class. The test set has a total of 100 images without any labels.
The Cancer Metastases in Lymph Nodes Challenge breast cancer metastasis detection dataset combines two datasets collected from CAMELYON16 and CAMELYON17 challenges, with each image approximately 1 × 105 by 2 × 105 pixels at the highest resolution. Each image is annotated with a binary label for classification, showing normal and presence of metastases tissue. There are two sets of training datasets, the first has a total number of 170 images, formed of 100 normal class and 70 metastases class, while the second has a total number of 100 images formed of 60 normal class and 40 metastases class. This version is extended from the CAMELYON16 which include patients testing for breast cancer from the CAMELYON16 challenge with an additional three medical centres from the Netherlands, specifically: slides from 130 lymph node resections from Radboud University Medical Center in Nijmegen (RUMC), 144 from Canisius-Wilhelmina Hospital in Nijmegen (CWZ), 129 from University Medical Center Utrecht (UMCU), 168 from Rijnstate Hospital in Arnhem (RST), and 140 from the Laboratory of Pathology East-Netherlands in Hengelo (LPON) [31].
The Cancer Metastases in Lymph Nodes Challenge breast cancer metastasis detection dataset combines two datasets collected from CAMELYON16 and CAMELYON17 challenges, with each image approximately 1 × 105 by 2 × 105 pixels at the highest resolution. Each image is annotated with a binary label for classification, showing normal and presence of metastases tissue. There are two sets of training datasets, the first has a total number of 170 images, formed of 100 normal class and 70 metastases class, while the second has a total number of 100 images formed of 60 normal class and 40 metastases class. This version is extended from the CAMELYON16 which include patients testing for breast cancer from the CAMELYON16 challenge with an additional three medical centres from the Netherlands, specifically: slides from 130 lymph node resections from Radboud University Medical Center in Nijmegen (RUMC), 144 from Canisius-Wilhelmina Hospital in Nijmegen (CWZ), 129 from University Medical Center Utrecht (UMCU), 168 from Rijnstate Hospital in Arnhem (RST), and 140 from the Laboratory of Pathology East-Netherlands in Hengelo (LPON) [34].
Thus, this version of dataset is derived from the CAMELYON dataset with a total number of 327.680 histopathologic scans of lymph node sections images, each in the size of 96 × 96 px pixels. Like the CAMELYON dataset, each image is annotated with binary label for classification, showing normal and presence of metastases tissue. The main difference and advantage of this dataset is that it is bigger than CIFAR10, smaller than ImageNet, additionally it is trainable on a single GPU to able to achieve competitive scores in the CAMELYON16 tasks of cancer detection and WSI diagnosis. PCam contributed by supplying the segmented tissue parts that separated tissue and background from the whole slide images.
The conference ICPR 2012 supplied the MITOS dataset benchmark that consists of 50 histopathology images of haematoxylin and eosin (H&E)-stained slides of breast cancer images from 5 different breast biopsies at 40× magnification level. However, this dataset is too small to produce an exceptionally reliable performance and the robustness of the diagnosis system is limited. Therefore, an extended version of the dataset (MITOS-ATYPIA-14) was presented at ICPR 2014.
MITOS-ATYPIA-14 dataset [32]: (H&E)-stained slides of breast cancer images with the size of 1539 × 1376 pixels at 20× and 40× magnification level. There is a training set with a total number of 1200 images acquired from 16 different biopsies and testing set with a total number of 496 images acquired from 5 different breast biopsies. The dataset consists of a significantly diverse variation of stained images in many conditions to elevate the challenge to achieve a more exceptional performance.
MITOS-ATYPIA-14 dataset [37]: (H&E)-stained slides of breast cancer images with the size of 1539 × 1376 pixels at 20× and 40× magnification level. There is a training set with a total number of 1200 images acquired from 16 different biopsies and testing set with a total number of 496 images acquired from 5 different breast biopsies. The dataset consists of a significantly diverse variation of stained images in many conditions to elevate the challenge to achieve a more exceptional performance.
TUPAC16 dataset [33]: The dataset consists of a total number of 73 breast cancer histopathology images at 40× magnification level from three pathology centres in the Netherlands. The dataset is composed of 23 test images with a size of 2000 × 2000 pixels and 50 training images with a size of 5657 × 5657 pixels collected from two separate pathology centres. The images contained in the training dataset are later cropped randomly to the size of 2000 × 2000 pixels. The dataset can be obtained from http://tupac.tue-image.nl/node/3 (accessed on 16 March 2021).
TUPAC16 dataset [38]: The dataset consists of a total number of 73 breast cancer histopathology images at 40× magnification level from three pathology centres in the Netherlands. The dataset is composed of 23 test images with a size of 2000 × 2000 pixels and 50 training images with a size of 5657 × 5657 pixels collected from two separate pathology centres. The images contained in the training dataset are later cropped randomly to the size of 2000 × 2000 pixels. The dataset can be obtained from http://tupac.tue-image.nl/node/3 (accessed on 16 March 2021).
UCSB bio segmentation benchmark (UCSB-BB) [34]: This dataset contains 50 haematoxylin and eosin (H&E)-stained histopathology images used in breast cancer cell detection with the size of 896 × 768 pixels and a ground truth table. Each image is annotated with binary label for classification, it contains half malignant class and half benign class.
UCSB bio segmentation benchmark (UCSB-BB) [39]: This dataset contains 50 haematoxylin and eosin (H&E)-stained histopathology images used in breast cancer cell detection with the size of 896 × 768 pixels and a ground truth table. Each image is annotated with binary label for classification, it contains half malignant class and half benign class.