Your browser does not fully support modern features. Please upgrade for a smoother experience.
Please note this is a comparison between Version 2 by Lily Guo and Version 1 by Michael Chia.
Non-communicable diseases (NCDs) are a preventable threat to livelihood and longevity in the Association of South East Asian Nations (ASEAN) and insufficient physical activity (PA) is a primary cause of NCDs.
- physical activity
- methodology
1. Introduction
In recent years, physical activity (PA) has increasingly come to the forefront of population-based research as regular, sufficient PA has been demonstrated to be a key factor in the prevention and management of noncommunicable diseases (NCDs) [1,2][1][2]. Specifically, sufficient PA has been previously defined by the World Health Organisation as at least 150–300 min of moderate intensity PA per week, at least 75–150 min of vigorous intensity PA per week, or an equivalent combination in healthy, adult populations, with slightly differing values for other populations [3].
PA refers to any bodily movement produced by skeletal muscles that results in energy expenditure above the resting metabolic rate, which may be unstructured and everyday life activity, exercise that includes pre-arranged deliberate and repetitive activity, and grassroots sports and competitive sports [4]. Insufficient PA is not to be confused with sedentary behaviour, defined as any waking behaviour characterised by an energy expenditure of ≤1.5 METs while in a sitting or reclining posture [5]. Thus, within the context of this discussion, samples of populations are described as physically inactive, or not having sufficient PA, if they have an insufficient PA level to meet present PA recommendations [3].
Similarly, PA is of particular importance within the Southeast Asian region as cardiovascular disease, hypertension and obesity are some of the leading health issues that have been identified in Asia [6], with global NCD-related deaths set to reach 52 million annually by 2030 [7] and the Southeast Asian region contributing to approximately a quarter of that [8], the region is set to account for approximately 13 million deaths by 2030. As of 2016, Southeast Asia reported a higher prevalence of insufficient PA levels compared to the global average [9], highlighting a pressing need for the region to implement measures to arrest further increases in the prevalence of insufficient PA levels. As a comparison, 28% of all adults aged 18 years and above were not sufficiently physically active in 2016, and while the Association of South East Asian Nations (ASEAN) average was 24.7%, 3 of the 10 ASEAN nations were above the 28% global average.
It is important to understand how the ASEAN collective is conducting PA measurements as this determines how accurately PA levels are captured, which can affect the way future PA interventions and policies are established, as well as how accurately changes in PA levels due to the introduction of said interventions/policies can be tracked. Indeed, considerable thought is required when deciding on the appropriate methodology to use when measuring PA. It is often the case that the strength of outcomes derived from randomised controlled trials are given more credence than observational studies [10], and objective measures are valued over subjective measures [11]. However, this is not necessarily always the case, and the use of a particular methodology over another is determined by a multitude of factors, such as feasibility of the research design and the variables of interest. Therefore, the purpose of this paper was to conduct a systematic review of the current methodologies used to measure PA across studies conducted in the nations within the ASEAN group, identifying the current methodologies by which PA levels are measured and defined in ASEAN countries, and any emerging trends in the research. The papers included did not necessarily measure PA as a primary outcome, instead all papers that measured PA at all, regardless if they were measured as a dependent variable, a predictor variable, an outcome variable or a confounding variable, were included within the systematic review as our primary concern is the consolidation of the types of PA measurement methodologies being used in research produced by countries within the ASEAN collective.
2. Search and Selection Process
Studies examined in this systematic review were gathered according to the Preferred Reporting Items for Systematic reviews and Meta-Analyses (PRISMA) guidelines by searching through three electronic databases in May 2020, namely, i.e., PubMed, Scopus and Web of Science, to identify articles containing the following keywords and combinations: (a) Physical Activity; AND (b) Indonesia OR Philippines OR Malaysia OR Singapore OR Laos OR Brunei OR Myanmar OR Burma OR Thailand OR Cambodia OR Vietnam OR ASEAN OR Southeast Asia; AND (c) Measurement OR Method OR Survey OR Consensus.
The 564 included articles measured PA using a variety of methodologies of research conducted on populations of the ASEAN member states, i.e., Brunei, Cambodia, Indonesia, Laos, Malaysia, Myanmar, Philippines, Singapore, Thailand, Vietnam, regardless of whether the research was conducted by institutes within the countries themselves or foreign bodies. These studies were published in the English language between 1978 and May 2020. There were initially 1155 articles found on PubMed, 1197 in Scopus and 500 in Web of Science. Rayyan QCRI was used to compile the citation lists of the three databases, whereby duplicates were flagged and manually resolved, resulting in a total of 1032 studies. 75 studies were not able to be retrieved, resulting in 957 studies. After assessing the studies for their eligibility, 400 studies were excluded and an additional seven were added after looking through references of other papers, resulting in 564 studies being included in the review. The 400 articles were excluded because they were duplicates undetected in the first round, were inaccessible, irrelevant, the PA data for the ASEAN countries were indiscernible from those of the non-ASEAN countries, the study population was wrong, was not written in English, had the wrong study design or were retracted. The PRISMA inclusion/exclusion process [12] is illustrated in Figure 1. For a full list of the 564 cited articles, please refer to Appendix A.
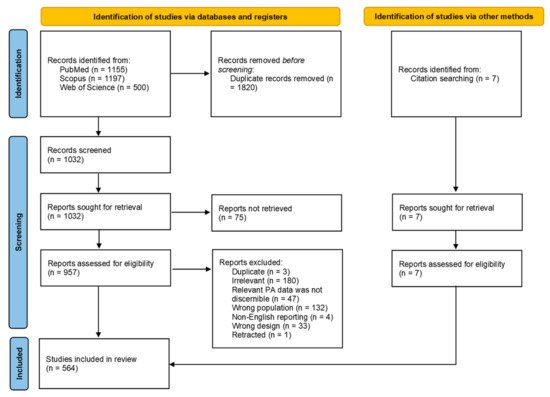
Figure 1.
3. Study Design
As detailed above, the majority (87%) of studies that collected PA measures were observational in nature, while 9% were of experimental design. While experimental designs are often believed to be superior in terms of the strength of evidence produced compared to observational studies [10[10][13],15], both study designs present different sets of advantages and limitations, and thus results should be interpreted with different perspectives. Generally, interventions provide an opportunity to determine the efficacy of a protocol on affecting a given variable. RCTs are able to provide an additional layer of control through randomization by dividing participants into prognostically similar groups to better attribute an observed effect to a treatment [16][14]. However, experimental designs, specifically RCTs, tend to lack external validity and generalizability [17,18][15][16] due to the inclusion and exclusion criteria presented in such studies encouraging the study of a select type of population or individual. Further, experimental designs tend to preclude individuals who are less likely to adhere to or may have adverse reactions to a given intervention. This tends to result in a selection bias of individuals who may be highly motivated to engage in such an intervention, which may not necessarily be a representative sample of the population [16][14]. Interventions are also usually shorter in duration compared to longitudinal cohort studies. In the case of PA, approximately 50% of individuals who begin an exercise program stop within the first 6 months, a comparable statistic across many age groups [19,20][17][18]. Compare this to a recent meta-analysis [21][19] that demonstrated a 74% average adherence rate and 3–5% dropout rate across populations with chronic diseases in exercise intervention studies, presenting a much more optimistic outlook on exercise adherence. It is clear that the circumstances surrounding the nature of observational and experimental studies do not allow the simplistic and reductive perception of experimental studies being necessarily better than observational studies.
Observational studies, which include cross-sectional, case-control and longitudinal cohort studies, present a different set of advantages and limitations. Generally, observational studies are more easily conducted due to the lower amounts of resources required, potentially with the exception of longitudinal cohort studies, making them a cost-efficient way of identifying certain traits that may be present within certain populations before utilising experimental studies to attempt to affect the outcome. However, observational studies come with their own limitations such as left-censorship bias, right-censorship bias and confounding by indication [16][14]. In the case of the PA studies examined in this review, it is more likely that left-censorship bias would exist, especially in the case of longitudinal studies that examine the influence of PA on morbidity or mortality, individuals with severely debilitating conditions may not be included as they are unable to take part in such a study or have already passed on prior to their inclusion into the study due to the severity of their conditions.
As a whole, the pool of 564 studies includes both a variety of observational and experimental studies. However, Brunei, Cambodia, Laos and Myanmar lack any experimental studies. As mentioned above, both types of studies have their advantages and limitations, and thus the aforementioned countries have an incentive to develop such studies to better understand the impact of PA on individuals within their population. However, it is also worth noting that the aforementioned countries each accounted for 0.4–1.1% of the total research produced across the ASEAN nations and that the lack of research in general is an area for improvement. As mentioned earlier, observational studies are a cost-efficient way of identifying potential trends in the population before implementing experimental studies to assess the efficacy of affecting certain outcomes, and thus the lack of observational studies could perhaps also explain the lack of experimental studies. Furthermore, three of the four aforementioned nations are in the lower half of the GDP per capita ranking for ASEAN nations, and producing research in this area may not yet be a priority (Table 21). Moreover, given the relationship between increasing physical inactivity and deaths due to NCDs, it is also possible that these are not really issues that are perceived as requiring attention, especially in the case of Cambodia, Laos and Myanmar, possessing most of the lowest physical inactivity values across the ASEAN nations.
Table 21.
GDP per capita, physical inactivity prevalence and estimated percentage of deaths due to noncommunicable diseases across ASEAN nations.
| Country | GDP per Capita (Int$) | 1 | Physical Inactivity (%) | 2 | Estimated Percentage of Deaths Due to NCDs | 2,3 |
|---|---|---|---|---|---|---|
| Singapore | 105,689 | 38 | 74 | |||
| Brunei | 85,011 | 26 | 85 | |||
| Malaysia | 34,567 | 38 | 74 | |||
| Thailand | 21,361 | 25 | 74 | |||
| Indonesia | 14,841 | 22 | 73 | |||
| Philippines | 10,094 | 38 | 67 | |||
| Laos | 8684 | 15 | 60 | |||
| Vietnam | 8677 | 25 | 77 | |||
| Myanmar | 7220 | 10 | 68 | |||
| Cambodia | 5004 | 10 | 64 | |||
| ASEAN (overall) | 30,115 | 24.7 | 71.6 |
4. Tool Type
As detailed prior, the majority of studies (86.2%) utilised only subjective measures of PA, including questionnaires and activity diaries/logs, while 7.1% utilised only objective measures of PA, including accelerometers, pedometers and heart rate monitors, with 5.3% having used a mix of both types of measurement tools in their studies. As with study designs, each measurement tool type has its own advantages and limitations.
Subjective measures of PA tend to be relatively cheap and easy to administer, with the capacity to measure many different outcomes, such as frequency, intensity, duration, mode and context of PA performed [23][20]. Naturally, questionnaires and activity diaries/logs possess differences in what they offer to researchers, e.g., questionnaires present a lower participant burden compared to activity diaries/logs but are prone to recall bias. Subjective measures also tend to be prone to social desirability bias due to higher PA participation being viewed as more positive [24][21]. Nevertheless, subjective measures of PA are usually used in large-scale observational studies with many participants due to the practicality and ease of administration.
Objective measures of PA tend to be more accurate in measurement of movement but also more restricted in the information that can be gleaned. For example, while both accelerometers and pedometers can measure movement objectively, the latter is limited to the measurement of steps with no indication of intensity, duration and context of the PA. Whereas with the former, while there is a measurement of intensity and duration, there is no mode and context of the PA being carried out [23][20]. It is also important to note that the quality of the data gleaned from accelerometers are limited by their measurement settings, i.e., epochs and inclusion criteria for valid data.
While most of the ASEAN nations have produced research using both subjective and objective tools, there are a few countries that have produced studies that have only utilised subjective tool types, i.e., Brunei, Cambodia and Laos. Similarly, this observation could potentially be explained by the same factors mentioned earlier regarding study design. Additionally, tool types are typically determined by the study designs [24][21], with surveys and observational cohort studies usually utilising subjective measures of PA and experimental designs typically utilising objective measures of PA. As such, it is of little surprise that the countries that do not have research utilising objective measures are the same countries that do not have experimental studies.
When considering the most appropriate PA measurement tool to use for assessment, it may be useful to consider a decision matrix framework [25][22] to arrive at a ‘best-country-culture-context’ decision. In essence, the eventual choice of the measurement tool used to measure PA is dependent upon the interaction of a variety of factors, i.e., the specific research question, feasibility and practicality, resources available and administrative considerations. It is important to be cognizant of the idea that there is no perfect instrument for every situation, especially when employed across different countries in the ASEAN region.
5. Future Directions
5.1. Consistency of Questionnaires Used across Studies
Across the 564 studies, a total of 517 questionnaires were utilised to measure PA. Of these, 252 (48.7%) were either the GPAQ, IPAQ or some population-appropriate derivative of the two. While there is little issue with the use of non-GPAQ/IPAQ questionnaires to measure PA, provided they are valid and reliable, there is a need for some form of tool use consistency if comparison across multiple countries and time periods is desired.
The use of the GPAQ/IPAQ or population-appropriate derivatives is thus especially useful for this purpose as they allow for the measurement of a diverse set of variables, including intensity, frequency, duration, context and mode. These variables can then be extensively and reliably compared across multiple countries in the region to determine PA prevalence. As such, if a common questionnaire were to be used for the aforementioned purposes of inter-nation comparison and tracking changes over time, it should be based on the parameters laid out by the GPAQ/IPAQ.
5.2. Population Profiles and Possible Amendments to Questionnaires
The existing WHO guidelines on PA differ across population profiles. For instance, the recommendations for adults include 150–300 min of moderate-intensity, 75–150 min of vigorous-intensity or a combined equivalent of the two intensities, of aerobic PA. It is also strongly recommended that adults perform some form of muscle strengthening activities on at least 2 days of the week. Contrast this with older adults, who are recommended to perform at least an additional 3 days per week of varied, multicomponent PA with an emphasis on functional balance and strength, on top of the aforementioned recommendations for adults [3].
As such, the GPAQ has potential room for improvement pertaining to how PA data is collected. For example, while the WHO has certain recommendations on the duration of PA that should come from muscle-strengthening exercises and varied, multicomponent PA with an emphasis on functional balance and strength in certain populations, it is not possible to capture this distinction in the current form of the GPAQ as activities are mostly categorised by intensity and domain and may not be appropriate to accurately capture the metabolic demands of, for instance, muscle-strengthening exercise. Specifically, aerobic training tends to be practiced in a continuous, cyclical form, e.g., long-distance running, making it much easier to accurately define the metabolic equivalent of work done. However, muscle-strengthening exercises are characterised by intervals of work and rest, e.g., high intensity interval training and resistance training, with the work done usually quantified by volume and not by the amount of time spent on the exercise, making the GPAQ’s current way of quantifying physical activity done based on time not as accurate in capturing the metabolic demands of said exercises. This presents an area for potential misclassification during data collection. Naturally, current iterations of the GPAQ/IPAQ would be less useful when trying to answer any questions relating to the frequency, duration and intensity of muscle-strengthening exercise an individual may be performing.
As such, it may be appropriate to develop a questionnaire that takes this into account as well.
5.3. Moving toward the Adoption of a Common Surveillance Framework for Physical Activity and Sedentary Behaviour
A report card on PA or inactivity, developed and promoted by Canadian researchers for children and adolescents [26][23], details 10 PA-enabling criteria (overall PA; organised sports and PA; active play; active transport; sedentary behaviours; family and peers; school; community and environment and government policies) that are used to assess the state of PA in countries and regions [27][24]. However, of note, when assessing the criterion of overall activity, only meeting age-appropriate guidelines for accumulating moderate-to-vigorous PA was considered, and not muscle or bone-strengthening exercises. Nonetheless, utilising these report cards in national surveillance studies in tandem with existing questionnaires, with the criteria jointly adapted and customised for ASEAN countries, may provide a more holistic framework for the surveillance of PA and sedentary behaviour among member nations, thus potentially strengthening research outcomes.
5.4. Joint Lifestyle and Time Use Research Including Physical Activity, Sedentary Behaviour, Sleep and Nutrition across ASEAN Countries
Currently, ASEAN country representatives meet at regular time horizons to discuss myriad multi-lateral issues, including topics on trade, security, and threats to health and well-being. Going forward, within the same vein of improving health and well-being across ASEAN countries, more developed countries within the bloc may perhaps consider taking the lead in working closely and co-curating the research questions with less resourced ASEAN countries for a PA health report card for ASEAN member nations. This could potentially be in the form of the provision of funding, equipment or expertise from the better resourced nations to the less resourced ones to enhance their research capabilities.
References
- Warburton, D.E.; Nicol, C.W.; Bredin, S.S. Health benefits of physical activity: The evidence. CMAJ 2006, 174, 801–809.
- World Health Organization. Global Recommendations on Physical Activity for Health. Available online: (accessed on 5 May 2021).
- Bull, F.C.; Al-Ansari, S.S.; Biddle, S.; Borodulin, K.; Buman, M.P.; Cardon, G.; Willumsen, J.F. World Health Organization 2020 guidelines on physical activity and sedentary behaviour. Br. J. Sports Med. 2020, 54, 1451–1462.
- Condello, G.; Ling, F.C.M.; Bianco, A.; Chastin, S.; Cardon, G.; Ciarapica, D.; Capranica, L. Using concept mapping in the development of the EU-PAD framework (EUropean-Physical Activity Determinants across the life course): A DEDIPAC-study. BMC Public Health 2016, 16, 1–16.
- Tremblay, M.S.; Aubert, S.; Barnes, J.D.; Saunders, T.J.; Carson, V.; Latimer-Cheung, A.E.; Chastin, S.; Altenburg, T.M.; Chinapaw, M. SBRN terminology consensus project participants. sedentary behavior research network (SBRN)—Terminology consensus project process and outcome. Int. J. Behav. Nutr. Phys. Act 2017, 14, 75.
- Deloitte. A Perspective of Future Healthcare Landscape in ASEAN and Singapore. Available online: (accessed on 5 May 2021).
- World Health Organisation. Premature NCD Deaths. Available online: (accessed on 5 May 2021).
- World Health Organisation. Noncommunicable Diseases in the South-East Asia. Available online: (accessed on 5 May 2021).
- World Health Organization. Prevalence of Insufficient Physical Activity Among Adults, Data by WHO region. Available online: (accessed on 5 May 2021).
- Pocock, S.J.; Elbourne, D.R. Randomized trials or observational tribulations? N. Engl. J. Med 2000, 342, 1907–1909.
- Silfee, V.J.; Haughton, C.F.; Jake-Schoffman, D.E.; Lopez-Cepero, A.; May, C.N.; Sreedhara, M.; Rosal, M.C.; Lemon, S.C. Objective measurement of physical activity outcomes in lifestyle interventions among adults: A systematic review. Prev. Med. Rep. 2018, 11, 74–80.
- Page, M.J.; McKenzie, J.E.; Bossuyt, P.M.; Boutron, I.; Hoffmann, T.C.; Mulrow, C.D.; Shamseer, L.; Tetzlaff, J.M.; Akl, E.A.; Brennan, S.E.; et al. The PRISMA 2020 statement: An updated guideline for reporting systematic reviews. BMJ 2021, 372, n71.
- Barton, S. Which clinical studies provide the best evidence? The best RCT still trumps the best observational study. BMJ 2000, 321, 255–256.
- Landewé, R.; van der Heijde, D. Primer: Challenges in randomized and observational studies. Nat. Clin. Pract. Rheumatol. 2007, 3, 661–666.
- Britton, A.; McKee, M.; Black, N.; McPherson, K.; Sanderson, C.; Bain, C. Threats to applicability of randomised trials: Exclusions and selective participation. J. Health Serv. Res. Policy 1999, 4, 112–121.
- Carné, X.; Arnaiz, J.A. Methodological and political issues in clinical pharmacology research by the year 2000. Eur. J. Clin. Pharmacol. 2000, 55, 781–785.
- Allen, K.; Morey, M.C. Physical activity and adherence. In Improving Patient Treatment Adherence: A Clinician’s Guide; Bosworth, H., Ed.; Springer: New York, NY, USA, 2010; pp. 9–38. ISBN 978-1-4419-5866-2.
- Robison, J.I.; Rogers, M.A. Adherence to exercise programmes. Sports Med. 1994, 17, 39–52.
- Bullard, T.; Ji, M.; An, R.; Trinh, L.; Mackenzie, M.; Mullen, S.P. A systematic review and meta-analysis of adherence to physical activity interventions among three chronic conditions: Cancer, cardiovascular disease, and diabetes. BMC Public Health 2019, 19, 636.
- Bauman, A.; Phongsavan, P.; Schoeppe, S.; Owen, N. Physical activity measurement—A primer for health promotion. Promot. Educ. 2006, 13, 92–103.
- Warren, J.M.; Ekelund, U.; Besson, H.; Mezzani, A.; Geladas, N.; Vanhees, L. Assessment of physical activity— A review of methodologies with reference to epidemiological research: A report of the exercise physiology section of the European Association of Cardiovascular Prevention and Rehabilitation. Eur. J. Cardiovasc. Prev. Rehabil. 2010, 17, 127–139.
- Strath, J.; Kaminsky, L.; Ainsworth, B.; Ekelund, U.; Freedson, P.; Gary, R.; Richardson, C.; Smith, D.; Swartz, A. Guide to the assessment of physical activity: Clinical and research applications. A scientific statement from the American heart association. Circulation 2013, 128, 2259–2279.
- Colley, R.C.; Brownrigg, M.; Tremblay, M.S. A Model of knowledge translation in health: The active healthy kids Canada report card on physical activity for children and youth. Health Promot. Pract. 2012, 13, 320–330.
- Coppinger, T.; Milton, K.; Murtagh, E.; Harrington, D.; Johansen, D.; Seghers, J.; Skovgaard, T.; Chalkley, A. Global Matrix 3.0 physical activity report card for children and youth: A comparison across Europe. Public Health 2020, 187, 150–156.
More