The reciprocating compressor (RC) is a key piece of equipment in petroleum and chemical industries. If the RC does not operate in the rated efficiency, it will lead to great economic loss to the company. Sometimes RCs are used to compress inflammable and explosive gases working under high pressures and temperatures, such as hydrogen, ethylene, and natural gas, which would threat human life once the machine malfunctions. Furthermore, due to the intricate structure of the compressor, a large amount of wearing parts, and the complicated interactional relationship between moving parts of the compressor, it is essential to monitor the compressor operating condition and detect failures of RCs accurately and in a timely manner. Operating condition detection and fault diagnosis are very important for reliable operation of reciprocating compressors. Machine learning is one of the most powerful tools in this field.
1. Reciprocating Compressors
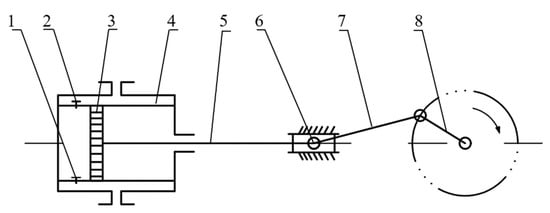
shows a single-stage reciprocating compressor, which is mainly made up of two valves, a piston, a cylinder, a piston rod, a crosshead, a connecting rod, and a crankshaft. The crankshaft is driven by motor, then the crankshaft reciprocates the piston through the slide-crank mechanism, so that the piston can compress gas in the cylinder to a designated high pressure [1]. RCs can be applied in chemical, refining, and petrochemical plants, and they can compress almost any gas mixture from vacuum to over 3000 atm.
shows a single-stage reciprocating compressor, which is mainly made up of two valves, a piston, a cylinder, a piston rod, a crosshead, a connecting rod, and a crankshaft. The crankshaft is driven by motor, then the crankshaft reciprocates the piston through the slide-crank mechanism, so that the piston can compress gas in the cylinder to a designated high pressure [9]. RCs can be applied in chemical, refining, and petrochemical plants, and they can compress almost any gas mixture from vacuum to over 3000 atm.
Figure 1.
Principle of a one-stage reciprocating compressor. 1—suction valve; 2—discharge valve; 3—piston; 4—cylinder; 5—piston rod; 6—crosshead; 7—connecting rod; 8—crankshaft.
The faults of compressors are caused by failures of different components. In [2], Kostyukov performed a survey into the fault causes of reciprocating compressors based on consumers and manufacturers of RCs. The results showed that one of the main reasons for compressor failure is valves, and it makes up 36%. Piston-cylinder units also constitute over 30% of all faults, where the failures of rings account for 25%. Failures in the slide-crank mechanism and cranking mechanism are also significant [2]. To monitor compressor conditions, many kinds of sensors were used in fault detection systems, such as vibration sensors, temperature sensor, pressure sensor, displacement sensor, acoustic emission sensor, and so on.
The faults of compressors are caused by failures of different components. In [10], Kostyukov performed a survey into the fault causes of reciprocating compressors based on consumers and manufacturers of RCs. The results showed that one of the main reasons for compressor failure is valves, and it makes up 36%. Piston-cylinder units also constitute over 30% of all faults, where the failures of rings account for 25%. Failures in the slide-crank mechanism and cranking mechanism are also significant [10]. To monitor compressor conditions, many kinds of sensors were used in fault detection systems, such as vibration sensors, temperature sensor, pressure sensor, displacement sensor, acoustic emission sensor, and so on.
2. Four Major Machine Learning Methods
Machine learning is a subject that focuses on research of learning algorithms by which a machine can learn from the data nearly as well as people do [3]. Up to now, there are a lot of machine learning methods that have been applied in RC fault diagnosis. In this section, the four most prevalent algorithms in machine learning are reviewed.
Machine learning is a subject that focuses on research of learning algorithms by which a machine can learn from the data nearly as well as people do [11]. Up to now, there are a lot of machine learning methods that have been applied in RC fault diagnosis. In this section, the four most prevalent algorithms in machine learning are reviewed. The artificial neural network, support vector machine, and Bayesian network are three common traditional machine learning methods, and the deep learning method is one of the latest machine learning algorithms.
2.1. Artificial Neural Network (ANN)
The artificial neural network, support vector machine, and Bayesian network are three common traditional machine learning methods, and the deep learning method is one of the latest machine learning algorithms.
2.1. Artificial Neural Network (ANN)
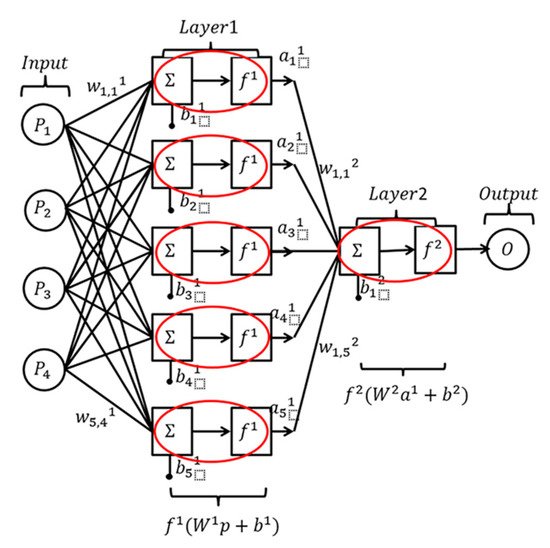
The artificial neural network (ANN) is a mathematical model, inspired by biological neural networks, which consists of a supply of interconnected basic processing elements, called artificial neurons. Artificial neurons are connected with each other by connection links integrated with different weights. shows an ANN with four layers which are input layer, output layer, and two hidden layers (layers 1 and 2). Each hidden layer includes several neurons, and each neuron is connected to each element of the output vector of the last layer through the weight matrix Wi (the weight matrix for the ith hidden layer is written as Wi). Besides, each neuron has a bias bij(the bias for the jth neuron in the ith hidden layer is written as bij ), a summer, a transfer function fij (the transfer function for the jth neuron in the ith hidden layer is written as fij ), and an output aij (the output for the jth neuron in the ith hidden layer is written as aij). Therefore, the calculating function of each neuron is indicated by Equation (1).
where ai-1 is the output vector of the (i-1)th hidden layer (note that when i=1, ai-1 is the input vector of the input layer of the whole network).
Figure 2. Graphical model of an ANN.
Typically,(ANN) is a mathematical in an ANN model, the transfer functions are selectinspired by the designer, and the weights and biases are adjustable parametersbiological neural networks, which can be adjusted by the learning means such as error back propagation algorithm. Therefore, the input and output relationship of the network can meet a specific goal [4][5]. Thus, the ANN moonsists of a supply of interconnectedel can be used to deduce a function from the observations, which is helpful in solving complex problems. Hence, it can be broadly applied in fault diagnosis, which is an essential classification problem.
2.2. Bayesian Network (BN)
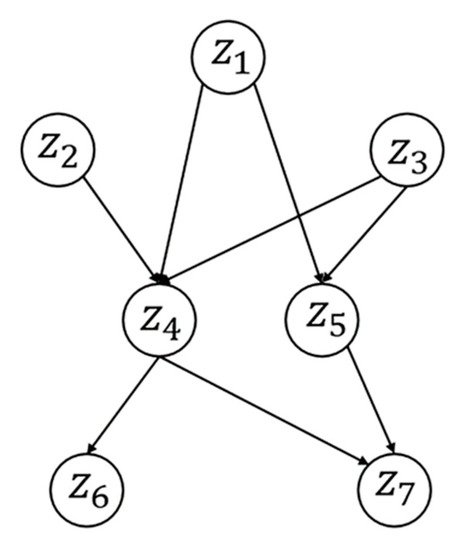
Thbasic processing eleme Bayesian network (alsots, called belief network) [6] artifis a dcirected acyclic graph (as shown in ) whal nere the nodes, such as {z1,z2,…,z7}, are perceived to be the propositional variables. The arrow between two nodes means that the two nodes are related directly, and the weight therein is quantified by a conditional probability. The two essential natures of these networkns. Artificial neurons are consistency and completeness, while the chain-rule representation of the joint distributions is employed to guarantee the two natures for its form [7][8]:
Figure 3. A typical Bayesian network.
It canected with each other by connection lin be kseen that in the right-chained formula, each variable appears once on the left side of the conditioning bar, which can facilitate the dependence quantification of the network. For instance, the chain rule representation for the network integrated with different weights. shown in is:
The Bayesian network is a methodology integrating the probability theory and graph theory. Not only can it visually exhibit the structure of real tasks by graph, but it can also exploit the structure based on the principle of the probability theory, which would diminish the complexity of reasoning. Therefore, the Bayesian network is applied in many various domains. The Bayesian network also provides a framework for new models, and therein a naive Bayes model is normally selected for classification and prediction of multi-dimensional discrete time series [9][10].
2.3. Support Vector Machine (SVM)
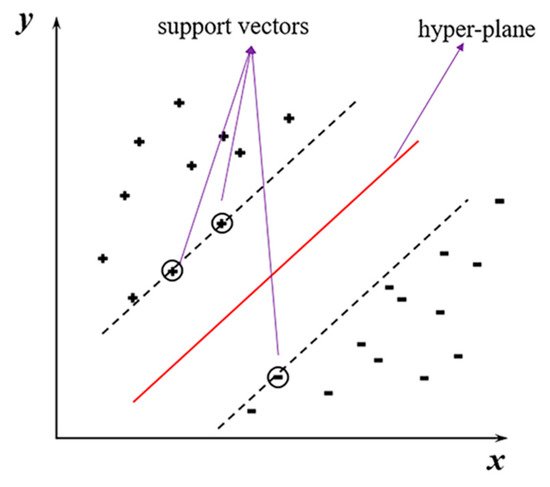
The support n ANN with four layers which are input layer, output layer, and two hidden layers (layers 1 and 2). Each hidden layer includes sevector machine (SVM) is a supervised learning technique developed based on a statistical learning theory, which aims to find a hyperplane (see ). It al neurons, and eacanh separate n-dimensional inputs into two parts associated with the real distinct classes. The hyperplane can be depicted as [11]:
where w is neuron is connected the normal vector of the hyperplane and b is th each eleme bias. To ensure the generalization ability of the SVM, the simplest maximal margin bound was adopted, which implies:
where (xi,yi) is the ith sample of the training set, and yi∈{−1,1}. Formt of the outpula (5) is actually a convex quadratic programming problem and hence has no local minima [12][13]. B vector of the last lay converting the problem with the Kuhn–Tucker condition into the equivalent Lagrangian dual quadratic optimization through the weight matrix problem,  (the paramweters of the SVM, namely w ight mand b, can be obtarined [11][14]. Moreover, except for the maximal margin bound,
  there are other available generalization bounds, such as margin percentile bounds, soft margin bounds, and so on.
Figure 4. A maximal margin hyperplane with its support vectors circled.
Thhidde introduction above is based on the linear separable problem; however, most real tasks are nonlinear separable. Hence, the lower dimensional feature layer is written as should). bBe mapped to a higher dimensional feature space utilizing kernel functions, so that the inputs can be linearly separatedsides, each neuron has a bias in (the feature space. For this reason,bias for the
  the kernel function must be seriously selected for an efficient SVM classifier [13].
SVM is an initial neuron in tool designed for the binary classification. The strategies have to be established to accomplish multiclass classification. Three major SVMs based on distinctive structures are called the one-against-one SVM, one-against-all SVM, and directed acyclic graph (DAG) SVM [15][16].
2.4. Deep Learning (DL)
Th hidden laye artificial intelligence methods introduced above are all conventional machine learning algorithms. is written as One thing they), have in common is the performance of classification depending on the feature vector extracted artificially from the raw data, whereas the process of the fault diagnosis is desired to be fully automatic. Deep lear summer, a transfer functioning  (DL) offers the probability to approach this task [17].
The deep leartraning model is composed of multiple processing modules and each module transforms the representation from the lasfer function for the [Math Processing Error]th layer to a higher and more abstract level neuron in the curren [Math Processing Error]t layer. With enough suitable modules combined, the extremely intricate relationships can be learned. The internal parameters ofhidden layer is written as [Math Processing Error]), the deep learning machine are obtained by utilizing a backpropagation algorind an output [Math Processing Error] (thm based on a large set of data. The convolution neural network (CNN), deep belief network (DBN), and auto-encoder are the output for the [Math Processing Error]three main deep learning meneuron in the [Math Processing Error]thods. The CNN is designed to process data with the form of multiple arrays, such as time series and image data [18]. The DBN ihidden layer is an undiwrected bipartite graphical model stacked by several restricted Boltzmann machinesitten as [Math Processing Error]). A Boltzmann macThine (BM) is an energy-based model, and its modeling capacity can be improved by increasing the number of hidden variables [19].
An auto-enerefore, the calcoder is a purely unsupervised representation learning algorithm. An auto-encoder consists of an encoder and a decoder. The encoder can transform the input into different representations, and the decoder can convert the new representation into the primary form. The auto-encoder can be used to reduce the dimensionality of the dataset, and for learning more abstract features [19][20]lating function of each neuron is indicated by Equation (1).
where [Math Processing Error] is the output vector of the ([Math Processing Error])th hidden layer (note that when [Math Processing Error], [Math Processing Error] is the input vector of the input layer of the whole network).
Figure 2. Graphical model of an ANN.
Typically, in an ANN model, the transfer functions are selected by the designer, and the weights and biases are adjustable parameters which can be adjusted by the learning means such as error back propagation algorithm. Therefore, the input and output relationship of the network can meet a specific goal [12,13]. Thus, the ANN model can be used to deduce a function from the observations, which is helpful in solving complex problems. Hence, it can be broadly applied in fault diagnosis, which is an essential classification problem.
2.2. Bayesian Network (BN)
The Bayesian network (also called belief network) [14] is a directed acyclic graph (as shown in ) where the nodes, such as [Math Processing Error], are perceived to be the propositional variables. The arrow between two nodes means that the two nodes are related directly, and the weight therein is quantified by a conditional probability. The two essential natures of these networks are consistency and completeness, while the chain-rule representation of the joint distributions is employed to guarantee the two natures for its form [15,16]:
Figure 3. A typical Bayesian network.
It can be seen that in the right-chained formula, each variable appears once on the left side of the conditioning bar, which can facilitate the dependence quantification of the network. For instance, the chain rule representation for the network shown in is:
The Bayesian network is a methodology integrating the probability theory and graph theory. Not only can it visually exhibit the structure of real tasks by graph, but it can also exploit the structure based on the principle of the probability theory, which would diminish the complexity of reasoning. Therefore, the Bayesian network is applied in many various domains. The Bayesian network also provides a framework for new models, and therein a naive Bayes model is normally selected for classification and prediction of multi-dimensional discrete time series [17,18].
2.3. Support Vector Machine (SVM)
The support vector machine (SVM) is a supervised learning technique developed based on a statistical learning theory, which aims to find a hyperplane (see ). It can separate n-dimensional inputs into two parts associated with the real distinct classes. The hyperplane can be depicted as [19]:
where [Math Processing Error] is the normal vector of the hyperplane and [Math Processing Error] is the bias. To ensure the generalization ability of the SVM, the simplest maximal margin bound was adopted, which implies:
where ([Math Processing Error]) is the [Math Processing Error]th sample of the training set, and [Math Processing Error]. Formula (5) is actually a convex quadratic programming problem and hence has no local minima [20,21]. By converting the problem with the Kuhn–Tucker condition into the equivalent Lagrangian dual quadratic optimization problem, the parameters of the SVM, namely [Math Processing Error] and [Math Processing Error], can be obtained [19,22]. Moreover, except for the maximal margin bound, there are other available generalization bounds, such as margin percentile bounds, soft margin bounds, and so on.
Figure 4. A maximal margin hyperplane with its support vectors circled.
The introduction above is based on the linear separable problem; however, most real tasks are nonlinear separable. Hence, the lower dimensional features should be mapped to a higher dimensional feature space utilizing kernel functions, so that the inputs can be linearly separated in the feature space. For this reason, the kernel function must be seriously selected for an efficient SVM classifier [21].
SVM is an initial tool designed for the binary classification. The strategies have to be established to accomplish multiclass classification. Three major SVMs based on distinctive structures are called the one-against-one SVM, one-against-all SVM, and directed acyclic graph (DAG) SVM [23,24].
2.4. Deep Learning (DL)
The artificial intelligence methods introduced above are all conventional machine learning algorithms. One thing they have in common is the performance of classification depending on the feature vector extracted artificially from the raw data, whereas the process of the fault diagnosis is desired to be fully automatic. Deep learning (DL) offers the probability to approach this task [25].
The deep learning model is composed of multiple processing modules and each module transforms the representation from the last layer to a higher and more abstract level in the current layer. With enough suitable modules combined, the extremely intricate relationships can be learned. The internal parameters of the deep learning machine are obtained by utilizing a backpropagation algorithm based on a large set of data. The convolution neural network (CNN), deep belief network (DBN), and auto-encoder are the three main deep learning methods. The CNN is designed to process data with the form of multiple arrays, such as time series and image data [26]. The DBN is an undirected bipartite graphical model stacked by several restricted Boltzmann machines. A Boltzmann machine (BM) is an energy-based model, and its modeling capacity can be improved by increasing the number of hidden variables [27].
An auto-encoder is a purely unsupervised representation learning algorithm. An auto-encoder consists of an encoder and a decoder. The encoder can transform the input into different representations, and the decoder can convert the new representation into the primary form. The auto-encoder can be used to reduce the dimensionality of the dataset, and for learning more abstract features [27,28].
3. Applications of Machine Learning in Fault Diagnosis of the Reciprocating Compressor
Since the performance of most machine learning methods mainly depends on the feature extractor used before the classification, the selection of the feature extractor depends on the characteristics of the raw signals. Therefore, the subsequent section is divided into four parts according to the nature of signals, and the different machine learning methods were specified by different paragraphs in each part.
3.1. Fault Diagnosis Based on Process Parameters
The parametric method is a diagnostic method for the reciprocating compressors based on process parameters including the compressor pressure, temperature, flow rate, etc.
3.1.1. Fault Diagnosis Based on p–V Diagram
The compressor pressure can be monitored via p–V diagram, which is one of the most typical process parameters. The p–V diagram is a two-dimensional cycle diagram which shows the variation trend of dynamic pressure in the compressor chamber with the working volume in a working cycle. The fault of the compressor valves, piston rings, support rings, and other components such as shaft, lubrication oil, and bearings can lead to the change of the pressure in the cylinder, and then the shape of the p–V diagram. Hence, the p–V diagram (cylinder pressure) is a very useful parameter for fault diagnosis in reciprocating compressors.
The support vector machine (SVM) has been widely applied in fault diagnosis based on a p–V diagram. Feng et al. [21] proposed a recognition approach for fault detection based on a p–V diagram using discrete 2D-curvelet transform, nonlinear principal component analysis (PCA), and SVM methods. The data dimension reduction with PCA and the multi-class SVM classifier are used to classify five valve faults in reciprocating compressors. Pichler et al. [22][23] detected broken reciprocating compressor valves in the p–V diagram. The gradient of the expansion phase of the p–V diagram, extracted in a logarithmic coordinate, and the pressure difference between the suction and discharge were used as the features to train the SVM classifiers which were aimed to discriminate between the faultless and faulty cases with six kinds of valves, respectively. The method was validated using real-world data and the results showed a high classification accuracy. Wang et al. [24] introduced an automated evaluation of the p–V diagram. They determined seven invariant moments of the p–V diagram and classified them using the SVM method. In another research [25], Jiang et al. conducted research on RC p–V diagram fault recognition using the SVM method. The fault features were extracted from the indicator diagram by the feature points extraction method. A fault recognition model was constructed based on multi-classification SVM and decision tree with the feature vectors.
The support vector machine (SVM) has been widely applied in fault diagnosis based on a p–V diagram. Feng et al. [29] proposed a recognition approach for fault detection based on a p–V diagram using discrete 2D-curvelet transform, nonlinear principal component analysis (PCA), and SVM methods. The data dimension reduction with PCA and the multi-class SVM classifier are used to classify five valve faults in reciprocating compressors. Pichler et al. [30,31] detected broken reciprocating compressor valves in the p–V diagram. The gradient of the expansion phase of the p–V diagram, extracted in a logarithmic coordinate, and the pressure difference between the suction and discharge were used as the features to train the SVM classifiers which were aimed to discriminate between the faultless and faulty cases with six kinds of valves, respectively. The method was validated using real-world data and the results showed a high classification accuracy. Wang et al. [32] introduced an automated evaluation of the p–V diagram. They determined seven invariant moments of the p–V diagram and classified them using the SVM method. In another research [33], Jiang et al. conducted research on RC p–V diagram fault recognition using the SVM method. The fault features were extracted from the indicator diagram by the feature points extraction method. A fault recognition model was constructed based on multi-classification SVM and decision tree with the feature vectors.
The artificial neural network (ANN) also has been used in fault diagnosis based on p–V diagram. Namdeo et al. [26] used an ANN method to detect the valve leakage in RCs. The healthy expansion process of the RC was predicted by the functional link network. A back propagation algorithm is applied to predict the percentage of leakage based on the pressure deviation at a particular instant of time. In another study [27], the features were extracted from raw pressure signal with wavelet packet decomposition. The extracted features, along with temperature data, were used to train a logistic regression model for classifying valve faults. The features were also applied to train a recurrent neural network (RNN) to predict the future performance, namely wavelet energy features of the pressure signal of the system, which could also indicate the detection of the valve failures. Tang et al. [28] used an ANN method to analyze the fault diagnosis of RC gas valves based on geometrical property of the p–V diagram. The features were applied to train the BP neural network, resulting in a network with 100% recognition rate. In the literature [29], the p–V diagrams were normalized before the BP neural network was applied to recognize the failure conditions of RCs.
The artificial neural network (ANN) also has been used in fault diagnosis based on p–V diagram. Namdeo et al. [34] used an ANN method to detect the valve leakage in RCs. The healthy expansion process of the RC was predicted by the functional link network. A back propagation algorithm is applied to predict the percentage of leakage based on the pressure deviation at a particular instant of time. In another study [35], the features were extracted from raw pressure signal with wavelet packet decomposition. The extracted features, along with temperature data, were used to train a logistic regression model for classifying valve faults. The features were also applied to train a recurrent neural network (RNN) to predict the future performance, namely wavelet energy features of the pressure signal of the system, which could also indicate the detection of the valve failures. Tang et al. [36] used an ANN method to analyze the fault diagnosis of RC gas valves based on geometrical property of the p–V diagram. The features were applied to train the BP neural network, resulting in a network with 100% recognition rate. In the literature [37], the p–V diagrams were normalized before the BP neural network was applied to recognize the failure conditions of RCs.
Guerra [30] extracted data from the dynamic pressure signal processed with a binned fast Fourier transform (FFT) and PCA for the detection of valve faults through Bayesian classification at 50% and 100% load.
Guerra [38] extracted data from the dynamic pressure signal processed with a binned fast Fourier transform (FFT) and PCA for the detection of valve faults through Bayesian classification at 50% and 100% load.
Tran et al. [31] applied a noise removal method on the pressure and current signals, which was based on the wavelet transforms, and adopted a Teager–Kaiser energy operator to estimate the amplitude envelope (AM signal) of the transient vibration signal. Then the DBN was applied to classify the RC valve faults.
Tran et al. [39] applied a noise removal method on the pressure and current signals, which was based on the wavelet transforms, and adopted a Teager–Kaiser energy operator to estimate the amplitude envelope (AM signal) of the transient vibration signal. Then the DBN was applied to classify the RC valve faults.
The applications of three main traditional ML methods and deep learning in RC fault diagnosis based on p–V diagram were reviewed in this section; it is obvious that SVM and ANN are widely used in this field.
3.1.2. Fault Diagnosis Based on Pressures Measured in Other Volumes
Except for p–V diagrams, pressures measured in other volumes can also be used to recognize faults.
Tiwari and Yadav [32] applied an ANN method in condition monitoring of a defective RC. The corresponding values of the pressure pulsations in the discharge pipe were simulated to train the ANN for predicting the percent leakage of discharge valves.
Tiwari and Yadav [40] applied an ANN method in condition monitoring of a defective RC. The corresponding values of the pressure pulsations in the discharge pipe were simulated to train the ANN for predicting the percent leakage of discharge valves.
Guerra and Kolodziej [33] proposed a data-driven approach for condition monitoring of RC valves. An FFT was applied to the pressure wave measured in the environment around the discharge valve, and then the FFT values were grouped into several frequency bins. Afterwards, PCA was used to reduce the dimension of the vectors. Finally, the results were used to train the Bayes classifier, which successfully classified various levels of the valve degradation with high accuracy.
Guerra and Kolodziej [41] proposed a data-driven approach for condition monitoring of RC valves. An FFT was applied to the pressure wave measured in the environment around the discharge valve, and then the FFT values were grouped into several frequency bins. Afterwards, PCA was used to reduce the dimension of the vectors. Finally, the results were used to train the Bayes classifier, which successfully classified various levels of the valve degradation with high accuracy.
The applications of ML methods in RC fault diagnosis based on pressures measured in other volumes (except for cylinder) were reviewed in this section; it is suggested that research about RC fault detection based on pressures measured in volumes is few, and ANN and Bayes classifier were employed.
3.2. Fault Diagnosis Based on Vibration Signals
Vibration analysis is a typical monitoring method of RCs. Many faults in RCs lead to abnormal vibration which could be diagnosed from the vibration signals comprising lots of machinery information.
Qin et al. [34] presented a novel SVM scheme composed of three steps: denoising via basis pursuit, feature extraction via wave matching, and classification via support vector machine. The basis pursuit was applied to suppress the background noise and enhance the major component in the vibration signal. Then, the feature extraction was carried out by matching the denoised signal with parameterized waveform, which was optimized by a differential evolution algorithm. In the end, the SVM was carried out in the valve fault classification with 100% accuracy. Ren et al. [19] used SVMs in the automated diagnosis of valve operating conditions. The input features were extracted from the vibration signals using the local wave and higher-order statistical methods. Chen et al. [35] extracted wavelet packet entropy of vibration signals as working condition eigenvectors, and the signals were trained with an SVM classifier. Cui et al. [36] proposed an SVM classifier trained with information entropy extracted from vibration signals. Potocnik et al. [37] developed a semi-supervised approach based on vibration signals which included statistical evaluation extracted from the signals and principal component analysis as preprocess, and then a comparative analysis of classification methods including discriminant analysis (DA), neural networks (NN), SVM, and extreme learning machines (ELM) was conducted. The results showed that the nonlinear classifier performed better. Pichler [38][39] focused particularly on valve fault detection under variable operation conditions. The features of the vibration signals were extracted from the spectrogram difference with two-dimensional correlation. The classification performance was validated using SVMs and logistic regression. Pichler [39] proposed an independent method for detecting the valve faults based on the vibration measurements using several different valves. The classifiers, such as the logistic rule (in a two-class setup) and SVMs (in two-class as well as one-class setup) were compared with each other. The results showed the three classifiers performed equally good for plastic valve faults. However, the two-class SVMs were better for the steel valve faults.
Qin et al. [42] presented a novel SVM scheme composed of three steps: denoising via basis pursuit, feature extraction via wave matching, and classification via support vector machine. The basis pursuit was applied to suppress the background noise and enhance the major component in the vibration signal. Then, the feature extraction was carried out by matching the denoised signal with parameterized waveform, which was optimized by a differential evolution algorithm. In the end, the SVM was carried out in the valve fault classification with 100% accuracy. Ren et al. [27] used SVMs in the automated diagnosis of valve operating conditions. The input features were extracted from the vibration signals using the local wave and higher-order statistical methods. Chen et al. [43] extracted wavelet packet entropy of vibration signals as working condition eigenvectors, and the signals were trained with an SVM classifier. Cui et al. [44] proposed an SVM classifier trained with information entropy extracted from vibration signals. Potocnik et al. [45] developed a semi-supervised approach based on vibration signals which included statistical evaluation extracted from the signals and principal component analysis as preprocess, and then a comparative analysis of classification methods including discriminant analysis (DA), neural networks (NN), SVM, and extreme learning machines (ELM) was conducted. The results showed that the nonlinear classifier performed better. Pichler [46,47] focused particularly on valve fault detection under variable operation conditions. The features of the vibration signals were extracted from the spectrogram difference with two-dimensional correlation. The classification performance was validated using SVMs and logistic regression. Pichler [47] proposed an independent method for detecting the valve faults based on the vibration measurements using several different valves. The classifiers, such as the logistic rule (in a two-class setup) and SVMs (in two-class as well as one-class setup) were compared with each other. The results showed the three classifiers performed equally good for plastic valve faults. However, the two-class SVMs were better for the steel valve faults.
Na Lei et al. [40] proposed an integration approach based on the local mean decomposition (LMD) method and autoregressive–generalized autoregressive conditional heteroscedasticity (AR-GARCH) model to extract the features of the vibration signal. Then, the back propagation (BP) neural networks were applied to diagnose the faults of RC valves. Lin et al. [41][42][43] conducted research on the automated valve condition classification. They processed the raw vibration signals using time–frequency analysis such as short time Fourier transform (STFT), smoothed pseudo-Wigner–Ville distribution (SPWVD), and the reassigned smoothed pseudo-Wigner–Ville distribution (RSPWVD). Then, a data reduction algorithm was used to extract fault features which was fed to a probabilistic neural network (PNN) for fault classification. Three modification indices were proposed to extract fault features. The results showed that the modified indices were better than the original indices in the literature [43]. The genetic algorithm was applied to automate the classification process to improve the prediction accuracy [42]. The authors [41] further revealed that the applicability of the resigned smooth pseudo-Wigner–Ville distribution (RSPWV) was better than Wigner–Ville distribution (WVD) and the spectrogram (SP) in the probability neural network classification system. Meanwhile, Ahmed et al. [44][45] also conducted studies about fault classification on RCs. They found that the classification performance of features from the frequency domain were better than those from the time domain which were extracted from vibration signals with a probabilistic neural network (PNN). They further proposed a PNN optimized by GA, in which classification accuracy was higher than the original one. The authors [46] also developed a one-against-one scheme based on the relevance vector machine (RVM) and a multiclass multi-kernel RVM (mRVM). Both methods were optimized by GA, and their classification accuracies were up to 97%. Diego Cabrera et al. [47] developed a long short-term memory (LSTM)-based classifier for valve faults trained with preprocessed vibration time series, and the hyperparameters were optimized by Bayesian method. Li et al. [48] proposed an improved wavelet neural network (WNN) in which original parameters were obtained by genetic algorithm (GA). Yang et al. [49] proposed an online network, adaptive resonance theory–Kohonen network (ART–KNN), which performed more suitable than self-organizing feature map and learning vector quantization on production line. In another study [50], the Wigner–Ville distributions (WVD) of the vibration acceleration signals were calculated and displayed in grey images and the PNN was directly used to classify the new time–frequency images after the images were normalized.
Na Lei et al. [48] proposed an integration approach based on the local mean decomposition (LMD) method and autoregressive–generalized autoregressive conditional heteroscedasticity (AR-GARCH) model to extract the features of the vibration signal. Then, the back propagation (BP) neural networks were applied to diagnose the faults of RC valves. Lin et al. [49,50,51] conducted research on the automated valve condition classification. They processed the raw vibration signals using time–frequency analysis such as short time Fourier transform (STFT), smoothed pseudo-Wigner–Ville distribution (SPWVD), and the reassigned smoothed pseudo-Wigner–Ville distribution (RSPWVD). Then, a data reduction algorithm was used to extract fault features which was fed to a probabilistic neural network (PNN) for fault classification. Three modification indices were proposed to extract fault features. The results showed that the modified indices were better than the original indices in the literature [51]. The genetic algorithm was applied to automate the classification process to improve the prediction accuracy [50]. The authors [49] further revealed that the applicability of the resigned smooth pseudo-Wigner–Ville distribution (RSPWV) was better than Wigner–Ville distribution (WVD) and the spectrogram (SP) in the probability neural network classification system. Meanwhile, Ahmed et al. [52,53] also conducted studies about fault classification on RCs. They found that the classification performance of features from the frequency domain were better than those from the time domain which were extracted from vibration signals with a probabilistic neural network (PNN). They further proposed a PNN optimized by GA, in which classification accuracy was higher than the original one. The authors [54] also developed a one-against-one scheme based on the relevance vector machine (RVM) and a multiclass multi-kernel RVM (mRVM). Both methods were optimized by GA, and their classification accuracies were up to 97%. Diego Cabrera et al. [55] developed a long short-term memory (LSTM)-based classifier for valve faults trained with preprocessed vibration time series, and the hyperparameters were optimized by Bayesian method. Li et al. [56] proposed an improved wavelet neural network (WNN) in which original parameters were obtained by genetic algorithm (GA). Yang et al. [57] proposed an online network, adaptive resonance theory–Kohonen network (ART–KNN), which performed more suitable than self-organizing feature map and learning vector quantization on production line. In another study [58], the Wigner–Ville distributions (WVD) of the vibration acceleration signals were calculated and displayed in grey images and the PNN was directly used to classify the new time–frequency images after the images were normalized.
Kolodziej et al. [51] trained a Bayesian classifier for early detection of the spring fatigue and valve seat wear in RCs, and validated it using experimental data. The vibration data was processed using the Wigner–Ville spectrum and quantified using image-based statistical features. The principal component analysis (PCA) was utilized to reduce the feature space.
Kolodziej et al. [59] trained a Bayesian classifier for early detection of the spring fatigue and valve seat wear in RCs, and validated it using experimental data. The vibration data was processed using the Wigner–Ville spectrum and quantified using image-based statistical features. The principal component analysis (PCA) was utilized to reduce the feature space.
Tran et al. [52] proposed a hybrid deep belief network (HDBN) which integrated the DBN for pretraining and simplified fuzzy ARTMAP (SFAM) for fault classification. The results showed a great improvement in comparison with the original DBN in classification accuracy.
Tran et al. [60] proposed a hybrid deep belief network (HDBN) which integrated the DBN for pretraining and simplified fuzzy ARTMAP (SFAM) for fault classification. The results showed a great improvement in comparison with the original DBN in classification accuracy.
The applications of ML methods in RC fault diagnosis based on vibration signals were reviewed in this section. There are considerable studies focusing on the fault detection techniques based on vibration signals, and similar to p–V diagram, lots of different SVM models and ANN models were employed as classifiers in these cases, whereas Bayes classifier and deep learning were barely used.
3.3. Fault Diagnosis Based on Acoustic Emission (AE)
Acoustic emission refers to the generation of transient elastic waves produced by a rapid release of energy from a localized source within the surface of material, according to the American Society for Testing and Materials (ASTM) [53][54]. By detecting AE signals generated in the reciprocating motion, acoustic emission can be used to discriminate the different types of damage occurring in an RC.
Acoustic emission refers to the generation of transient elastic waves produced by a rapid release of energy from a localized source within the surface of material, according to the American Society for Testing and Materials (ASTM) [61,62]. By detecting AE signals generated in the reciprocating motion, acoustic emission can be used to discriminate the different types of damage occurring in an RC.
Ali et al. [55][56] investigated fault detection technologies based on artificial intelligence (AI) and AE signals. They proposed two AI models to detect the valve condition in a reciprocating compressor based on several AE signals using SVM and ANN [55][56]. In the literature [57], the ANN and SVM models were trained and evaluated for detection of valve faults in an RC. The results showed that the accuracy of the ANN and SVM detection methods were similar, but the SVM had better ability of handling a large number of input features with low sampling datasets. Zhang et al. [58] extracted the root mean square (RMS), average signal level (ASL) of the time domination, and peak value of the frequency domination as the eigenvectors in the SVM model. With the SVM model, the leakage of the pipeline valve could be recognized. Sim et al. [59] employed the time–frequency analysis of the AE signal through the discrete wavelet transform (DWT) and assessed the characteristics of four acoustic emission parameters [59]. The result revealed that the acoustic emission root mean square (RMS) performed the best. Then, the k-nearest neighbor (KNN) and support vector machine (SVM) classification methodologies were applied to detect the valve faults with AE RMS before estimation of the valve flow rate through regression model [12].
Ali et al. [63,64] investigated fault detection technologies based on artificial intelligence (AI) and AE signals. They proposed two AI models to detect the valve condition in a reciprocating compressor based on several AE signals using SVM and ANN [63,64]. In the literature [65], the ANN and SVM models were trained and evaluated for detection of valve faults in an RC. The results showed that the accuracy of the ANN and SVM detection methods were similar, but the SVM had better ability of handling a large number of input features with low sampling datasets. Zhang et al. [66] extracted the root mean square (RMS), average signal level (ASL) of the time domination, and peak value of the frequency domination as the eigenvectors in the SVM model. With the SVM model, the leakage of the pipeline valve could be recognized. Sim et al. [67] employed the time–frequency analysis of the AE signal through the discrete wavelet transform (DWT) and assessed the characteristics of four acoustic emission parameters [67]. The result revealed that the acoustic emission root mean square (RMS) performed the best. Then, the k-nearest neighbor (KNN) and support vector machine (SVM) classification methodologies were applied to detect the valve faults with AE RMS before estimation of the valve flow rate through regression model [20].
The applications of ML methods in RC fault diagnosis based on AE signals were reviewed in this section. The amount of studies in this field is less than for p–V diagram and vibration signal; also, the applications of classifiers mainly focused on ANN and SVM.
3.4. Fault Diagnosis Based on Multi-Source Signals
The faults in RCs are intricate, and it is difficult to recognize all of them by a single signal or parameter. Therefore, it is important to conduct studies on fault detection based on multi-source signals.
Yang et al. [60] studied the condition classification of a small reciprocating compressor for refrigerators using ANN and SVMs. The noise and vibration signals were wavelet-transformed into the frequency sub-bands and the fault features were extracted using the statistical method. The classification performance of the SVM, self-organizing feature map (SOFM), SOFM associated with learning vector quantization (LVQ), and LVQ were compared with each other. The results showed that the SVM and LVQ methods performed better than the other methods. Zhang et al. [61] proposed an RC fault diagnosis method based on sensitive parameters extracted by scatter matrix method and SVM. The sensitive parameters were assessed by distance evaluation method. The accuracy of the new method is superior to the traditional methods. A fault detection system integrating data analysis and machine-learning was proposed by Qi et al. [62]. The raw data was denoised by robust principal component analysis (RPCA) first, then the core information of the compressor signal was extracted by a sparse coding algorithm with online dictionary. Based on the learned dictionary, the potential faults were finally recognized and classified by the SVM using the one-on-one strategy.
Yang et al. [68] studied the condition classification of a small reciprocating compressor for refrigerators using ANN and SVMs. The noise and vibration signals were wavelet-transformed into the frequency sub-bands and the fault features were extracted using the statistical method. The classification performance of the SVM, self-organizing feature map (SOFM), SOFM associated with learning vector quantization (LVQ), and LVQ were compared with each other. The results showed that the SVM and LVQ methods performed better than the other methods. Zhang et al. [69] proposed an RC fault diagnosis method based on sensitive parameters extracted by scatter matrix method and SVM. The sensitive parameters were assessed by distance evaluation method. The accuracy of the new method is superior to the traditional methods. A fault detection system integrating data analysis and machine-learning was proposed by Qi et al. [70]. The raw data was denoised by robust principal component analysis (RPCA) first, then the core information of the compressor signal was extracted by a sparse coding algorithm with online dictionary. Based on the learned dictionary, the potential faults were finally recognized and classified by the SVM using the one-on-one strategy.
Li et al. [63] proposed an ART–artificial immune network for RC failure detection, integrating the adaptive resonance theory (ART) and artificial immune network (AIN). The network was trained by the suction pressure, discharge pressure, suction, and discharge temperatures from a multilevel RC. Wang et al. [64] established an RC intelligent diagnosis system based on multi-agent technology. The system involved monitoring agent, management agent, diagnosis agent, diagnosis method agent, fusion agent, human–computer interaction agent, and other modules. The monitoring agent integrated four signal types, such as vibration, temperature, displacement, and pressure. In addition, the diagnosis method agent included the expert system agent, fuzzy logic agent, neural networks agent, and so on.
Li et al. [71] proposed an ART–artificial immune network for RC failure detection, integrating the adaptive resonance theory (ART) and artificial immune network (AIN). The network was trained by the suction pressure, discharge pressure, suction, and discharge temperatures from a multilevel RC. Wang et al. [72] established an RC intelligent diagnosis system based on multi-agent technology. The system involved monitoring agent, management agent, diagnosis agent, diagnosis method agent, fusion agent, human–computer interaction agent, and other modules. The monitoring agent integrated four signal types, such as vibration, temperature, displacement, and pressure. In addition, the diagnosis method agent included the expert system agent, fuzzy logic agent, neural networks agent, and so on.
Zhang et al. [65] proposed an improved K-means algorithm (K-means algorithm is one of the clustering algorithms) for RC fault diagnosis. This new method has gotten rid of the algorithm’s dependence on the initial clustering centers.
Zhang et al. [73] proposed an improved K-means algorithm (K-means algorithm is one of the clustering algorithms) for RC fault diagnosis. This new method has gotten rid of the algorithm’s dependence on the initial clustering centers.
The applications of ML methods in RC fault diagnosis based on multi-source signals were reviewed in this section, and ANN and Bayes classifiers were mainly employed. Meanwhile, in this section, a clustering algorithm (K-means) [65] was applied in RC fault diagnosis. It can be the guide for future research about RC fault diagnosis.
The applications of ML methods in RC fault diagnosis based on multi-source signals were reviewed in this section, and ANN and Bayes classifiers were mainly employed. Meanwhile, in this section, a clustering algorithm (K-means) [73] was applied in RC fault diagnosis. It can be the guide for future research about RC fault diagnosis.