Targeted Therapeutic Approach for AML: Comparison
Please note this is a comparison between Version 1 by Moo kon Song and Version 2 by Vivi Li.

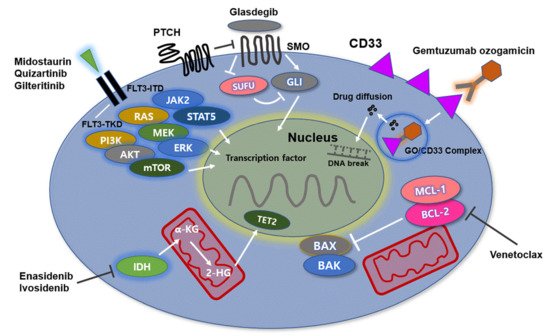
Acute myeloid leukemia (AML) is a heterogenous hematopoietic neoplasm with various genetic abnormalities in myeloid stem cells leading to differentiation arrest and accumulation of leukemic cells in bone marrow (BM). The multiple genetic alterations identified in leukemic cells at diagnosis are the mainstay of World Health Organization classification for AML and have important prognostic implications. Recently, understanding of heterogeneous and complicated molecular abnormalities of the disease could lead to the development of novel targeted therapeutic agents. In the past years, gemtuzumab ozogamicin, BCL-2 inhibitors (venetovlax), IDH 1/2 inhibitors (ivosidenib and enasidenib) FLT3 inhibitors (midostaurin, gilteritinib, and enasidenib), and hedgehog signaling pathway inhibitors (gladegib) have received US Food and Drug Administration (FDA) approval for the treatment of AML. Especially, AML patients with elderly age and/or significant comorbidities are not currently suitable for intensive chemotherapy. Thus, novel therapeutic planning including the abovementioned target therapies could lead to improve clinical outcomes in the patients.

  • acute myeloid leukemia
  • gemtuzumab ozogamicin
  • BCL-2

1. Introduction

Acute myeloid leukemia (AML) is a group of hematological malignancies characterized by rapid and uncontrolled growth of immature white blood cells in the bone marrow (BM) [1]. The various molecular alterations identified in leukemic cells at diagnosis are the mainstay of the World Health Organization classification for AML and have important prognostic implications. Some subtypes are associated with a favorable prognosis with intensive chemotherapy. However, the clinical outcome of AML is generally poor, with a worldwide 5-year overall survival rate of just 28% [2]. The prognosis is especially unfavorable in elderly patients, who tend to be ineligible for intensive chemotherapy; the median survival time in such patients is less than 1 year [3]. In addition, since the cytarabine and idarubicin regimen was established as the standard induction chemotherapy for AML, it has remained unchanged [4]. The regimen is of limited therapeutic efficacy in many different genetic subtypes of AML. Thus, novel effective therapies are needed for such patients.
The revolution in understanding the genetic alterations of AML that has been driven by next-generation sequencing has resulted in numerous therapeutic options against potential driver mutations such as FMS-like tyrosine kinase three-internal tandem duplication (FLT3-ITD) and isocitrate dehydrogenase (IDH) mutations [5]. The 2017 European Leukemia Net (ELN) criteria provide useful information to determine the best therapeutic option between conventional and novel therapies. According to the criteria, AML patients are separated into favorable, intermediate, and adverse risk groups [6]. In the German-Australian AML Study Group, the prognostic impact of many mutations is characterized by the combined effect of concomitant molecular abnormalities [7]. NPM1 mutation is associated with a favorable prognosis in the absence or very low allele ratio of the FLT3-ITD mutation. However, tumor protein 53 (TP53) mutation is strongly associated with adverse prognosis and mainly occurs in secondary or therapy-related AML, mostly characterized by complex cytogenetics.
The use of hypomethylation agents (HMAs) or low-dose cytarabine (LDAC) treatment options in patients unfit for intensive chemotherapy or stem cell transplantation (SCT) were recently shown to be modestly effective but not satisfactory [8][9][8,9]. Advancements in our understanding of the genetic basis of AML over the last decade have led to the rapid development of targeted therapies. Complicated genetic mutations in AML patients could reflect several biological diseases classified by cytogenetically and molecularly defined risk. In addition, a large amount of data about novel targeted therapies for AML have shown promising results, particularly in patients without alternative therapeutic options.

2. Anti-CD33 Directed Antibody

Mechanism of Action

Gemtuzumab ozogamicin (GO) is a CD33-directed antibody–drug conjugate (ADC) composed of h67.6, a CD33-directed monoclonal antibody, covalently linked to the cytotoxic agent N-acetyl γ calicheamicin [10][24]. The efficacy of GO is associated with the ubiquitous nature of CD33 as a potent target for immunotherapeutic options for AML. CD33 inhibits cell signaling by recruiting SHP-1 and 2 upon phosphorylation of tyrosine residues located within the immune-receptor tyrosine-based inhibitory motif domain on the cytoplasmic tail of the protein [11][25]. CD33 is internalized when it engages with antibodies. Notably, the activity of GO is derived from internalization of the ADC after successful binding of the monoclonal antibody to the immunoglobulin (Ig) V domain of CD33 on the surface of leukemic cells (Figure 1) [12][26].
Figure 1. The molecular mechanisms of AML: Molecular dysregulation alters the expression profile of genes such as CD33, IDH1/2, FLT3, and BCL-2. The activity of gemtuzumab ozogamicin (GO) is derived from internalization of the CD33-GO complex after successful binding of the monoclonal antibody on the surface of leukemic cells, leading to apoptosis of leukemic cells. FLT3 mutations stimulate downstream signaling through JAK2/STAT5, PI3K/AKT/mTOR, and RAS/MEK/ERK. AML cells with FLT3-ITD mutations have a high genetic instability due to DNA double-strand breaks and are associated with poor clinical outcomes. Midostaurin, quizartinib, and gilteritinib effectively inhibit FLT3-ITD mutations. IDH1/2 mutation leads to reduction of α-ketoglutarate to R2-hydroxyglutarate (R2-HG) as an oncometabolite. IDH inhibitors inhibit production of R2-HG and thus block proliferation of leukemic cells. BCL-2 and MCL-1 prevent apoptosis of leukemic cells by regulating effector proteins such as BAX and BAK as cell death mediators. The native BH3-only protein venetoclax binds to BCL-2, thereby relieving the constraints on BAX/BAK activation and initiating apoptosis. The HH/GLI signaling pathway is associated with hematopoietic stem cell function. In leukemia cells, the signaling pathway is involved in resistance of AML cells to chemotherapy. Glasdegib effectively inhibits the HH/GLI signaling pathway by binding to SMO. Abbreviations: IDH, isocitrate dehydrogenase; FLT3, FMS-like tyrosine kinase 3; BCL-2, B-cell lymphoma-2; JAK2/STAT5, Janus kinase 2/signal transducer and activator of transcription 5; PI3K/AKT/mTOR, phosphoinositide 3-kinase/Akt/mechanistic target of rapamycin; RAS/MEK/ERK, rat sarcoma/rapidly accelerated fibrosarcoma/extracellular signal-regulated kinase; ITD, internal tandem duplication; HH/GLI, hedgehog/glioma-associated oncogene homolog; AML, acute myeloid leukemia.
Calicheamicin is a potent antitumor antibiotic from Micromonospora echinospora that is responsible for the cytotoxic activity of GO [13][27]. Once the GO-CD33 complex is internalized, the acidic lysosomal interior hydrolyzes the disulfide bond connecting calicheamicin to the acid-labile linker of GO, releasing free calicheamicin into the cell [10][24]. After the GO-CD33 complex is internalized, which occurs rapidly, the complex is routed to the lysosomes of the cytoplasm. In the acidic environment of the lysosome, the butanoic acid linker is hydrolyzed, releasing the toxic moiety of GO. The calicheamicin derivative is reduced by glutathione into a highly reactive species, which induces simple and double-stranded DNA breaks, resulting in DNA damage [14][28]. Then, the downstream DNA repair pathway is activated through the ataxia-telangiectasia mutated (ATM)/ataxia-telangiectasia and Rad3-related (ATR) and DNA-dependent protein kinase pathways and ATM/ATR proteins phosphorylate CHK1/CHK2 proteins, leading to G2M cell cycle arrest. ATM/ATR are two leading proposed DNA damage response pathways that are activated as a result of these breaks, leading to apoptosis of leukemic cells [15][16][17][29,30,31].

3. Gemtuzumab Ozogamicin, Anti-CD33 Antibody

3.1. Clinical Data

GO initially received accelerated FDA approval in 2000 based on phase II clinical trial data. The trial revealed a benefit of GO as a single agent in patients over the age of 60 with CD33+ AML at a dose of 9 mg/m2/day on days 1 and 14 [18][32]. The data showed an objective response rate (ORR) of 30% and a complete response (CR) rate of 16.2%. In the 2004 post-approval phase III trial SWOG S0106 study, patients were randomized to receive either standard induction with daunorubicin (60 mg/m2/day on days 1, 2, and 3) and cytarabine (100 mg/m2/day from days 1–7) (DA) or a GO-containing induction with lower doses of daunorubicin (45 mg/m2/day on days 1, 2, and 3), cytarabine (100 mg/m2 from days 1–7) and GO (6 mg/m2 on day 4; DA + GO) [19][33]. The addition of GO did not show a clinical benefit but was associated with an increased early mortality rate. Interestingly, DA combined with GO improved relapse-free survival (RFS) among patients in the favorable cytogenetic risk group (hazard ratio [HR]; 0.49; p = 0.043).
In Table 12, the phase III MRC AML15 trial enrolled 1113 patients younger than 60 years of age, who were randomized to receive a lower dose (3 mg/m2) of GO in induction 1 and in consolidation, in addition to the standard or other experimental treatments [20][21][34,35]. The study had three different induction arms, including ADE, DA, and Ida/FLAG. Overall, the addition of GO was well tolerated without a substantial increase in toxicity. However, based on the original GO randomization scheme, the addition of GO was not associated with improved outcomes. The only patients who benefitted from GO therapy were those with favorable karyotypes. Meanwhile, the group with intermediate or high cytogenetic risk showed no significant survival benefits.
Table 12. Clinical trials on novel targeted therapies for acute myeloid leukemia patients.
Author (Refer.) Therapeutic Schedule Phase/Population Clinical Outcome
Anti-CD33 monoclonal antibody
Petersdorf et al. GO—6 mg/m2 on day 4. additional 3 doses,

5 mg/m2 in CR patients after consolidation

GO + modified DA vs. standard DA
Phase III, ND AML, n= 595 ORR, 76% in DA plus GO group vs. 74% in DA alone

(p = 0.36)

CR, 69% vs. 70% (p = 0.69)

5-yr RFS, 47% vs. 42% (p = 0.87)

5-yr OS, 46% vs. 50% (p = 0.09)
Castaigne et al.

ALFA-0701
DA +/−

GO—3 mg/m2 for day 1, 4, and 7 of induction,

3 mg/m2 for day 1 of two consolidations
Phase III, ND AML, n = 278 CR/CRi, 81 in GO + group vs. 75% in GO—group (p = 0.25)

2-yr EFS, 40.8 vs. 17.1% (p = 0.0003)

2-yr OS, 53.2 vs. 41.9% (p = 0.0368)

2-yr RFS, 50.3 vs. 22.7% (p = 0.0003)

Survival benefit—favorable and intermediate-risk group
Burnett et al.

MRC-AML15
GO—3 mg/m2 for day 1

+ DA, 2 cycles, FLAG-ida or ADE
Phase III, ND AML, n = 1113 Addition of GO—no different in OS, RFS, and TRM.

But, OS ↑ in favorable cytogenetic risk (79 vs. 51%, p = 0.0003)
Burnett et al.

NCRI-AML16 and LRF AML 14
GO—3 mg/m2 for day 1

+ DA or DC (daunorubicin + claforabine, D 1-5)
Phase III, ND AML, n = 1115 IC—↑ RFS (28 vs. 23%, p = 0.03) and ↑ CR (35 vs. 29 and, p = 0.04)

Non-IC—↑ ORR (17 vs. 30%, p = 0.006) and ↑ CR (11 vs. 21%, p = 0.002)

But, no improvement of OS
Burnett et al.

NCRI-AML17
GO—3 mg or 6 mg/m2 for day 1

+ DA or ADE (DA + etoposide)
Phase III, ND AML, n = 788 Significant higher CR rate in 3 mg GO group vs. 6 mg group (p = 0.03)

6 mg group—higher 30 and 60-day TRM (p = 0.02; p = 0.01)
Delaunay et al.

GEOLAMS-AML 2006 IR
GO—6 mg/m2 for day 1 + DA Phase III, ND AML, n = 238 CR—not different between GO + vs. GO- group

(91.6 vs. 86.5%, p = NS)

EFS, OS—not different between GO + vs. GO- group.VOD, hepatotoxicity, higher in GO + group (23 vs. 13%; p = 0.031)
Burnett et al.

EORTC-GIMEMA AML 19
GO—6 mg/m2 for day 1, 3 mg/m2 for day 8

vs. Best supportive care
Phase III, ND AML unfit for IC,

n = 237
OS, 4.9 months in GO group vs. 3.6 months BSC group (p = 0.005)

1-yr OS, 24.3% vs. 9.7%

OS benefit of GO, higher in women and favorable, intermediate-risk group.

CR + CRi in GO group, 27%
BCL-2 inhibitor
Combination study with hypomethylating agents
DiNardo et al.

Blood 2019
Venetoclax, 400, 800, 1200 mg + HMAs (AZA, or DEC) ND AML ≥ 60 years or unfit for IC,

n = 145
CR/CRi, 67% in all patients;

CR/CRi, 73% in venetoclax 400 mg/day group

Median CR/CRi duration, 11.3 months Median OS, 17.5 months
DiNardo et al.

NEJM 2020
Venetoclax, 400 mg/day + AZA Phase III, ≥75 years or unfit for IC,

n = 431
OS, 14.7 months in venetoclax-AZA group

vs. 9.6 months in control (p < 0.001)

CR/CRi, 36.7%/66.4% in venetoclax-AZA group

vs. 17.6%/28.3% in control (p < 0.001)
Combination study with Low dose cytarabine
Wei et al. (JCO) Venetoclax, 600 mg/day + LDAC   Median age, 74 yrs (range, 63–90 yrs)

In enrolled patients

CR/CRi, 54%; OS, 10.1 months; DOR, 8.1 months

In patients without prior HMA exposure,

CR/CRi, 62%; DOR, 14.8 months; OS, 13.5 months
Wei et al. (blood) Venetoclax, from 100 mg/day to 600 mg/day

+ LDAC
ND AML unfit for IC, n = 211 Median age, 76 yrs (range, 36–93 yrs)

OS, 8.4 mos in venetoclax + LDAC vs. 4.1 mos in LDAC alone (p = 0.04).

CR/CRi, 48% in venetoclax + LDAC vs. 13% in LDAC alone (p < 0.001)
FLT3 inhibitor
Midostaurin
Stone et al. Midostaurin, 50 mg/day twice/day + DA Phase Ib, ND AML, n = 29 CR, 92% in FLT3-ITD + vs. 74% in FLT3-WT (p = NS)

1 and 2-yr OS, 0.85, 0.62 in FLT3-ITD+ vs. 0.78, 0.52 in FLT3-WT (p = NS)

1-yr DFS, 50 in FLT3-ITD+ vs. 60% in FLT3-WT (p = NS)
Stone et al. DA +/− Midostaurin, 50 mg/day twice/day Phase III, ND AML, n = 717 OS, 74.7 in midostaurin, higher than 25.6 months in placebo (p = 0.009)

EFS, in midostaurin group, higher than placebo (p = 0.002)

CR, 58.9 in midostaurin vs. 53.5% in placebo (p = NS).

Midostaurin, beneficial in both ITD and TKD mutation

Severe toxicity, similar between two groups (p = NS)
Quizartinib
Cortes et al.

(JCO)
quizartinib, escalating doses of 12 to 450 mg/day Phase I, R/R AML +/− FLT3 status,

n =76
In enrolled patients—ORR/CR—30%/13%

ORR—53% in FLT3-ITD group vs. 14% FLT3-WT group
Cortes et al.

(lancet)
quizartinib monotherapy Phase II cohort, R/R AML, n = 333

Cohort 1 ≥ 60 yrs, R/R within 1 yr

Cohort 2 ≥ 18 yrs, R/R after salvage

or SCT
Cohort 1

Composite CR/CR—56%/3% in FLT3-ITD group

Compositive CR/CR—36%/5% in FLT3-WT group

Cohort 2

Composite CR/CR—46%/4% in FLT3-ITD group

Compositive CR/CR—30%/3% in FLT3-WT group
Cortes et al. quizartinib vs. investigator’s choice Phase III,

R/R AML with FLT-ITD +,

n = 367
OS, 6.2 in quizartinib vs. 4.7 months in chemotherapy (p = 0.02)

Therapy-related death, 17% vs. 17% (p = NS)
Gilteritinib
  gilteritinib, 120 mg/day vs. salvage chemotherapy Phase III,

R/R AML with FLT-ITD +,

n = 371
OS, 9.3 in gilteritinib vs. 5.6 months in chemotherapy (p < 0.001)

EFS, 2.8 months vs. 0.7 months (p = NS). CR with hematologic recovery, 34.0 vs. 15.3% (18.6, 95% CI; 9.8-27.4)
IDH1/2 inhibitor
Enasidenib
Stein et al. Dose-escalation phase, 50–650 mg/day/day

Expansion phase, 100 mg/day.day
Phase I/2, R/R AML,

n= 214
Median age, 68 years.

ORR/CR—38.8%/19.6%

BMT proceeding rate—10.3%

Medians OS, 8.8 months

RBC/PLT transfusion independence—40.2%/43.1%
Klink et al. Enasienib, 50–650 mg/day/day

Control group—other treatment group
Retrospective, R/R AML,

n = 200
Enasidenib, less refractory to induction than control group (p = 0.02)

CR/PR/LFS, enasidenib group, higher than control (p < 0.01)

Median PFS, 8.4 vs. 4.8 months (p = <0.01)

Median OS, 11.0 vs. 6.4 months (p < 0.01)
Riva et al. Enasidenib, 100 mg/day/day

Control group—other treatment group
Retrospective, R/R AML

n = 37
Median OS in enasidenib, higher than control (p = 0.0419)

PFS (p = NS)
Ivosidenib
DiNardo et al. ivosidenib 500 mg/d Phase I, R/R AML, n = 125 Median follow-up duration, 14.8 monthsORR/CRh/CR—41, 30, 22%

Duration of ORR/CRh/CR—6.5/8.2/9.3 months

In F/U 14.8 months, median OS 8,8 months
Paschka et al. Ivosidenib, 500 mg/day

Control group—other treatment group
Data analysis, R/R AML,

n = 434
OS, 8.1 in ivosidenib vs. 2.9 months control group (p < 0.0001)

6/12-month survival rate—55.7%/35.0 vs. 29.1%/10.8% (p < 0.001)

CR—18.3% vs. 7.0% (p < 0.001)
Hedgehog signaling inhibitor
Glasdegib
Cortes et al. Glasdegib, 100 mg + LDAC vs. LDAC alone Phase II, ND AML unfit for IC,

n = 132
Median OS was 8.8 months with glasdegib group

vs. 4.9 months with LDAC group (p = 0.0004)

CR, 17% in gladegib group vs. 2.3% in LDAC group (p < 0.05)

Grade ≥ 3 AE, pneumonia (16.7%), fatigue (14.3%)
Abbreviations: GO, gemtuzimab ozogamicin; CR, complete response; ND AML, newly diagnosed acute myeloid leukemia; ORR, overall response rate; DA, daunorubicin and anthracycline; RFS, relapse-free survival; OS, overall survival; IC, intensive chemotherapy; VOD, veno-occlusive disease; CRi, morphologic complete remission with incomplete blood count recovery; LDAC, low dose cytarabine; DOR, duration of response.
In contrast, the ALFA-0701 simple single open-label phase III study investigated the efficacy of a fractionated dose of GO, 3 mg/m2, in addition to standard induction chemotherapy in newly diagnosed de novo AML patients [22][36]. The patients were randomized to receive standard DA therapy or DA combined with GO therapy. GO was administered at 3 mg/m2 on days 1, 4, and 7 during induction therapy. The rates of remission (81% vs. 75%, p = 0.25) and 3-year OS (38% vs. 36%, p = 0.18) were not significantly improved in the GO group, while 3-year event-free survival (EFS; 31 vs. 19%, p = 0.0026) and 2-year RFS (38 vs. 25% p = 0.006) significantly improved in the GO group.
Moreover, a meta-analysis of 3325 patients from five randomized controlled trials, the MRC AML15, SWOG S0106, NCRI AML16, GOELAMS AML 2006 IR, and ALFA-0701 trials demonstrated that the addition of GO did not increase the portion of patients achieving CR/CRi but significantly reduced the risk of relapse and improved OS at 5 years [23][37]. In addition, the data showed that the low dose of GO, 3 mg/m2, was associated with fewer early deaths than the higher dose of 6 mg/m2, while the two were equally efficacious.
The NCRI AML17 trial was designed to identify the optimal dose of GO. The study patients were randomized to receive GO on day 1 of induction treatment at a dose of either 3 or 6 mg/m2. The CR rates were similar across both groups (82 vs. 87% p = 0.0) [24][38]. The ORRs were also similar (89% vs. 86%, p = 0.17). Moreover, the data showed that RFS and OS did not differ between the two groups (p = 0.5; p = 0.3). However, the 30-day mortality (7% vs. 3% p = 0.02) and 60-day mortality rates (9% vs. 5%, p = 0.01) were significantly higher in the 6 mg/m2 group than the 3 mg/m2 group (p = 0.02). Moreover, the incidence of veno-occlusive disease was higher in the 6 mg/m2 group (5.6% vs. 0.5%; p < 0.0001). The results revealed that there was no advantage in using a single dose of 6 mg/m2 GO compared with 3 mg/m2 in combination with induction therapy. In this regard, the lower fractionated GO dosing plan seems to produce better response and survival rates in a combination setting with standard induction therapy in AML patients.
Finally, the EORTC-GIMEMA AML-19 study showed an increase in OS rate in AML patients treated with GO-containing therapy, compared to best supportive care (BSC) when patients with newly diagnosed CD33-positive AML were treated with GO monotherapy at 6 mg/m2 on day 1 and 3 mg/m2 on day 8 [25][39]. The patients were randomly assigned to the two groups (118 to the GO group and 119 to the BSC group). The median OS was 4.9 months (95% CI, 4.2–6.8 months) in the GO group and 3.6 months (95% CI, 2.6–4.2 months) in the BSC group (HR, 0.69; 95% CI, 0.53–0.90; p = 0.005). The 1-year OS rate was 24.3% in the GO group and 9.7% in the BSC group. The OS benefit conferred by GO was consistent across most subgroups, and was especially apparent in patients with high CD33 expression status, in those with favorable/intermediate cytogenetic risk profiles, and in women. Overall, CR was observed in 30 of 111 (27%) patients in the GO group.

3.2. BCL-2 Inhibitor

Mechanisms of Action

The function of the BCL-2 protein is to prevent cellular apoptosis. Thus, overexpression of BCL-2 is significantly associated with inappropriate apoptosis, increased tumor overgrowth, and diminished sensitivity to chemotherapy [26][40]. In normal cells, antiapoptotic proteins such as BCL-2 and MCL-1 prevent apoptosis by constraining effector proteins (BAX and BAK) as cell death mediators. However, when cells are no longer required or undergo significant stresses, such as genotoxic damage, apoptosis is stimulated by activation of BCL-2 homology domain 3 (BH3)-only proteins such as BIM, BID, BAD, PUMA, NOKA, BIK, BMF, and HRK. These BH3-only proteins bind to and inhibit BCL-2 and MCL-1. Once BCL-2 is targeted in this manner, BAX and BAK cannot be constrained and drive cell death by causing mitochondrial damage. Since the binding of BH3-only proteins to BCL-2 or MCL-1 has a catalytic role in cell apoptosis, several substances that potently mimic their activity were developed to inhibit the activity of prosurvival proteins pharmacologically. Currently, the most advanced BH3 mimetic compound is venetoclax. Similar to the native BH3-only protein, venetoclax binds to BCL-2 with tight affinity, thereby relieving the constraint on BAX/BAK activation and initiating apoptosis (Figure 1) [27][28][41,42].

3.3. Venetoclax, BCL-2 Inhibitor

Clinical Data

Preclinical data demonstrated that AZA could reduce MCL-1 levels, mediating resistance to BCL-2 inhibitors. AZA primed AML cells for venetoclax-induced apoptosis via NOXA induction. Thus, AZA and venetoclax synergistically activated BAX and thus stimulated mitochondrial apoptosis in AML cells [29][30][43,44].
In Table 12, a large, multicenter, phase Ib dose-escalation and expansion study reported on the safety and efficacy of venetoclax with HMA in AML patients older than 65 years with treatment-naive AML who were ineligible for intensive chemotherapy [28][42]. During dose escalation, oral venetoclax was administered at 400, 800, or 1200 mg daily in combination with either decitabine (DEC) (20 mg/m2, days 1–5, intravenously [IV]) or azacytidine (AZA) (75 mg/m2, days 1–7, IV or subcutaneously [SC]). In the expansion, 400 or 800 mg venetoclax was given with either DEC or AZA. The median patient age was 74 years, and poor-risk cytogenetics was present in 49% of patients. In a median follow-up time of 8.9 months, the CR/CRi rates were 67% and did not differ between the AZA and DEC groups. Patients with poor-risk cytogenetics and those older than 75 years had CR/CRi rates of 60% and 65%, respectively. The median time to response was 1.2 cycles (months) and the MRD negativity rate among responders was 29%. With a median follow-up time of 15 months, the median duration of response (DOR) and OS were 13.1 and 17.5 months, respectively. Among patients with CR/CRi, median DOR was 11.3 months, and median OS was not reached. Although benefits were seen in all patients, outcomes differed between the molecular and cytogenetic subgroups. Accordingly, CR/CRi rates were higher in patients with NPM1 and IDH1/2 mutations (91 and 71%, respectively) and lower in patients with TP53 mutations and poor cytogenetics (47 and 60%, respectively). Median DOR was also longer in patients with NPM1 and IDH1/2 mutations (24.4 months) and shorter in those with FLT3 and TP53 mutations (7.2 months).
Another phase III, multicenter, randomized, double-blind, placebo-controlled trial was conducted to evaluate the efficacy and safety of AZA plus venetoclax, compared to AZA plus placebo in 431 newly diagnosed AML patients who were unfit for standard induction therapy due to coexisting comorbidities and age greater than 75 years old [31][45]. The patients were treated with AZA (75 mg/m2 SC or IV on day 1–7, 28-day cycle) plus venetoclax (target dose, 400 mg) or matching placebo administered orally in 28-day cycles. The intention-to-treat population included 431 patients (286 in the AZA-venetoclax group and 145 in the AZA–placebo control group). The median age was 76 years in both groups (range, 49–91 years old). At a median follow-up of 20.5 months, the median OS was 14.7 months in the AZA–venetoclax group versus 9.6 months in the control group (hazard ratio for death, 0.66; 95% CI, 0.52–0.85; p < 0.001). The incidence of CR was also higher in the AZA–venetoclax group than in the control group (36.7% vs. 17.9%; p < 0.001). Moreover, the composite CR and DOR were higher in the AZA-venetoclax group than in the control group (composite CR, 66.4 vs. 28.3%, p < 0.001; DOR, 17.8 vs. 13.9 months). The incidence of any-grade important adverse events (44% in the AZA-venetoclax group vs. 35% in the control group) and >grade 3 thrombocytopenia (45 vs. 38%, respectively), neutropenia (42 vs. 28%), febrile neutropenia (42 vs. 19%) and any-grade infections (84 vs. 67%) were also investigated.
A recent phase Ib/II study also investigated the safety and preliminary efficacy of venetoclax combined with LDAC in AML patients older than 60 years old and unfit for intensive chemotherapy. In the data, venetoclax (600 mg/day) was orally administrated in 28-day cycles, and LDAC (20 mg/m2 per day, SC) was given on days 1 to 10 [27][41]. The median age was 74 years (range, 63–90 years). Overall, 29% of the patients had previously received HMA, 49% had secondary AML, and 32% had poor-risk cytogenetic features. The early mortality rate was 6%. Moreover, 54% of the patients achieved CR/CRi. The median OS was 10.1 months (95% CI, 5.7 to 14.2), and the median DOR was 8.1 months (95% CI, 5.3 to 14.9 months). Among patients without prior HMA exposure, CR/CRi was achieved in 62% of cases, median DOR was 14.8 months, and median OS was 13.5 months (95% CI, 7.0 to 18.4 months). The most common grade 3 or greater adverse events were febrile neutropenia (42%), thrombocytopenia (38%), and neutropenia (34%). In addition, patients with NPM1 or IDH1/2 mutations had better outcomes (CR/CRi rate, 89 and 72%, respectively), compared to those with TP53 or FLT3 mutations (30 and 44%, respectively). The data showed that venetoclax plus LDAC showed a significantly improved safety profile, producing rapid and durable remission in older adults with AML ineligible for intensive chemotherapy.
In another international phase III randomized double-blind placebo-controlled trial, patients older than 18 years old with newly diagnosed AML ineligible for intensive chemotherapy were randomized 2:1 to receive venetoclax (n = 143) or placebo (n = 68) in 28-day cycles, plus LDAC on days 1 to 10 [32][46]. The median age was 76 years old (range, 36–93 years), 38% of patients had secondary AML and 20% had received prior HMA treatment. The planned data analysis showed that venetoclax plus LDAC led to a 25% reduction in the risk of death, compared to LDAC alone, but the difference was not statistically significant (HR, 0.75; 95% CI, 0.52–1.07; p = 0.11), although median OS was 7.2 vs. 4.1 months, respectively. The unplanned analysis showed that the venetoclax arm had significantly greater OS (8.4 months; HR, 0.70; 95% CI, 0.50–0.98; p = 0.04). The CR/CRi rates were 48 and 13% in the venetoclax plus LDAC group and LDAC alone group, respectively (p < 0.001). The reported adverse events greater than grade 3 (venetoclax vs. LDAC alone) were febrile neutropenia (32 vs. 29%), neutropenia (47 vs. 16%), and thrombocytopenia (45 vs. 37%). Venetoclax plus LDAC treatment was associated with significant improvements in response and OS, compared to LDAC alone, with a favorable safety profile.
In the abovementioned data, the efficacy of venetoclax-based chemotherapy was associated with prognosis in patients with specific cytogenetic abnormalities. In particular, patients with NPM1 and IDH 1/2 mutations treated with venetoclax-based chemotherapy had favorable median survival duration. The data suggest the utility of harnessing molecular strategies for patient selection to optimize response to venetoclax-based chemotherapy, particularly for AML patients with treatment-naïve NPM1 or IDH1/2 mutations unfit for intensive chemotherapy.