Your browser does not fully support modern features. Please upgrade for a smoother experience.
Please note this is a comparison between Version 2 by Lily Guo and Version 1 by Wen-Qiang Wu.
Single-molecule imaging is emerging as a revolutionary approach to studying fundamental questions in plants. However, compared with its use in animals, the application of single-molecule imaging in plants is still underexplored.
- Single-Molecule Labeling and Imaging Strategies
- single-molecule imaging in plants
- single-molecule tracking
1. Brief History of Single-Molecule Imaging
In 1961, Boris Rotman first proposed the possibility of using fluorescence microscopy to infer the presence of single molecules [11][1]. In 1976, Thomas Hirshfeld realized the direct detection of the protein globulin labeled with ≈100 fluorescein molecules [12][2]. The detection of single dye molecules was achieved by Michel Orrit and Jacky Bernard at cryogenic temperatures in 1990 [13][3]. However, most organisms live in non-cryogenic environments. The single-molecule detection of fluorescent molecules in the liquid phase at room temperature was realized in 1994 [14][4]. Sako then performed the first single-molecule measurements in living cells in 2000 [15][5]. Due to the poor optical properties of plant cells, it was not until 2011 that Lin’s laboratory applied single-molecule fluorescence technology to plant cells for the first time [16][6]. Since then, single-molecule imaging has been applied to many complex biological processes [9,17,18,19][7][8][9][10].
2. Single-Molecule Labeling and Imaging Strategies
When one protein is studied by single-molecule imaging, it is labeled with a fluorophore so that it can be distinguished from the background. Compared with imaging in animals, plant imaging is mainly limited by the large amount of autofluorescence and thick cell walls. Plant autofluorescence arises from a variety of compounds, such as chlorophyll and lignin, and has been used for imaging and diagnosis [20,21][11][12]. However, autofluorescence results in poor imaging backgrounds and interferes with the detection of single-molecule signals. Considering the poor imaging environment in plants, in order to obtain a high signal-to-noise ratio in living cells, two basic principles need to be considered: first, the fluorophore should emit more photons than the competing spots nearby, and second, to reduce the competition, the excited object of interest or volume should be as small as possible.
2.1. Fluorophores Used for Single-Molecule Research
Fluorescent molecules used in imaging can be divided into three categories: fluorescent proteins, small-molecule fluorescent dyes, and luminescent nanoparticles.
2.1.1. Fluorescent Proteins
Because fluorescent proteins are genetically encoded proteins, the one-to-one labeling of a target protein and a fluorophore can be achieved through gene fusion [22][13]. This process is very well suited for in vivo applications. Wild-type green fluorescent protein (GFP) was isolated from the jellyfish Aequorea victoria in 1962. Since then, in order to optimize its physical optical properties, many different mutants have been engineered [23,24][14][15]. Among them, two mutants with improved fluorescence brightness are S65T and EGFP (F64L/S65T) [25][16]. EGFP has been widely used in confocal fluorescence imaging experiments. Due to electrostatic adsorption, GFP tends to form a homodimer, which may limit its application for understanding the oligomerization of target proteins [26][17]. Fortunately, the mutations of interface hydrophobic residues (A206, L221, or F223) with positively charged residues are able to observably reduce the dimerization [26][17], and the mutant A206K has been successfully used in plant cells [22][13]. Red fluorescent protein was first extracted from marine organisms. Typical examples include DsRed from Discosoma [27][18] and HcRed from Heteractis crispa [28][19]. Most of the wild-type red fluorescent proteins obtained in the early stage are tetrameric and are often toxic or disruptive [27,29][18][20]. mRFP1 was the first true monomer, obtained from DsRed. However, its application in vivo may affect the function of the target protein [30][21]. After continuous improvement, the commonly used red fluorescent mutants are mCherry and TagRFP, and new mutants with better spectral properties are being developed all the time [30,31,32][21][22][23].
There are many other colors of fluorescent proteins and their variants, and fluorescent protein modification is still a frontier research field. However, at present, only GFP and mCherry are widely used as co-localization partners in plant single-molecule experiments [33][24]. Fluorescence intensity is affected by environmental conditions [34[25][26],35], and the fluorescent proteins used in animals may not be suitable for plants. Therefore, their use needs to be verified in plants. While fluorescent proteins are the most widely used fluorescent molecules in living cells, they have disadvantages, including their large size (≈27 kDa), which may affect the behaviors of the targets. In addition, the light stability and brightness of fluorescent proteins are much lower than those of chemical small dyes and luminescent nanoparticles.
In addition to enhancing the emission intensity of a single fluorescent protein, increasing the number of fluorescent proteins on a single molecule can also improve the signal-to-noise ratio. This method was used for the design of tdTomato [31][22]. However, more repetitive tandem fluorescent proteins will encounter problems in vector construction and protein expression. In recent years, Marvin E. Tanenbaum and colleagues successively developed the SunTag [36][27] system and MoonTag system [37][28] for signal amplification. In these systems, one type of nanobody fused with a fluorescent protein is used to bind special tandem short peptides (typically 24 copies) fused with a target protein; thus, one protein will be labeled by many fluorescent proteins from antibody–antigen recognition. Using this system together with RNA-protein recognition systems such as the MS2 system [38][29] and PP7 system [39][30], researchers studied the transcription and translation processes at the single-molecule level [40,41,42][31][32][33]. Although these amplification systems have been used effectively in plants [43][34], they may not be suitable for single-molecule tracking, because three tandem fluorescent proteins will affect the movement of protein [44][35]. On the basis of the principle of fluorescent proteins, many fluorescent RNAs have been developed recently to mimic fluorescent proteins [45][36], such as spinach [46][37], broccoli [47][38], corn [48][39], and pepper [49][40]. These fluorescent RNAs provide an opportunity to light up RNAs directly in cells. In addition, some of them have been used in plant systems [50][41].
2.1.2. Small-Molecule Fluorescent Dyes
This type of fluorescent molecule has been used for decades and is commercially available. The benefits of this type of molecule include its small size, wide spectral range, and high photostability. Small-molecule fluorescent dyes have been widely used in single-molecule experiments in vitro [4[42][43][44],8,51], and their use has realized the labeling of plant and animal organelles [52,53][45][46]. However, in terms of amino acid-based protein labeling, the specificity is usually not guaranteed in cells due to competition from other proteins. In recent years, in order to solve the problem of specific labeling, self-labeling protein tags have been developed [54][47], including SNAP-tag (NEB) [55][48], CLIP-tag (NEB) [56][49], and Halo-tag (Promega) [57][50]. In these systems, the tagged proteins of interest are genetically fused to self-labelling enzyme tags, which are further enzymatically labeled by specific ligands conjugated to different organic dyes. Taking advantage of this system, researchers have widely used chemical fluorescent small molecules in animals and bacteria at the single-molecule level [2][51]. Although this method combines the advantages of both fluorescent dyes and gene fusion techniques and has been successfully used in plants [58][52], single-molecule imaging has still not been achieved. Because of the presence of cell walls, fluorescent molecules cannot easily enter cells, and it is not easy to adequately rinse out free fluorescent molecules as it is in animal cells.
2.1.3. Luminescent Nanoparticles
Quantum dots (QDs), the first generation of luminescent nanoparticles, are representative. These fluorophores are characterized by high brightness and resistance to photobleaching, being able to form a variety of different absorption and emission bands by changing their physical morphology [59][53]. They are commercially available and have been widely used in single-molecule imaging in animal cells [60,61][54][55]. QDs have been successfully used to label calmodulin in plant cells [62][56]. However, the limitations of QDs are also noteworthy. First, compared with traditional organic dyes, QDs tend to blink irregularly [63][57]. This drawback limits their applications for single-molecule tracking [64][58]. Although essentially nonblinking QDs have also been developed [65][59], more research in this area needs to be conducted. Second, QDs are much larger than small-molecule dyes and fluorescent proteins, and therefore they may affect the diffusion rate and pattern of the target [66][60]. Third, there is currently no effective way for QDs to pass smoothly through plant cell walls. Finally, in terms of specific labeling, QDs have the same problems as the above small-molecule fluorescent dyes.
Other common luminescent nanoparticles include up-conversion nanocrystals (UCNPs), polymer dots (PDots), fluorescent nanodiamonds (FNDs), and carbon-based nanodots (CDots). Their properties and usage in animals at the single-molecule level have been well reviewed [67][61]. There have been some attempts to apply these nanoparticles in plants [68][62], but they are still at an early stage, and these nanoparticles have not been used for single-molecule imaging. The absorption, accumulation, and imaging of UCNPs [69[63][64],70], PDots [71][65], FNDs [72][66], and CDots [73][67] in plants have been studied. Similar to QDs, their specific labeling is also a major problem. However, because of their excellent brightness, efforts are still being made to implement the wide application of QDs in the single-molecule detection of plant cells.
2.2. Instrumentations for Single-Molecule Research
The realization of single-molecule fluorescence detection needs to be based on different research purposes, and excitation modes and detection methods should be designed. Currently, single-molecule imaging methods are mainly based on the following three methods in living plants (Figure 1).
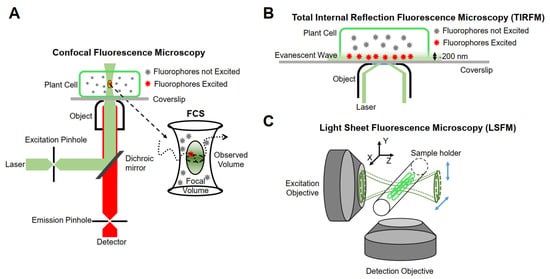
Figure 1.
Schematic representation of instrumentations for single-molecule research. (
A
) Confocal fluorescence microscopy. (
B
) Total internal reflection fluorescence microscopy (TIRFM). (
C
) Light sheet fluorescence microscopy (LSFM).
2.2.1. Confocal Fluorescence Microscopy
Minsky proposed the concept of confocal microscopy in 1961 [74][68]. It uses a diffraction-limited point of light to illuminate the sample, and then all of the fluorescence information emitted is collected by a point detector, which consists of a detector and a front pinhole, removing the majority of light outside of the focal plane. In addition, the data of the whole sample are obtained by means of transverse and axial scanning. Although the emissions from out-of-focus molecules can be filtered, the useless out-of-focus excitation will lead to premature bleaching and phototoxicity. Furthermore, because of the point-scanning acquisition, the imaging speed is relatively slow for fast molecular detection [75][69]. Therefore, this type of microscope is not suitable for single-molecule detection in living plant cells. Confocal microscopes combined with multiple detectors and relevant analysis systems have partly overcome their limitations. For example, fluorescence correlation spectroscopy (FCS) and fluorescence cross-correlation spectroscopy (FCCS) detect small, defined illumination volume diffusion fluorescence intensity fluctuations of fluorescent molecules and analyze the time-dependence fluctuations using auto-correlation analysis to obtain the fluorescent molecular mobility, diffusion, concentration, and aggregation [76,77][70][71].
The first literature on the use of FCS in plants was published in 1999, when the diffusion of a cytosolic GFP mutant S65T was investigated in tobacco, and two-photon excitation was proven to be a better choice to improve signal quality for turbid plant cells [78][72]. Using FCS/FCCS, the endocytic pathways of RbohD under salt stress were studied [79][73], and the accumulation of PLDδ-GFP on the membrane under pathogen stimulation was confirmed [80][74]. FCS/FCCS has gradually become a standard method for plant single-molecule imaging, but it is not a true single-molecule technology because it does not track individual molecules. In addition, it yields an average result, although the imaging volume is small. FCS/FCCS is also not suitable for slow-moving and immobile objects, being inaccurate at high concentrations of fluorescent molecules.
2.2.2. Total Internal Reflection Fluorescence Microscopy (TIRFM)
Conventional fluorescence microscopes use vertical excitation of the sample. As a result, the excitation volume in the z-axis direction is very large, leading to a low signal-to-noise ratio in the resulting image. Total internal reflection fluorescence (TIRF) microscopy is currently the most commonly used imaging method in plants, taking advantage of its incomparable signal-to-noise ratio [75][69]. It uses the evanescent wave generated when the incident light experiences total internal reflection, or a highly inclined and laminated optical sheet (HILO) to light up only a partial volume (for TIRF less than 200 nm) [81][75] in order to obtain the dynamic behavior of a single fluorescent molecule in time and space [82][76].
TIRFM was first achieved in plant single-molecule imaging in 2011, when Lin’s group first detected and studied single-molecule PIP2;1 and found that it was distributed heterogeneously [16][6]. Since then, TIRFM has been widely used to study biological processes occurring on or near cell membranes, such as cell signaling and cytoskeleton assembly [83,84][77][78]. However, because of the principle of TIRFM, most studies in living plant cells have been limited to membrane or near-membrane studies.
2.2.3. Light Sheet Fluorescence Microscopy (LSFM)
Although TIRFM technology realizes an ultra-thin excitation surface, its use is limited to two-dimensional imaging. The emergence of LSFM allows for the illumination plane to be oriented in any desired position, thus enabling researchers to achieve high-resolution imaging in three dimensions. The fundamental principle of LSFM is to use two vertical objective lenses: one is the lighting system, and the other is the detection system. The lighting system forms an extremely thin sheet of excitation light, which illuminates only the focal plane of the sample, and then scans the sample layer by layer to obtain three-dimensional images. At present, LSFM has been used for plant imaging at the tissue level [85][79] and is able to be extended to the single-molecule level [86][80]. The illumination strategies of LSFM can be categorized into three types: Gaussian light sheet illumination, Bessel beam selective-plane illumination, and lattice light sheet illumination [87][81]. Compared with Gaussian light sheet illumination, Bessel beam selective-plane illumination and lattice light sheet illumination have thinner and nondiffracting beams, and thus have better backgrounds resulting from out-of-focus molecules and a better signal-to-noise ratio. Gaussian light sheet illumination has been successfully used to detect single PMA4-mGFP in the root hairs of Arabidopsis at the single-molecule level [88][82], and the applications of Bessel beam selective-plane illumination and lattice light sheet illumination in plants are worth investigating.
2.2.4. Super-Resolution and Other Cutting-Edge Single-Molecule Imaging Methods
Thus far, besides limitation to a surface, single-molecule research is also restricted to high spatiotemporal resolution and long-time tracking. For long-time tracking, recently, 3D-SMART (3D single-molecule active real-time tracking method) was presented [89][83]. When this active feedback tracking strategy is used, single-molecule biomacromolecules can be directly monitored with a duration of about 16 s (step response ≈ 0.1 ms), and tracking rates can be up to 10 µm2/s. For more precise positioning or achieving single-molecule detection in high concentrations, the importance of super-resolution methods, including structured illumination microscopy (SIM), photoactivated localization microscopy (PALM), stochastic optical reconstruction microscopy (STORM), and stimulated emission depletion microscopy (STED), is highlighted, because they can break through the diffraction limit (≈200 nm); thus, the boundary between one single molecule and another is no longer blurred. Since the imaging speed of PALM and STORM is slow, they are not suitable for high-speed single-molecule tracking (>1 μm2/s). Recently, PALM was successfully used to track slow-moving proteins in living roots [90][84]. It can be expected that the combined applications of TIRF-SIM [91][85] and STED-FCS [92][86] will be used in plant research in the near future. Recently, some other revolutionary technologies have emerged. By segmenting the back focal plane to image the same fluorophore from different angles, researchers found that single molecule light field microscopy (SMLFM) achieved 20 nm precision [93][87]. By taking advantage of a tilted light sheet and point spread functions, researchers built TILT3D (tilted light sheet microscopy with 3D point spread functions) [94][88], which can realize a resolution of tens of nanometers. Using a repetitive optical selective exposure technique, Tao Xu’s and Wei Ji’s groups realized ≈3 nm localization precision [95][89]. Stefan W. Hell’s group developed a localizing method called MINFLUX (minimal photon fluxes) to attain ≈1 nm spatiotemporal resolution in living cells by localizing individual switchable fluorophores using a donut-shaped excitation beam [96,97][90][91]. In addition, SR-CLEM (super-resolution correlative light and electron microscopy) is also worth investigating [98][92].
References
- Rotman, B. Measurement of activity of single molecules of beta-D-galactosidase. Proc. Natl. Acad. Sci. USA 1961, 47, 1981–1991.
- Hirschfeld, T. Optical microscopic observation of single small molecules. Appl. Opt. 1976, 15, 2965–2966.
- Orrit, M.; Bernard, J. Single pentacene molecules detected by fluorescence excitation in a p-terphenyl crystal. Phys. Rev. Lett. 1990, 65, 2716–2719.
- Nie, S.; Chiu, D.T.; Zare, R.N. Probing individual molecules with confocal fluorescence microscopy. Science 1994, 266, 1018–1021.
- Sako, Y.; Minoguchi, S.; Yanagida, T. Single-Molecule imaging of EGFR signalling on the surface of living cells. Nat. Cell Biol. 2000, 2, 168–172.
- Li, X.; Wang, X.; Yang, Y.; Li, R.; He, Q.; Fang, X.; Doan-Trung, L.; Maurel, C.; Lin, J. Single-Molecule analysis of PIP2; 1 dynamics and partitioning reveals multiple modes of Arabidopsis plasma membrane aquaporin regulation. Plant Cell 2011, 23, 3780–3797.
- Cui, Y.; Yu, M.; Yao, X.; Xing, J.; Lin, J.; Li, X. Single-Particle tracking for the quantification of membrane protein dynamics in living plant cells. Mol. Plant 2018, 11, 1315–1327.
- Lv, X.; Jing, Y.; Xiao, J.; Zhang, Y.; Zhu, Y.; Julian, R.; Lin, J. Membrane microdomains and the cytoskeleton constrain AtHIR1 dynamics and facilitate the formation of an AtHIR1-associated immune complex. Plant J. 2017, 90, 3–16.
- Cui, Y.; Li, X.; Yu, M.; Li, R.; Fan, L.; Zhu, Y.; Lin, J. Sterols regulate endocytic pathways during flg22-induced defense responses in Arabidopsis. Development 2018, 145, dev165688.
- Zhang, X.; Cui, Y.; Yu, M.; Su, B.; Gong, W.; Baluska, F.; Komis, G.; Samaj, J.; Shan, X.; Lin, J. Phosphorylation-Mediated dynamics of nitrate transceptor NRT1.1 regulate auxin flux and nitrate signaling in lateral root growth. Plant Physiol. 2019, 181, 480–498.
- Donaldson, L. Autofluorescence in plants. Molecules 2020, 25, 2393.
- Garcia-Plazaola, J.I.; Fernandez-Marin, B.; Duke, S.O.; Hernandeza, A.; Lopez-Arbeloa, F.; Maria Becerril, J. Autofluorescence: Biological functions and technical applications. Plant Sci. 2015, 236, 136–145.
- Song, K.; Xue, Y.; Wang, X.; Wan, Y.; Deng, X.; Lin, J. A modified GFP facilitates counting membrane protein subunits by step-wise photobleaching in Arabidopsis. J. Plant Physiol. 2017, 213, 129–133.
- Ai, H.-W.; Henderson, J.N.; Remington, S.J.; Campbell, R.E. Directed evolution of a monomeric, bright and photostable version of Clavularia cyan fluorescent protein: Structural characterization and applications in fluorescence imaging. Biochem. J. 2006, 400, 531–540.
- Berg, R.H.; Beachy, R.N. Fluorescent protein applications in plants. Methods Cell Biol. 2008, 85, 153–177.
- Yang, T.T.; Cheng, L.; Kain, S.R. Optimized codon usage and chromophore mutations provide enhanced sensitivity with the green fluorescent protein. Nucleic Acids Res. 1996, 24, 4592–4593.
- Zacharias, D.A.; Violin, J.D.; Newton, A.C.; Tsien, R.Y. Partitioning of lipid-modified monomeric GFPs into membrane microdomains of live cells. Science 2002, 296, 913–916.
- Matz, M.V.; Fradkov, A.F.; Labas, Y.A.; Savitsky, A.P.; Zaraisky, A.G.; Markelov, M.L.; Lukyanov, S.A. Fluorescent proteins from nonbioluminescent Anthozoa species. Nat. Biotechnol. 1999, 17, 969–973.
- Gurskaya, N.G.; Fradkov, A.F.; Terskikh, A.; Matz, M.V.; Labas, Y.A.; Martynov, V.I.; Yanushevich, Y.G.; Lukyanov, K.A.; Lukyanov, S.A. GFP-like chromoproteins as a source of far-red fluorescent proteins. FEBS Lett. 2001, 507, 16–20.
- Baird, G.S.; Zacharias, D.A.; Tsien, R.Y. Biochemistry, mutagenesis, and oligomerization of DsRed, a red fluorescent protein from coral. Proc. Natl. Acad. Sci. USA 2000, 97, 11984–11989.
- Shaner, N.C.; Campbell, R.E.; Steinbach, P.A.; Giepmans, B.N.G.; Palmer, A.E.; Tsien, R.Y. Improved monomeric red, orange and yellow fluorescent proteins derived from Discosoma sp. red fluorescent protein. Nat. Biotechnol. 2004, 22, 1567–1572.
- Shemiakina, I.I.; Ermakova, G.V.; Cranfill, P.J.; Baird, M.A.; Evans, R.A.; Souslova, E.A.; Staroverov, D.B.; Gorokhovatsky, A.Y.; Putintseva, E.V.; Gorodnicheva, T.V.; et al. A monomeric red fluorescent protein with low cytotoxicity. Nat. Commun. 2012, 3, 1204.
- Bajar, B.T.; Wang, E.S.; Zhang, S.; Lin, M.Z.; Chu, J. A guide to fluorescent protein FRET pairs. Sensors 2016, 16, 1488.
- Xue, Y.; Xing, J.; Wan, Y.; Lv, X.; Fan, L.; Zhang, Y.; Song, K.; Wang, L.; Wang, X.; Deng, X.; et al. Arabidopsis blue light receptor phototropin 1 undergoes blue light-induced activation in membrane microdomains. Mol. Plant 2018, 11, 846–859.
- Borst, J.W.; Willemse, M.; Slijkhuis, R.; van der Krogt, G.; Laptenok, S.P.; Jalink, K.; Wieringa, B.; Fransen, J.A.M. ATP changes the fluorescence lifetime of cyan fluorescent protein via an interaction with his148. PLoS ONE 2010, 5, e13862.
- Grigorenko, B.L.; Nemukhin, A.V.; Polyakov, I.V.; Khrenova, M.G.; Krylov, A.I. A light-induced reaction with oxygen leads to chromophore decomposition and irreversible photobleaching in GFP-type proteins. J. Phys. Chem. B 2015, 119, 5444–5452.
- Tanenbaum, M.E.; Gilbert, L.A.; Qi, L.S.; Weissman, J.S.; Vale, R.D. A protein-tagging system for signal amplification in gene expression and fluorescence imaging. Cell 2014, 159, 635–646.
- Boersma, S.; Khuperkar, D.; Verhagen, B.M.P.; Sonneveld, S.; Grimm, J.B.; Lavis, L.D.; Tanenbaum, M.E. Multi-Color single-molecule imaging uncovers extensive heterogeneity in mRNA decoding. Cell 2019, 178, 458–472.
- Bertrand, E.; Chartrand, P.; Schaefer, M.; Shenoy, S.M.; Singer, R.H.; Long, R.M. Localization of ASH1 mRNA particles in living yeast. Mol. Cell 1998, 2, 437–445.
- Larson, D.R.; Zenklusen, D.; Wu, B.; Chao, J.A.; Singer, R.H. Real-Time observation of transcription initiation and elongation on an endogenous yeast gene. Science 2011, 332, 475–478.
- Wang, C.; Han, B.; Zhou, R.; Zhuang, X. Real-Time imaging of translation on single mRNA transcripts in live cells. Cell 2016, 165, 990–1001.
- Mateju, D.; Eichenberger, B.; Voigt, F.; Eglinger, J.; Roth, G.; Chao, J.A. Single-Molecule imaging reveals translation of mRNAs localized to stress granules. Cell 2020, 183, 1801–1812.
- Cialek, C.A.; Koch, A.L.; Galindo, G.; Stasevich, T.J. Lighting up single-mRNA translation dynamics in living cells. Curr. Opin. Genet. Dev. 2020, 61, 75–82.
- Papikian, A.; Liu, W.; Gallego-Bartolome, J.; Jacobsen, S.E. Site-Specific manipulation of Arabidopsis loci using CRISPR-Cas9 SunTag systems. Nat. Commun. 2019, 10, 729.
- Raissig, M.T.; Matos, J.L.; Gil, M.X.A.; Kornfeld, A.; Bettadapur, A.; Abrash, E.; Allison, H.R.; Badgley, G.; Vogel, J.P.; Berry, J.A.; et al. Mobile MUTE specifies subsidiary cells to build physiologically improved grass stomata. Science 2017, 355, 1215–1218.
- Song, W.; Strack, R.L.; Svensen, N.; Jaffrey, S.R. Plug-and-play fluorophores extend the spectral properties of Spinach. J. Am. Chem. Soc. 2014, 136, 1198–1201.
- Paige, J.S.; Wu, K.Y.; Jaffrey, S.R. RNA mimics of green fluorescent protein. Science 2011, 333, 642–646.
- Filonov, G.S.; Moon, J.D.; Svensen, N.; Jaffrey, S.R. Broccoli: Rapid selection of an RNA mimic of green fluorescent protein by fluorescence-based selection and directed evolution. J. Am. Chem. Soc. 2014, 136, 16299–16308.
- Song, W.; Filonov, G.S.; Kim, H.; Hirsch, M.; Li, X.; Moon, J.D.; Jaffrey, S.R. Imaging RNA polymerase III transcription using a photostable RNA-fluorophore complex. Nat. Chem. Biol. 2017, 13, 1187–1194.
- Chen, X.; Zhang, D.; Su, N.; Bao, B.; Xie, X.; Zuo, F.; Yang, L.; Wang, H.; Jiang, L.; Lin, Q.; et al. Visualizing RNA dynamics in live cells with bright and stable fluorescent RNAs. Nat. Biotechnol. 2019, 37, 1287–1293.
- Bai, J.; Luo, Y.; Wang, X.; Li, S.; Luo, M.; Yin, M.; Zuo, Y.; Li, G.; Yao, J.; Yang, H.; et al. A protein-independent fluorescent RNA aptamer reporter system for plant genetic engineering. Nat. Commun. 2020, 11, 3847.
- Joo, C.; Balci, H.; Ishitsuka, Y.; Buranachai, C.; Ha, T. Advances in single-molecule fluorescence methods for molecular biology. Annu. Rev. Biochem. 2008, 77, 51–76.
- Wu, W.-Q.; Zhang, M.-L.; Song, C.-P. A comprehensive evaluation of a typical plant telomeric G-quadruplex (G4) DNA reveals the dynamics of G4 formation, rearrangement, and unfolding. J. Biol. Chem. 2020, 295, 5461–5469.
- Song, S.; Wang, H.; Sun, M.; Tang, J.; Zheng, B.; Wang, X.; Tan, Y.-W. Reactive oxygen species-mediated BIN2 activity revealed by single-molecule analysis. New Phytol. 2019, 223, 692–704.
- Landrum, M.; Smertenko, A.; Edwards, R.; Hussey, P.J.; Steel, P.G. BODIPY probes to study peroxisome dynamics In vivo. Plant J. 2010, 62, 529–538.
- Chen, T.; Wang, X.; von Wangenheim, D.; Zheng, M.; Samaj, J.; Ji, W.; Lin, J. Probing and tracking organelles in living plant cells. Protoplasma 2012, 249, 157–167.
- Liu, J.; Cui, Z. Fluorescent labeling of proteins of interest in live cells: Beyond fluorescent proteins. Bioconjugate Chem. 2020, 31, 1587–1595.
- Benke, A.; Olivier, N.; Gunzenhaeuser, J.; Manley, S. Multicolor single molecule tracking of stochastically active synthetic dyes. Nano Lett. 2012, 12, 2619–2624.
- Brun, M.A.; Griss, R.; Reymond, L.; Tan, K.-T.; Piguet, J.; Peters, R.J.R.W.; Vogel, H.; Johnsson, K. Semisynthesis of fluorescent metabolite sensors on cell surfaces. J. Am. Chem. Soc. 2011, 133, 16235–16242.
- Schroeder, J.; Benink, H.; Dyba, M.; Los, G.V. In vivo labeling method using a genetic construct for nanoscale resolution microscopy. Biophys. J. 2009, 96, 1–3.
- Li, N.; Zhao, R.; Sun, Y.; Ye, Z.; He, K.; Fang, X. Single-Molecule imaging and tracking of molecular dynamics in living cells. Natl. Sci. Rev. 2017, 4, 739–760.
- Iwatate, R.J.; Yoshinari, A.; Yagi, N.; Grzybowski, M.; Ogasawara, H.; Kamiya, M.; Komatsu, T.; Taki, M.; Yamaguchi, S.; Frommer, W.B.; et al. Covalent self-labeling of tagged proteins with chemical fluorescent dyes in BY-2 cells and Arabidopsis seedlings. Plant Cell 2020, 32, 3081–3094.
- Resch-Genger, U.; Grabolle, M.; Cavaliere-Jaricot, S.; Nitschke, R.; Nann, T. Quantum dots versus organic dyes as fluorescent labels. Nat. Methods 2008, 5, 763–775.
- Chang, J.C.; Rosenthal, S.J. Single quantum dot imaging in living cells. Methods Mol. Biol. 2013, 991, 149–162.
- Jiang, C.; Li, B.; Dou, S.-X.; Wang, P.-Y.; Li, H. Quasi-two-dimensional diffusion in adherent cells revealed by three-dimensional single quantum dot tracking. Chin. Phys. Lett. 2020, 37, 078701.
- Wang, Q.; Chen, B.; Liu, P.; Zheng, M.; Wang, Y.; Cui, S.; Sun, D.; Fang, X.; Liu, C.-M.; Lucas, W.J.; et al. Calmodulin binds to extracellular sites on the plasma membrane of plant cells and elicits a rise in intracellular calcium concentration. J. Biol. Chem. 2009, 284, 12000–12007.
- Barroso, M.M. Quantum dots in cell biology. J. Histochem. Cytochem. 2011, 59, 237–251.
- Wegner, K.D.; Hildebrandt, N. Quantum dots: Bright and versatile in vitro and in vivo fluorescence imaging biosensors. Chem. Soc. Rev. 2015, 44, 4792–4834.
- Marchuk, K.; Guo, Y.; Sun, W.; Vela, J.; Fang, N. High-precision tracking with non-blinking quantum dots resolves nanoscale vertical displacement. J. Am. Chem. Soc. 2012, 134, 6108–6111.
- Nechyporuk-Zloy, V.; Dieterich, P.; Oberleithner, H.; Stock, C.; Schwab, A. Dynamics of single potassium channel proteins in the plasma membrane of migrating cells. Am. J. Physiol. Cell Physiol. 2008, 294, 1096–1102.
- Jin, D.; Xi, P.; Wang, B.; Zhang, L.; Enderlein, J.; van Oijen, A.M. Nanoparticles for super-resolution microscopy and single-molecule tracking. Nat. Methods 2018, 15, 415–423.
- Dong, R.; Li, Y.; Li, W.; Zhang, H.; Liu, Y.; Ma, L.; Wang, X.; Lei, B. Recent developments in luminescent nanoparticles for plant imaging and photosynthesis. J. Rare Earths 2019, 37, 903–915.
- Wu, X.; Hu, P.; Hu, S.; Chen, Z.; Yan, H.; Tang, Z.; Xi, Z.; Yu, Y.; Dai, G.; Liu, Y. Upconversion nanoparticles for differential imaging of plant cells and detection of fluorescent dyes. J. Rare Earths 2016, 34, 208–220.
- Qiao, Y.; Qiao, S.; Yu, Y.X.; Min, Q.; Yi, J. Plant tissue imaging with bipyramidal upconversion nanocrystals by introducing Tm3+ ions as energy trapping centers. Nanoscale 2021.
- Li, J.; Li, Y.; Tang, S.; Zhang, Y.; Zhang, J.; Li, Y.; Xiong, L. Toxicity, uptake and transport mechanisms of dual-modal polymer dots in penny grass (Hydrocotyle vulgaris L.). Environ. Pollut. 2020, 265, 114877.
- Su, L.-X.; Lou, Q.; Jiao, Z.; Shan, C.-X. Plant cell imaging based on nanodiamonds with excitation-dependent fluorescence. Nanoscale Res. Lett. 2016, 11, 425.
- Li, Y.; Xu, X.; Wu, Y.; Zhuang, J.; Zhang, X.; Zhang, H.; Lei, B.; Hu, C.; Liu, Y. A review on the effects of carbon dots in plant systems. Mater. Chem. Front. 2020, 4, 437–448.
- Minsky, M. Memoir on inventing the confocal scanning microscope. Scanning 1988, 10, 128–138.
- Liu, Z.; Lavis, L.D.; Betzig, E. Imaging live-cell dynamics and structure at the single-molecule level. Mol. Cell 2015, 58, 644–659.
- Bacia, K.; Kim, S.A.; Schwille, P. Fluorescence cross-correlation spectroscopy in living cells. Nat. Methods 2006, 3, 83–89.
- Kwaaitaal, M.; Schor, M.; Hink, M.A.; Visser, A.J.W.G.; de Vries, S.C. Fluorescence correlation spectroscopy and fluorescence recovery after photobleaching to study receptor kinase mobility in Planta. Methods Mol. Biol. 2011, 779, 225–242.
- Schwille, P.; Haupts, U.; Maiti, S.; Webb, W.W. Molecular dynamics in living cells observed by fluorescence correlation spectroscopy with one- and two-photon excitation. Biophys. J. 1999, 77, 2251–2265.
- Hao, H.; Fan, L.; Chen, T.; Li, R.; Li, X.; He, Q.; Botella, M.A.; Lin, J. Clathrin and membrane microdomains cooperatively regulate RbohD dynamics and activity in Arabidopsis. Plant Cell 2014, 26, 1729–1745.
- Xing, J.; Li, X.; Wang, X.; Lv, X.; Wang, L.; Zhang, L.; Zhu, Y.; Shen, Q.; Baluska, F.; Samaj, J.; et al. Secretion of phospholipase Dδ functions as a regulatory mechanism in plant innate immunity. Plant Cell 2019, 31, 3015–3032.
- Tokunaga, M.; Imamoto, N.; Sakata-Sogawa, K. Highly inclined thin illumination enables clear single-molecule imaging in cells. Nat. Methods 2008, 5, 159–161.
- Vizcay-Barrena, G.; Webb, S.E.D.; Martin-Fernandez, M.L.; Wilson, Z.A. Subcellular and single-molecule imaging of plant fluorescent proteins using total internal reflection fluorescence microscopy (TIRFM). J. Exp. Bot. 2011, 62, 5419–5428.
- Cao, Y.; He, Q.; Qi, Z.; Zhang, Y.; Lu, L.; Xue, J.; Li, J.; Li, R. Dynamics and endocytosis of Flot1 in Arabidopsis require CPI1 function. Int. J. Mol. Sci. 2020, 21, 1552.
- Li, L.; Su, B.; Qi, X.; Zhang, X.; Song, S.; Shan, X. JA-induced endocytosis of AtRGS1 is involved in G-protein mediated JA responses. Int. J. Mol. Sci. 2019, 20, 3779.
- Ovecka, M.; von Wangenheim, D.; Tomancak, P.; Samajova, O.; Komis, G.; Samaj, J. Multiscale imaging of plant development by light-sheet fluorescence microscopy. Nat. Plants 2018, 4, 639–650.
- Hu, Y.S.; Zimmerley, M.; Li, Y.; Watters, R.; Cang, H. Single-molecule super-resolution light-sheet microscopy. Chemphyschem 2014, 15, 577–586.
- Chen, B.-C.; Legant, W.R.; Wang, K.; Shao, L.; Milkie, D.E.; Davidson, M.W.; Janetopoulos, C.; Wu, X.S.; Hammer, J.A., III; Liu, Z.; et al. Lattice light-sheet microscopy: Imaging molecules to embryos at high spatiotemporal resolution. Science 2014, 346, 1257998.
- Langhans, M.; Meckel, T. Single-molecule detection and tracking in plants. Protoplasma 2014, 251, 277–291.
- Hou, S.; Exell, J.; Welsher, K. Real-time 3D single molecule tracking. Nat. Commun. 2020, 11, 3607.
- Bayle, V.; Fiche, J.-B.; Burny, C.; Platre, M.P.; Nollmann, M.; Martiniere, A.; Jaillais, Y. Single-particle tracking photoactivated localization microscopy of membrane proteins in living plant tissues. Nat. Protoc. 2021, 16, 1600–1628.
- Kner, P.; Chhun, B.B.; Griffis, E.R.; Winoto, L.; Gustafsson, M.G.L. Super-resolution video microscopy of live cells by structured illumination. Nat. Methods 2009, 6, 339–342.
- Honigmann, A.; Mueller, V.; Ta, H.; Schoenle, A.; Sezgin, E.; Hell, S.W.; Eggeling, C. Scanning STED-FCS reveals spatiotemporal heterogeneity of lipid interaction in the plasma membrane of living cells. Nat. Commun. 2014, 5, 5412.
- Sims, R.R.; Rehman, S.A.; Lenz, M.O.; Benaissa, S.I.; Bruggeman, E.; Clark, A.; Sanders, E.W.; Ponjavic, A.; Muresan, L.; Lee, S.F.; et al. Single molecule light field microscopy. Optica 2020, 7, 1065–1072.
- Gustavsson, A.-K.; Petrov, P.N.; Lee, M.Y.; Shechtman, Y.; Moerner, W.E. 3D single-molecule super-resolution microscopy with a tilted light sheet. Nat. Commun. 2018, 9, 123.
- Gu, L.; Li, Y.; Zhang, S.; Xue, Y.; Li, W.; Li, D.; Xu, T.; Ji, W. Molecular resolution imaging by repetitive optical selective exposure. Nat. Methods 2019, 16, 1114–1118.
- Balzarotti, F.; Eilers, Y.; Gwosch, K.C.; Gynna, A.H.; Westphal, V.; Stefani, F.D.; Elf, J.; Hell, S.W. Nanometer resolution imaging and tracking of fluorescent molecules with minimal photon fluxes. Science 2017, 355, 606–612.
- Gwosch, K.C.; Pape, J.K.; Balzarotti, F.; Hoess, P.; Ellenberg, J.; Ries, J.; Hell, S.W. MINFLUX nanoscopy delivers 3D multicolor nanometer resolution in cells. Nat. Methods 2020, 17, 217–224.
- Fu, Z.; Peng, D.; Zhang, M.; Xue, F.; Zhang, R.; He, W.; Xu, T.; Xu, P. mEosEM withstands osmium staining and Epon embedding for super-resolution CLEM. Nat. Methods 2020, 17, 55–58.
More