The identification of mammalian TOR (mTOR; later renamed mechanistic target of rapamycin) soon followed, revealing that TOR/mTOR, a serine/threonine protein kinase, is a conserved protein kinase from yeast to man
- mTOR
- mTORC1
- mTORC2
- thymocytes
- T lymphocytes
1. Introduction
T cells originate from hematopoietic stem cells that home into the thymus and differentiate into two main T cell lineages with distinct immune functions. The γδ-T cells will egress the thymus as functional effector cells and migrate to the epidermis, mucosa and intestine. However, most T cells developing in the thymus belong to the αβ-lineage. They differentiate further into either naïve T-helper, T-cytotoxic or T-regulatory subsets that exit the thymus to settle into peripheral organs such as spleen and lymph nodes. These naïve T cells that express a diverse repertoire of αβ-T cell receptors (αβ-TCR) are poised to become activated upon encounter with their cognate antigen. Signals from the αβ-TCR, coreceptors and cytokines trigger a cascade of intracellular events culminating in changes in gene expression that directs cell fate [1][2]. Recent studies on peripheral T cell activation along with cancer metabolism have unraveled how nutrient availability and metabolism impact cell signaling and vice versa [3][4]. While the role of metabolic reprogramming in the activation of peripheral T cells has been relatively well-delineated, its role in early T cell development in the thymus is just surfacing. Studies on immune cell metabolism have been facilitated by the use of immunosuppressants such as rapamycin, which targets mTOR, a central controller of metabolism.
2. Rapamycin and Antimetabolites as Immunosuppressants
Rapamycin (sirolimus), originally isolated as an antifungal antibiotic from the filamentous bacteria,
[5], has potent immunosuppressive and anti-tumor properties [6]. In rats, pioneering studies reveal that it prevents the development of experimental immunopathies, including experimental allergic encephalomyelitis (EAE) and adjuvant arthritis (AA) and the generation of a humoral antibody [7][8]. The treatment of animals with rapamycin during organ transplantation revealed immunosuppression with less toxicity compared to other immunosuppressants such as cyclosporine A (CsA) and FK506, as well as improved graft survival [9]. Rapamycin also has synergistic action together with other immunosuppressants, resulting in less toxicity. Many clinical trials supported its benefits during organ transplantation; hence, its use as an immunosuppressant to prevent allograft rejection was approved in 1999 [10].
Rapamycin forms a complex with the prolyl isomerase FKBP12, and together, they bind to the FKBP12-rapamycin binding region (FRB) in mTOR [11]. Early studies to elucidate the immunosuppressive properties of rapamycin revealed that it blocks T cell proliferation that is induced by interleukin-2 (IL-2) or IL-4 [12]. It prevents G1 to S transition of the cell cycle in T cells stimulated with IL-2 [13]. The identification of the cellular target of rapamycin (TOR) facilitated the understanding of not just how rapamycin confers immunosuppression but uncovered how cells control cell growth and metabolism [14][15].
Although studies on the role of metabolism in T cell development and activation has undergone a renaissance only in the past years, blocking metabolic pathways through the use of antimetabolites have been in use for decades. Azathioprine, a nucleotide-blocking agent that prevents DNA synthesis, has been used in solid organ transplantation since the 1960s [16]. Methotrexate, an antifolate, inhibits dihydrofolate reductase, thus diminishing the generation of thymidine, leading to impaired DNA synthesis. Although originally used as an anti-cancer drug, methotrexate is effectively used in autoimmune disorders and organ allografts since the 1960s [17][18]. Mizoribine, an inhibitor of inosine monophosphate (IMP) synthetase and guanosine monophosphate synthetase, blocks guanine nucleotide synthesis. It is also used as an immunosuppressant to prevent organ allograft rejection in humans and animal models [19][20]. Mycophenolates are converted to mycophenolic acid in the liver, and this metabolite inhibits the rate-limiting enzyme, inosine monophosphate dehydrogenase, of the de novo synthesis of guanosine nucleotides [21]. T-cell proliferation is highly dependent on the de novo synthesis of nucleotides. The efficacy of these anti-metabolites likely relies on the principle that highly proliferating cells, such as an activated T cell, are sensitive to the limitation of crucial metabolites or nutrients that are required for macromolecule biosynthesis.
3. mTOR Signaling
The target of rapamycin (TOR) was first identified in yeast through genetic experiments. The identification of mammalian TOR (mTOR; later renamed mechanistic target of rapamycin) soon followed, revealing that TOR/mTOR, a serine/threonine protein kinase, is a conserved protein kinase from yeast to man [22]. mTOR forms two distinct protein complexes: mTOR complex 1 and 2 (mTORC1 and mTORC2) (
). mTORC1 consists of mTOR, raptor, and mLST8 [23][24]. Other, less-conserved proteins also bind to mTORC1, including PRAS40 and Deptor. mTORC2 contains mTOR, Rictor, SIN1, and mLST8. In higher organisms, mTORC2 also associates with Protor and Deptor. Although the catalytic activity of these protein complexes is provided by mTOR, their unique composition, as well as the regulation of the post-translational modification of their distinct components, confer functional specificity to mTORCs. In addition, their cellular localization also accounts for target specificity. While both mTORCs localize to the membrane periphery, mTORC1 is recruited to the periphery of lysosomes and Golgi, whereas mTORC2 has been shown to localize to plasma membrane, endosomes and to the mitochondria-associated endoplasmic reticulum membrane (MAM) [25][26].
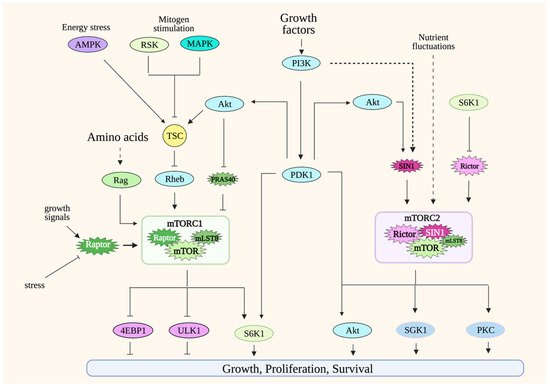
Simplified scheme of mTORC1 and mTORC2 signaling. mTORC1 is active in the presence of nutrients such as amino acids. Its activation is potentiated by growth factors/PI3K signaling. Modulation of mTORC1 occurs at many levels, including via post-translational regulation of its components such as raptor and via the GTPases Rag heterodimers and Rheb. Other environmental signals are conveyed to mTORC1 via the tuberous sclerosis complex (TSC), which acts as a break for mTORC1 signaling during unfavorable growth conditions. mTORC2 is activated by growth factors/PI3K signaling and during nutrient fluctuations. Less is known on mTORC2 regulation, but so far, its components rictor and SIN1 undergo posttranslational modifications that modulate mTORC2 activity. mTORC1 phosphorylates numerous substrates to either promote anabolic metabolism or inhibit catabolic processes. mTORC2 phosphorylates substrates that are involved in proliferation or promoting cell survival during stress conditions. Solid lines indicate direct regulation; dashed lines indicate more indirect regulation. Refer to Abbreviations.
Since mTOR signaling has been extensively reviewed elsewhere [23][24][27], here, we will only give a general overview of mTORC1 and mTORC2 signaling.
3.1. mTORC1
mTORC1 integrates signals from a variety of environmental cues, including nutrients and growth factors/hormones, as well as stress inputs in order to maintain metabolic homeostasis. It orchestrates anabolic metabolism by regulating key effectors of different biosynthetic and metabolic processes while repressing catabolic processes such as autophagy. The most well-appreciated mTORC1 function is its role in modulating protein synthesis in response to amino acid levels. A hallmark of mTORC1 activation is the phosphorylation of translation regulators, S6K1 and 4E-BP1. The mTORC1 component, raptor, presents substrates to mTOR as part of this complex. Changes in the post-translational modifications or expression levels of raptor modulate mTORC1 activity [23]. mTORC1 localizes to different cellular compartments to perform its functions, but the most well-characterized is its localization to the periphery of lysosomes. Lysosomes recycle macromolecules by acting as a storage unit for intracellular nutrients. The localization of mTORC1 in this compartment underscores how this complex is activated by the availability of nutrients such as amino acids. The activation of mTORC1 in lysosomes is mediated by Rags (Ras-related GTP binding proteins) [28][29][30]. In the presence of amino acids, RagA/B binds to GTP while Rag C/D binds to GDP. The Rag heterodimers interact with raptor to modulate the translocation of mTORC1 to the surface of the lysosomes. Amino acid availability is communicated to mTORC1 via distinct amino acid “sensors” that then modulate Rag signaling [31]. There are also some studies that demonstrate how other nutrients/metabolites could more directly modulate mTORC1 [32][33]. Whether there are other sensors that convey nutrient availability to mTORC1 would need further investigation. Under nutrient-abundant conditions, mTORC1 also inhibits autophagy by the negative regulation of key mediators of this process, including Atg13 and ULK1 [34][35][36]. Thus, the activation of mTORC1 by the presence of nutrients positively regulates growth and anabolic processes while it negatively regulates catabolic processes under normal/non-pathological conditions.
The activity of mTORC1 is also modulated during increased PI3K (phosphatidylinositol-3 kinase) signaling. PI3K activation is triggered by receptor tyrosine kinase (RTK) signaling. In the case of T cells, TCR/CD3 and cytokine receptor signaling enhance PI3K activity. Activated PI3K phosphorylates the inositol ring of PIP2 (phosphatidyl-inositol-4,5-bisphosphate), a membrane phospholipid, and converts it to PIP3 (phosphatidylinositol 3,4,5-trisphosphate) at the plasma membrane. Following the generation of PIP3, a subset of signaling proteins like Akt and PDK1 is recruited to the membrane due to the affinity of their pleckstrin homology (PH) domain for PIP3.
Increased PI3K signaling downregulates the activity of the tuberous sclerosis complex TSC (composed of TSC1, TSC2 and TBC1D7), a negative regulator of mTORC1 [37][38][39]. Rheb, another GTPase, is modulated by TSC and binds to mTORC1 to increase its catalytic activity [40]. The increased PI3K signaling enhances the catalytic activity of several AGC (Protein Kinase A, PKG and PKC) kinase family members, including S6K and Akt, by promoting the phosphorylation of their catalytic loop by PDK1, another AGC kinase [41]. The Akt-mediated phosphorylation of TSC2 downregulates TSC activity, thus relieving its suppression of mTORC1. PDK1 also phosphorylates S6K1 to augment its catalytic activity. mTORC1 further enhances S6K1 activity by phosphorylating its hydrophobic motif (HM), an allosteric site that is conserved among AGC kinases. Other protein kinases such as MAPK and RSK, which are activated by mitogenic signals, also enhance mTORC1 activity by modulating the phosphorylation of TSC [42][43]. Unfavorable growth conditions, such as during nutrient limitation or other stress stimuli, dampen mTORC1 activity via TSC. During energy deprivation, AMPK (AMP-activated protein kinase) phosphorylates and enhances TSC2 activity, which leads to mTORC1 downregulation [37]. This is critical, as it helps prevent apoptosis as a result of energy depletion. Another negative regulator of mTORC1 signaling is PRAS40 (proline-rich Akt substrate of 40 kDa). The binding of PRAS40 to raptor inhibits mTORC1, while its phosphorylation by Akt and mTOR dissociates PRAS40 from the complex during favorable growth conditions [44][45][46].
mTORC1 is modulated by post-translational modifications of its components mTOR and raptor. mTOR is phosphorylated at several sites that positively regulate its activity in response to the presence of growth signals [47][48][49][50]. Raptor has multiple phosphorylation sites that are targeted by various protein kinases, leading to either positive or negative regulation of mTORC1 activity.
3.2. mTORC2
Compared to mTORC1, the regulation of mTORC2 is far less well-understood. However, a hallmark of mTORC2 activation is the phosphorylation of Akt at its allosteric sites—namely, Ser473 at the hydrophobic motif (HM) and Thr450 at the turn motif (TM). The phosphorylation of Akt at Ser473 is induced by PI3K signaling, such as during stimulation with growth factors. The Akt HM phosphorylation is also enhanced during nutrient limitation or nutrient restimulation [51][52]. Hence, unlike mTORC1 that is activated by increased nutrient levels, the activation of mTORC2 seems to respond to stress conditions or destabilization of metabolic homeostasis. mTORC2 activity is also linked to non-PI3K-dependent mechanisms. mTORC2 targets such as Akt Thr450 and PKC TM and HM phosphorylation occur constitutively, and whether they are responsive to nutrient levels remains to be further examined [53][54][55][56].
Changes in posttranslational modifications of the mTORC2 components, mTOR, rictor and SIN1 in response to growth signals modulate mTORC2 activity. mTOR autophosphorylation at Ser2481 is normally detected in both mTORC1 and mTORC2, but this phosphorylation is absent in mTORC2-disrupted cells [55][57][58][59]. In response to glucose limitation, mTORC2 is activated, and mTOR is phosphorylated via AMPK [51][52]. Rictor is also phosphorylated at many sites, mostly at the carboxyl-terminal region. While the functions of these phosphosites remain to be characterized, so far, most of the ones that have been studied appear to negatively regulate mTORC2 activity [60][61][62]. SIN1 also undergoes phosphorylation to modulate mTORC2 activity. The phosphorylation at Thr86 of SIN1 occurs via Akt, but whether this phosphorylation positively or negatively impacts mTORC2 activity is controversial [63][64]. Other phosphosites on SIN1 have been recently identified, but their functions remain to be further investigated [65].
mTORC1 signaling also negatively feeds back onto growth factor/PI3K signaling and, subsequently, dampens mTORC2 activity. During enhanced mTORC1 signaling, increased S6K1 activity promotes phosphorylation of the insulin receptor substrate (IRS-1), leading to the downregulation of PI3K/IRS-1 signaling [66]. However, this can be reversed with the use of rapamycin, which decreases S6K1 activity, leading to enhanced PI3K signaling. Furthermore, the presence of rapamycin upregulates the expression of growth factor receptors, which also causes an increase in PI3K signaling and, thus, mTORC2 activity [67]. This feedback signaling indicates that, as the nutrient levels and mTORC1 activity decline, increased mTORC2 signaling could upregulate mechanisms that provide intracellular nutrients and, thus, maintain cell survival.
4. Overview of mTOR Functions in Cell Metabolism
Both of the mTOR complexes are involved in the control of cellular metabolic processes (
) (reviewed in [23][24][27]). mTORC1, which is activated in the presence of sufficient nutrients, promotes anabolic metabolism. Emerging studies also link mTORC2 to the control of the metabolic processes. Interestingly, mTORC2 responds to nutrient fluctuations and could thus have functions in both anabolic and catabolic metabolism. The overlapping and distinct functions of the mTORCs in metabolism remain to be delineated.
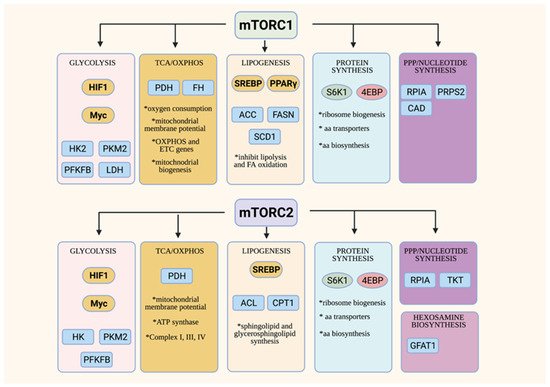
Overview of metabolic functions of mTORC1 and mTORC2. Both the mTORC1 and mTORC2 control metabolic processes via modulating transcription factors that are involved in metabolic pathways (in yellow ovals) and/or the control of other metabolic enzymes or transporters (in blue squares).
mTORC1 mainly controls various aspects of anabolic metabolism [23]. mTORC1 promotes glucose metabolism via modulation of the key transcription factors, HIF1α and Myc, that control the expression of the genes involved in glycolysis and the TCA cycle [68]. Highly proliferating cells such as activated T cells and cancer cells have enhanced glucose consumption and metabolism, corresponding to augmented mTORC1 activity [69]. Those cells upregulate, in an mTORC1-dependent manner, critical metabolic enzymes of glycolysis such as hexokinase, which phosphorylates glucose in the initial step of glycolysis and pyruvate kinase M2 (PKM2), an isoform that is expressed during increased aerobic glycolysis. Increased mTORC1 activity also enhances the phosphofructokinase-2/fructose-2,6-bisphosphatase B3 isotype (PFKFB3) via HIF1α [70]. mTORC1 also modulates lactate dehydrogenase, a tetrameric enzyme that converts pyruvate to lactate during aerobic glycolysis of highly proliferating cells (Warburg effect) [71]. Various aspects of the TCA cycle, oxidative phosphorylation (OxPhos) and mitochondrial biogenesis are also controlled by mTORC1 [72][73][74]. mTORC1 modulates the expression of genes involved in mitochondrial functions. The inhibition of mTORC1 using rapamycin reduces mitochondrial membrane potential, oxygen consumption and ATP synthetic capacity [75].
The upregulation of glycolysis and the TCA cycle in highly proliferating cells does not only produce more ATP, but also provides intermediates that are utilized for the synthesis of cellular building blocks, such as amino acids, lipids, and nucleotides. mTORC1 is involved in the regulation of key metabolic enzymes and transcription factors that are required for these biosynthetic pathways. For example, mTORC1 promotes lipogenesis by modulating the key lipogenic transcriptional regulator, SREBP (sterol regulatory element binding protein), which, in turn, controls the expression of lipogenic enzymes such as ACC, FASN and SCD1 [76]. mTORC1 also negatively regulates lipid catabolism. When mTORC1 is inhibited or disrupted in the adipose tissue, lipolysis is enhanced by the adipose triglyceride lipase (ATGL), while fatty acid oxidation (FAO) is increased in part due to the increased activity of carnitine palmitoyltransferase (CPT1), which regulates the FAO pathway. mTORC1 has multifaceted roles in the control of protein synthesis [77]. It addition to phosphorylating the translation regulators, S6K and 4E-BP1, it also controls the biogenesis of ribosomes, the molecular engines of mRNA translation. mTORC1 positively regulates rRNA transcription, as well as the generation of ribosomal proteins and their assembly factors [78][79]. Highly proliferating cells have also increased need for nucleotides, which are utilized for DNA and RNA synthesis, as well as for ribosome biogenesis. mTORC1 regulates the de novo synthesis of pyrimidines via the activation of the rate-limiting enzyme CAD (carbamoyl-phosphate synthetase 2, aspartate transcarbamylase and dihydro-orotase) [80][81]. mTORC1 also augments flux through de novo purine synthesis via modulating the transcription of enzymes involved in this biosynthetic pathway [82]. Hence, mTORC1 orchestrates anabolism by regulating various metabolic pathways at different levels. While we have a better understanding of how mTORC1 is activated by amino acids to promote protein synthesis, there is little known on how it responds to other nutrients in order to conduct its functions in anabolic metabolism.
Although studies to unravel the functions of mTORC2 in metabolism have lagged behind, there is accumulating evidence supporting the role of this complex in modulating key transcription factors and anabolic enzymes. The mTORC2 substrate, Akt, positively regulates glucose metabolism via multiple mechanisms. Furthermore, knockdown and knockout models have also revealed that mTORC2 controls lipogenesis both in an Akt-dependent and -independent manner [83]. mTORC2 also functions in protein synthesis via the modulation of ribosome biogenesis and amino acid transport [84][85]. It is also involved in the processing of nascent peptides [53][54]. By modulating hexosamine biosynthesis, which produces critical metabolites for glycosylation, mTORC2 also regulates protein folding [51]. mTORC2, via Akt, is also linked to the regulation of the pentose phosphate pathway, as well as to purine synthesis [86][87][88]. Unlike mTORC1, which is activated in the presence of nutrients to promote anabolic metabolism, mTORC2 seems to respond to nutrient fluctuations instead, suggesting that it functions in establishing metabolic homeostasis.
The activation of naïve αβ-T cells upon an encounter with antigen-presenting cells in the periphery provides the best example of how metabolic reprogramming shapes cellular responses [89]. Prior to activation, naïve αβ-T cells have low rates of nutrient uptake and rely on oxidative metabolism to maintain survival. Upon activation, they increase nutrient uptake, enhance the glycolytic flux through biosynthetic pathways in order to generate the energy and intermediates necessary to synthesize macromolecules for growth and proliferation. A number of these processes have been shown to be dependent on mTOR signaling [90][91]. The mTORC1-dependent metabolic reprogramming that takes place upon T-cell activation is also partly mediated by Myc [92]. After differentiation to effector cells and the subsequent expansion that allows T cells to mount a robust immune response, the surviving T memory cells switch back to a naïve T cell-like oxidative metabolism wherein mTORC1 signaling becomes downregulated [93]. The peripheral Tregs, which have immunosuppressive functions, also have different metabolic needs than effector cells [94]. Tregs are dependent on cholesterol and lipid metabolism; in particular, they upregulate the mevalonate pathway in an mTORC1-dependent manner to sustain Treg proliferation and suppressive function. The role of the mTOR complexes in peripheral T cell activation and metabolic reprogramming has been extensively covered by previous reviews [3][69][91].
References
- Hosokawa, H.; Rothenberg, E.V. Cytokines, Transcription Factors, and the Initiation of T-Cell Development. Cold Spring Harb. Perspect. Biol. 2018, 10, a028621.
- McLeod, I.X.; Zhou, X.; Li, Q.J.; Wang, F.; He, Y.W. The class III kinase Vps34 promotes T lymphocyte survival through regulating IL-7Ralpha surface expression. J. Immunol. 2011, 187, 5051–5061.
- Geltink, R.I.K.; Kyle, R.L.; Pearce, E.L. Unraveling the Complex Interplay Between T Cell Metabolism and Function. Annu. Rev. Immunol. 2018, 36, 461–488.
- Wei, J.; Zheng, W.; Chapman, N.M.; Geiger, T.L.; Chi, H. T cell metabolism in homeostasis and cancer immunity. Curr. Opin. Biotechnol. 2021, 68, 240–250.
- Vézina, C.; Kudelski, A.; Sehgal, S.N. Rapamycin (AY-22,989), a new antifungal antibiotic. I. Taxonomy of the producing streptomycete and isolation of the active principle. J. Antibiot. 1975, 28, 721–726.
- Eng, C.P.; Sehgal, S.N.; Vezina, C. Activity of rapamycin (AY-22,989) against transplanted tumors. J. Antibiot. 1984, 37, 1231–1237.
- Martel, R.R.; Klicius, J.; Galet, S. Inhibition of the immune response by rapamycin, a new antifungal antibiotic. Can. J. Physiol. Pharmacol. 1977, 55, 48–51.
- Morris, R.E.; Meiser, B.M. Identification of a new pharmacologic action for an old compound. Med. Sci. Res. 1989, 17, 609.
- Calne, R.; Lim, S.; Samaan, A.; Collier, D.; Pollard, S.; White, D.; Thiru, S. Rapamycin for immunosuppression in organ allografting. Lancet 1989, 334, 227.
- Yoo, Y.J.; Kim, H.; Park, S.R.; Yoon, Y.J. An overview of rapamycin: From discovery to future perspectives. J. Ind. Microbiol. Biotechnol. 2017, 44, 537–553.
- Benjamin, D.; Colombi, M.; Moroni, C.; Hall, M.N. Rapamycin passes the torch: A new generation of mTOR inhibitors. Nat. Rev. Drug Discov. 2011, 10, 868–880.
- Dumont, F.J.; Staruch, M.J.; Koprak, S.L.; Melino, M.R.; Sigal, N.H. Distinct mechanisms of suppression of murine T cell activation by the related macrolides FK-506 and rapamycin. J. Immunol. 1990, 144, 251–258.
- Wiederrecht, G.J.; Sabers, C.J.; Brunn, G.J.; Martin, M.M.; Dumont, F.J.; Abraham, R.T. Mechanism of action of rapamycin: New insights into the regulation of G1-phase progression in eukaryotic cells. Prog. Cell Cycle Res. 1995, 1, 53–71.
- Liu, G.Y.; Sabatini, D.M. mTOR at the nexus of nutrition, growth, ageing and disease. Nat. Rev. Mol. Cell Biol. 2020, 21, 183–203.
- Wullschleger, S.; Loewith, R.; Hall, M.N. TOR Signaling in Growth and Metabolism. Cell 2006, 124, 471–484.
- Wilson, R.E.; Wasson, D. Quantitative suppression of complement-fixing antibodies by azathioprine in dogs with renal homografts. Surgery 1965, 58, 156–162.
- Berenbaum, M. Prolongation of homograft survival by methotrexate with protection against toxicity by folinic acid. Lancet 1964, 284, 1363–1365.
- Black, R.L.; O’Brien, W.M.; Vanscott, E.J.; Auerbach, R.; Eisen, A.Z.; Bunim, J.J. Methotrexate therapy in psoriatic arthritis; double-blind study on 21 patients. JAMA 1964, 189, 743–747.
- Gregory, C.R.; Gourley, I.M.; Cain, G.R. Effects of mizoribine and combination mizoribine/cyclosporine immunosuppression on canine renal allograft recipients. Transpl. Proc. 1988, 20, 223–225.
- Osakabe, T.; Uchida, H.; Masaki, Y.; Yokota, K.; Sato, K.; Nakayama, Y.; Ohkubo, M.; Kumano, K.; Endo, T.; Watanabe, K. Studies on immunosuppression with low-dose cyclosporine combined with mizoribine in experimental and clinical cadaveric renal allotransplantation. Transplant. Proc. 1989, 21, 1598–1600.
- Benvenuto, L.J.; Anderson, M.R.; Arcasoy, S.M. New frontiers in immunosuppression. J. Thorac. Dis. 2018, 10, 3141–3155.
- Lorberg, A.; Hall, M.N. TOR: The First 10 Years. Curr. Top. Microbiol. Immunol. 2004, 279, 1–18.
- Szwed, A.; Kim, E.; Jacinto, E. Regulation and metabolic functions of mTORC1 and mTORC2. Physiol. Rev. 2021.
- Saxton, R.A.; Sabatini, D.M. mTOR Signaling in Growth, Metabolism, and Disease. Cell 2017, 169, 361–371.
- Betz, C.; Stracka, D.; Prescianotto-Baschong, C.; Frieden, M.; Demaurex, N.; Hall, M.N. Feature Article: mTOR complex 2-Akt signaling at mitochondria-associated endoplasmic reticulum membranes (MAM) regulates mitochondrial physiology. Proc. Natl. Acad. Sci. USA 2013, 110, 12526–12534.
- Ebner, M.; Sinkovics, B.; Szczygieł, M.; Ribeiro, D.W.; Yudushkin, I. Localization of mTORC2 activity inside cells. J. Cell Biol. 2017, 216, 343–353.
- Mossmann, D.; Park, S.; Hall, M.N. mTOR signalling and cellular metabolism are mutual determinants in cancer. Nat. Rev. Cancer 2018, 18, 744–757.
- Sancak, Y.; Peterson, T.R.; Shaul, Y.D.; Lindquist, R.A.; Thoreen, C.C.; Bar-Peled, L.; Sabatini, D.M. The Rag GTPases Bind Raptor and Mediate Amino Acid Signaling to mTORC1. Science 2008, 320, 1496–1501.
- Sancak, Y.; Bar-Peled, L.; Zoncu, R.; Markhard, A.L.; Nada, S.; Sabatini, D.M. Ragulator-Rag Complex Targets mTORC1 to the Lysosomal Surface and Is Necessary for Its Activation by Amino Acids. Cell 2010, 141, 290–303.
- Kim, E.; Goraksha-Hicks, P.; Li, L.; Neufeld, T.P.; Guan, K.-L. Regulation of TORC1 by Rag GTPases in nutrient response. Nat. Cell Biol. 2008, 10, 935–945.
- Wolfson, R.L.; Sabatini, D.M. The Dawn of the Age of Amino Acid Sensors for the mTORC1 Pathway. Cell Metab. 2017, 26, 301–309.
- Toschi, A.; Lee, E.; Xu, L.; Garcia, A.; Gadir, N.; Foster, D.A. Regulation of mTORC1 and mTORC2 Complex Assembly by Phosphatidic Acid: Competition with Rapamycin. Mol. Cell. Biol. 2008, 29, 1411–1420.
- Frias, M.A.; Mukhopadhyay, S.; Lehman, E.; Walasek, A.; Utter, M.; Menon, D.; Foster, D.A. Phosphatidic acid drives mTORC1 lysosomal translocation in the absence of amino acids. J. Biol. Chem. 2020, 295, 263–274.
- Kim, J.; Kundu, M.; Viollet, B.; Guan, K.-L. AMPK and mTOR regulate autophagy through direct phosphorylation of Ulk1. Nat. Cell Biol. 2011, 13, 132–141.
- Ganley, I.G.; Lam, D.H.; Wang, J.; Ding, X.; Chen, S.; Jiang, X. ULK1·ATG13·FIP200 Complex Mediates mTOR Signaling and Is Essential for Autophagy. J. Biol. Chem. 2009, 284, 12297–12305.
- Jung, C.H.; Jun, C.B.; Ro, S.-H.; Kim, Y.-M.; Otto, N.M.; Cao, J.; Kundu, M.; Kim, D.-H. ULK-Atg13-FIP200 Complexes Mediate mTOR Signaling to the Autophagy Machinery. Mol. Biol. Cell 2009, 20, 1992–2003.
- Inoki, K.; Zhu, T.; Guan, K.-L. TSC2 Mediates Cellular Energy Response to Control Cell Growth and Survival. Cell 2003, 115, 577–590.
- Manning, B.D.; Tee, A.R.; Logsdon, M.; Blenis, J.; Cantley, L.C. Identification of the Tuberous Sclerosis Complex-2 Tumor Suppressor Gene Product Tuberin as a Target of the Phosphoinositide 3-Kinase/Akt Pathway. Mol. Cell 2002, 10, 151–162.
- Dibble, C.C.; Elis, W.; Menon, S.; Qin, W.; Klekota, J.; Asara, J.M.; Finan, P.M.; Kwiatkowski, D.J.; Murphy, L.O.; Manning, B.D. TBC1D7 Is a Third Subunit of the TSC1-TSC2 Complex Upstream of mTORC1. Mol. Cell 2012, 47, 535–546.
- Yang, H.; Jiang, X.; Li, B.; Yang, H.J.; Miller, M.; Yang, A.; Dhar, A.; Pavletich, N.P. Mechanisms of mTORC1 activation by RHEB and inhibition by PRAS40. Nat. Cell Biol. 2017, 552, 368–373.
- Jacinto, E.; Lorberg, A. TOR regulation of AGC kinases in yeast and mammals. Biochem. J. 2008, 410, 19–37.
- Ma, L.; Chen, Z.; Erdjument-Bromage, H.; Tempst, P.; Pandolfi, P.P. Phosphorylation and functional inactivation of TSC2 by Erk implications for tuberous sclerosis and cancer pathogenesis. Cell 2005, 121, 179–193.
- Roux, P.P.; Ballif, B.A.; Anjum, R.; Gygi, S.P.; Blenis, J. Tumor-promoting phorbol esters and activated Ras inactivate the tuberous sclerosis tumor suppressor complex via p90 ribosomal S6 kinase. Proc. Natl. Acad. Sci. USA 2004, 101, 13489–13494.
- Vander Haar, E.; Lee, S.I.; Bandhakavi, S.; Griffin, T.J.; Kim, D.H. Insulin signalling to mTOR mediated by the Akt/PKB substrate PRAS40. Nat. Cell Biol. 2007, 9, 316–323.
- Oshiro, N.; Takahashi, R.; Yoshino, K.-I.; Tanimura, K.; Nakashima, A.; Eguchi, S.; Miyamoto, T.; Hara, K.; Takehana, K.; Avruch, J.; et al. The Proline-rich Akt Substrate of 40 kDa (PRAS40) Is a Physiological Substrate of Mammalian Target of Rapamycin Complex 1. J. Biol. Chem. 2007, 282, 20329–20339.
- Wang, L.; Harris, T.E.; Roth, R.A.; Lawrence, J.C. PRAS40 Regulates mTORC1 Kinase Activity by Functioning as a Direct Inhibitor of Substrate Binding. J. Biol. Chem. 2007, 282, 20036–20044.
- Holz, M.K.; Blenis, J. Identification of S6 kinase 1 as a novel mammalian target of rapamycin (mTOR)-phosphorylating kinase. J. Biol. Chem. 2005, 280, 26089–26093.
- Reynolds, T.H., IV; Bodine, S.C.; Lawrence, J.C., Jr. Control of Ser2448 phosphorylation in the mammalian target of rapamycin by insulin and skeletal muscle load. J. Biol. Chem. 2002, 277, 17657–17662.
- Ekim, B.; Magnuson, B.; Acosta-Jaquez, H.A.; Keller, J.A.; Feener, E.P.; Fingar, D.C. mTOR Kinase Domain Phosphorylation Promotes mTORC1 Signaling, Cell Growth, and Cell Cycle Progression. Mol. Cell. Biol. 2011, 31, 2787–2801.
- Acosta-Jaquez, H.A.; Keller, J.A.; Foster, K.G.; Ekim, B.; Soliman, G.A.; Feener, E.P.; Ballif, B.A.; Fingar, D.C. Site-Specific mTOR Phosphorylation Promotes mTORC1-Mediated Signaling and Cell Growth. Mol. Cell. Biol. 2009, 29, 4308–4324.
- Moloughney, J.G.; Kim, P.K.; Vega-Cotto, N.M.; Wu, C.-C.; Zhang, S.; Adlam, M.; Lynch, T.; Chou, P.-C.; Rabinowitz, J.D.; Werlen, G.; et al. mTORC2 Responds to Glutamine Catabolite Levels to Modulate the Hexosamine Biosynthesis Enzyme GFAT1. Mol. Cell 2016, 63, 811–826.
- Kazyken, D.; Magnuson, B.; Bodur, C.; Acosta-Jaquez, H.A.; Zhang, D.; Tong, X.; Barnes, T.M.; Steinl, G.K.; Patterson, N.E.; Altheim, C.H.; et al. AMPK directly activates mTORC2 to promote cell survival during acute energetic stress. Sci. Signal. 2019, 12, eaav3249.
- Facchinetti, V.; Ouyang, W.; Wei, H.; Soto, N.; Lazorchak, A.; Gould, C.; Lowry, C.; Newton, A.C.; Mao, Y.; Miao, R.Q.; et al. The mammalian target of rapamycin complex 2 controls folding and stability of Akt and protein kinase C. EMBO J. 2008, 27, 1932–1943.
- Ikenoue, T.; Inoki, K.; Yang, Q.; Zhou, X.; Guan, K.L. Essential function of TORC2 in PKC and Akt turn motif phosphorylation, maturation and signalling. EMBO J. 2008, 27, 1919–1931.
- Oh, W.J.; Wu, C.-C.; Kim, S.J.; Facchinetti, V.; Julien, L.-A.; Finlan, M.; Roux, P.P.; Su, B.; Jacinto, E. mTORC2 can associate with ribosomes to promote cotranslational phosphorylation and stability of nascent Akt polypeptide. EMBO J. 2010, 29, 3939–3951.
- Chen, C.-H.; Kiyan, V.; Zhylkibayev, A.A.; Kazyken, D.; Bulgakova, O.; Page, K.E.; Bersimbaev, R.I.; Spooner, E.; Sarbassov, D.D. Autoregulation of the Mechanistic Target of Rapamycin (mTOR) Complex 2 Integrity Is Controlled by an ATP-dependent Mechanism. J. Biol. Chem. 2013, 288, 27019–27030.
- Peterson, R.T.; Beal, P.A.; Comb, M.J.; Schreiber, S.L. FKBP12-Rapamycin-associated Protein (FRAP) Autophosphorylates at Serine 2481 under Translationally Repressive Conditions. J. Biol. Chem. 2000, 275, 7416–7423.
- Copp, J.; Manning, G.; Hunter, T. TORC-Specific Phosphorylation of Mammalian Target of Rapamycin (mTOR): Phospho-Ser2481 Is a Marker for Intact mTOR Signaling Complex 2. Cancer Res. 2009, 69, 1821–1827.
- Soliman, G.A.; Acosta-Jaquez, H.A.; Dunlop, E.A.; Ekim, B.; Maj, N.E.; Tee, A.R.; Fingar, D.C. mTOR Ser-2481 autophosphorylation monitors mTORC-specific catalytic activity and clarifies rapamycin mechanism of action. J. Biol. Chem. 2010, 285, 7866–7879.
- Treins, C.; Warne, P.H.; Magnuson, M.A.; Pende, M.; Downward, J. Rictor is a novel target of p70 S6 kinase-1. Oncogene 2009, 29, 1003–1016.
- Julien, L.-A.; Carriere, A.; Moreau, J.; Roux, P.P. mTORC1-Activated S6K1 Phosphorylates Rictor on Threonine 1135 and Regulates mTORC2 Signaling. Mol. Cell. Biol. 2009, 30, 908–921.
- Dibble, C.C.; Asara, J.M.; Manning, B.D. Characterization of Rictor Phosphorylation Sites Reveals Direct Regulation of mTOR Complex 2 by S6K1. Mol. Cell. Biol. 2009, 29, 5657–5670.
- Liu, P.; Gan, W.; Inuzuka, H.; Lazorchak, A.S.; Gao, D.; Arojo, O.; Liu, D.; Wan, L.; Zhai, B.; Yu, Y.; et al. Sin1 phosphorylation impairs mTORC2 complex integrity and inhibits downstream Akt signalling to suppress tumorigenesis. Nat. Cell Biol. 2013, 15, 1340–1350.
- Yang, G.; Murashige, D.S.; Humphrey, S.J.; James, D.E. A Positive Feedback Loop between Akt and mTORC2 via SIN1 Phosphorylation. Cell Rep. 2015, 12, 937–943.
- Gleason, C.E.; Oses-Prieto, J.A.; Li, K.H.; Saha, B.; Situ, G.; Burlingame, A.L.; Pearce, D. Phosphorylation at distinct subcellular locations underlies specificity in mTORC2-mediated activation of SGK1 and Akt. J. Cell Sci. 2019, 132.
- Harrington, L.S.; Findlay, G.M.; Lamb, R.F. Restraining PI3K: mTOR signalling goes back to the membrane. Trends Biochem. Sci. 2005, 30, 35–42.
- O’Reilly, K.E.; Rojo, F.; She, Q.-B.; Solit, D.; Mills, G.B.; Smith, D.; Lane, H.; Hofmann, F.; Hicklin, D.J.; Ludwig, D.L.; et al. mTOR Inhibition Induces Upstream Receptor Tyrosine Kinase Signaling and Activates Akt. Cancer Res. 2006, 66, 1500–1508.
- Düvel, K.; Yecies, J.L.; Menon, S.; Raman, P.; Lipovsky, A.I.; Souza, A.L.; Triantafellow, E.; Ma, Q.; Gorski, R.; Cleaver, S.; et al. Activation of a Metabolic Gene Regulatory Network Downstream of mTOR Complex 1. Mol. Cell 2010, 39, 171–183.
- Huang, H.; Long, L.; Zhou, P.; Chapman, N.M.; Chi, H. mTOR signaling at the crossroads of environmental signals and T-cell fate decisions. Immunol. Rev. 2020, 295, 15–38.
- Feng, Y.; Wu, L. mTOR up-regulation of PFKFB3 is essential for acute myeloid leukemia cell survival. Biochem. Biophys. Res. Commun. 2017, 483, 897–903.
- Van der Poel, H.G.; Hanrahan, C.; Zhong, H.; Simons, J.W. Rapamycin induces Smad activity in prostate cancer cell lines. Urol. Res. 2003, 30, 380–386.
- Rosario, F.J.; Gupta, M.B.; Myatt, L.; Powell, T.L.; Glenn, J.P.; Cox, L.; Jansson, T. Mechanistic Target of Rapamycin Complex 1 Promotes the Expression of Genes Encoding Electron Transport Chain Proteins and Stimulates Oxidative Phosphorylation in Primary Human Trophoblast Cells by Regulating Mitochondrial Biogenesis. Sci. Rep. 2019, 9, 246.
- Morita, M.; Gravel, S.-P.; Chénard, V.; Sikström, K.; Zheng, L.; Alain, T.; Gandin, V.; Avizonis, D.; Arguello, M.; Zakaria, C.; et al. mTORC1 Controls Mitochondrial Activity and Biogenesis through 4E-BP-Dependent Translational Regulation. Cell Metab. 2013, 18, 698–711.
- Yang, K.; Shrestha, S.; Zeng, H.; Karmaus, P.W.; Neale, G.; Vogel, P.; Guertin, D.A.; Lamb, R.F.; Chi, H. T cell exit from quiescence and differentiation into Th2 cells depend on Raptor-mTORC1-mediated metabolic reprogramming. Immunity 2013, 39, 1043–1056.
- Schieke, S.M.; Phillips, D.; McCoy, J.P.; Aponte, A.M.; Shen, R.-F.; Balaban, R.S.; Finkel, T. The Mammalian Target of Rapamycin (mTOR) Pathway Regulates Mitochondrial Oxygen Consumption and Oxidative Capacity. J. Biol. Chem. 2006, 281, 27643–27652.
- Caron, A.; Richard, D.; Laplante, M. The Roles of mTOR Complexes in Lipid Metabolism. Annu. Rev. Nutr. 2015, 35, 321–348.
- Thoreen, C.C. The molecular basis of mTORC1-regulated translation. Biochem. Soc. Trans. 2017, 45, 213–221.
- Gentilella, A.; Kozma, S.C.; Thomas, G. A liaison between mTOR signaling, ribosome biogenesis and cancer. Biochim. Biophys. Acta (BBA) Bioenerg. 2015, 1849, 812–820.
- Hannan, K.M.; Brandenburger, Y.; Jenkins, A.; Sharkey, K.; Cavanaugh, A.; Rothblum, L.; Moss, T.; Poortinga, G.; McArthur, G.A.; Pearson, R.B.; et al. mTOR-dependent regulation of ribosomal gene transcription requires S6K1 and is mediated by phosphorylation of the carboxy-terminal activation domain of the nucleolar transcription factor UBF. Mol. Cell Biol. 2003, 23, 8862–8877.
- Ben-Sahra, I.; Howell, J.J.; Asara, J.M.; Manning, B.D. Stimulation of de Novo Pyrimidine Synthesis by Growth Signaling Through mTOR and S6K1. Science 2013, 339, 1323–1328.
- Robitaille, A.M.; Christen, S.; Shimobayashi, M.; Cornu, M.; Fava, L.L.; Moes, S.; Prescianotto-Baschong, C.; Sauer, U.; Jenoe, P.; Hall, M.N. Quantitative Phosphoproteomics Reveal mTORC1 Activates de Novo Pyrimidine Synthesis. Science 2013, 339, 1320–1323.
- Ben-Sahra, I.; Hoxhaj, G.; Ricoult, S.J.H.; Asara, J.M.; Manning, B.D. mTORC1 induces purine synthesis through control of the mitochondrial tetrahydrofolate cycle. Science 2016, 351, 728–733.
- Hagiwara, A.; Cornu, M.; Cybulski, N.; Polak, P.; Betz, C.; Trapani, F.; Terracciano, L.; Heim, M.H.; Rüegg, M.A.; Hall, M.N. Hepatic mTORC2 Activates Glycolysis and Lipogenesis through Akt, Glucokinase, and SREBP1c. Cell Metab. 2012, 15, 725–738.
- Prakash, V.; Carson, B.B.; Feenstra, J.M.; Dass, R.A.; Sekyrova, P.; Hoshino, A.; Petersen, J.; Guo, Y.; Parks, M.M.; Kurylo, C.M.; et al. Ribosome biogenesis during cell cycle arrest fuels EMT in development and disease. Nat. Commun. 2019, 10, 1–16.
- Gu, Y.; Albuquerque, C.P.; Braas, D.; Zhang, W.; Villa, G.R.; Bi, J.; Ikegami, S.; Masui, K.; Gini, B.; Yang, H.; et al. mTORC2 Regulates Amino Acid Metabolism in Cancer by Phosphorylation of the Cystine-Glutamate Antiporter xCT. Mol. Cell 2017, 67, 128–138.e7.
- Cheng, J.; Huang, Y.; Zhang, X.; Yu, Y.; Wu, S.; Jiao, J.; Tran, L.; Zhang, W.; Liu, R.; Zhang, L.; et al. TRIM21 and PHLDA3 negatively regulate the crosstalk between the PI3K/AKT pathway and PPP metabolism. Nat. Commun. 2020, 11, 1880.
- Saha, A.; Connelly, S.; Jiang, J.; Zhuang, S.; Amador, D.T.; Phan, T.; Pilz, R.B.; Boss, G.R. Akt Phosphorylation and Regulation of Transketolase Is a Nodal Point for Amino Acid Control of Purine Synthesis. Mol. Cell 2014, 55, 264–276.
- Wang, W.; Fridman, A.; Blackledge, W.; Connelly, S.; Wilson, I.A.; Pilz, R.B.; Boss, G.R. The Phosphatidylinositol 3-Kinase/Akt Cassette Regulates Purine Nucleotide Synthesis. J. Biol. Chem. 2009, 284, 3521–3528.
- Yang, K.; Chi, H. mTOR and metabolic pathways in T cell quiescence and functional activation. Semin. Immunol. 2012, 24, 421–428.
- Chapman, N.M.; Chi, H. mTOR Links Environmental Signals to T Cell Fate Decisions. Front. Immunol. 2015, 5, 686.
- Waickman, A.T.; Powell, J.D. mTOR, metabolism, and the regulation of T-cell differentiation and function. Immunol. Rev. 2012, 249, 43–58.
- Wang, R.; Dillon, C.P.; Shi, L.Z.; Milasta, S.; Carter, R.; Finkelstein, D.; McCormick, L.L.; Fitzgerald, P.; Chi, H.; Munger, J.; et al. The Transcription Factor Myc Controls Metabolic Reprogramming upon T Lymphocyte Activation. Immunity 2011, 35, 871–882.
- Araki, K.; Turner, A.P.; Shaffer, V.O.; Gangappa, S.; Keller, S.A.; Bachmann, M.F.; Larsen, C.P.; Ahmed, R. mTOR regulates memory CD8 T-cell differentiation. Nat. Cell Biol. 2009, 460, 108–112.
- Zeng, H.; Yang, K.; Cloer, C.; Neale, G.; Vogel, P.; Chi, H. mTORC1 couples immune signals and metabolic programming to establish T(reg)-cell function. Nature 2013, 499, 485–490.