Your browser does not fully support modern features. Please upgrade for a smoother experience.
Please note this is a comparison between Version 3 by Dean Liu and Version 2 by Dean Liu.
Solitary fibrous tumors arising from the bone are an extremely rare event and only few cases have been previously described in the literature.
- solitary fibrous tumor
- primary bone tumor
- risk stratification
- prognosis
- NAB2-STAT6 fusion transcripts
1. Introduction
Solitary fibrous tumor (SFT) is a rare mesenchymal tumor of fibroblastic origin that can occur at any anatomic site and typically affects middle-aged adults [1][2][3]. It is characterized by a strong morphologic heterogeneity with a wide spectrum of biologic features. The histological and molecular diagnostic criteria used in soft tissue SFT (S-SFT) have been recently applied on “non otherwise classified” primary bone tumors, drawing out a new category of SFT of the bone (B-SFT) [4][5][6][7]. Nevertheless, B-SFT is exceedingly rare, with only few cases are described in the literature [8][9][10][11], and its biological behavior has not yet been assessed. From a histopathological and molecular point of view, primary B-SFT shares the same features of S-SFT. It is characterized by a prominent, branched vascularization, with a thin and dilated vascular texture defined as “staghorn” and by the presence of the NAB2-STAT6 gene rearrangement (NGFI-A binding protein 2—Signal Transducer and Activator of Transcription 6), present in about 90% of cases and considered a pathognomonic feature [1][12]. Positivity to CD34 stain is distinctive in 90–95% of the cases. S-SFT has an intermediate malignant potential with a low risk of metastasis. Some studies have investigated the prognostic role of previously described molecular markers, without, however, obtaining conclusive results; the aforementioned prognostic criteria have never been explored in B-SFT [13][14][15][16]. Most S-SFTs are clinically indolent, with an intermediate malignant potential and a low risk of metastasis, showing an overall 5- and 10-year distant metastasis (DM)-free rates of 74% and 55%, respectively. In recent times, different stratification risk models have been proposed [17][18][19][20][21][22]. The current most utilized scoring system to discriminate different risk groups for S-SFT—also related to the development of distal metastasis—is the one proposed by Demicco et al. [22], which considers patient age, mitotic activity, tumor necrosis, and size. To date, few prognostic molecular markers have been analyzed. NAB2–STAT6 chimeric transcripts, with a frequency ranging from 55 to 100% [23][24], and characterized by different breakpoints in fusion genes, might contribute to the morphologic diversity of SFT; some studies evidenced associations between specific fusion variants and different clinical features [21][25]. In addition, specific point mutations within the promoter region of telomerase reverse transcriptase (TERT)—C228Tand C250T—have been recently reported in S-SFT subsets and other tumors [15][25][26][27]. These mutations confer enhanced TERT promoter activity and have been suggested as predictive factors to identify high-risk patients. Finally, TP53 has also been proposed as an SFTs risk factor. In particular, tumors with TP53 mutations were almost always classified as high risk [21][28]. Due to the rarity of B-SFT and taking advantage of the availability of a large and homogeneous cohort of patients, the goal of this study was to better characterize the biological behavior of this specific SFT subset located in the bone considering both the clinical, histological, and molecular features, as well as the applicability of the risk stratification model used for S-SFT.
Histopathological and Immunohistochemical Features
2. Histopathological and Immunohistochemical Features
From a histopathological point of view, 15 cases showed more than 4 mitotic figures per 10 HPF and were associated with high cellularity, cytologic atypia, and >10% of necrosis, defining high-grade tumors (Figure 1, Table 2). CD34 and STAT6 immunopositivity was observed in 95% (23/24) and in 100% (24/24) of cases, respectively (Figure 2).
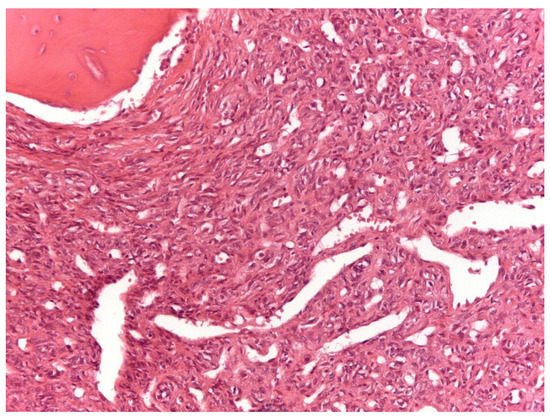
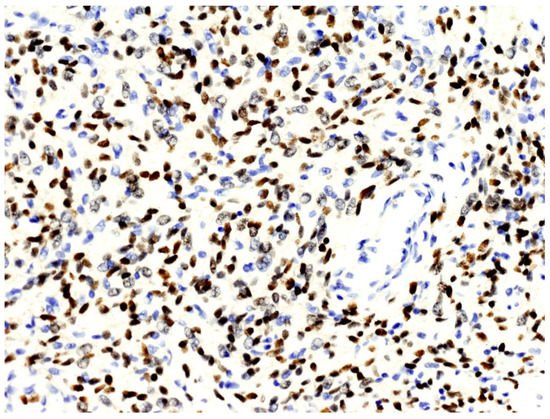
Figure 1. Solitary fibrous tumor: A spindle cell proliferation showing hemangiopericytoma-like blood vessels is seen (Hematoxylin &Eosin, original magnification, ×100).
Figure 2. The nuclei of neoplastic cells express STAT6 (original magnification, ×200).
According to Demicco score [22], 8 patients (33%) were classified in the low-risk group, 11 (46%) in the intermediate-risk group, and 5 (21%) in the high-risk group (Table 1).
Two of the nine patients who developed distant metastasis belonged to the low-risk groups, five to the intermediate-risk group, while two patients belonged to the high-risk group. The three patients with metastasis at presentation were equally distributed in the three risk groups.
3.3. NAB2–STAT6 Fusion Variants
3. NAB2–STAT6 Fusion Variants
The analysis of fusion transcripts identified NAB2–STAT6 fusion variants in 10 out of 12 (83.3%) samples (Table 2). In two cases, no variant was found. Considering the 24 types of fusion variants evaluated, 2 breakpoints were detected with a higher frequency: NAB2exon6—STAT6exon17 (4 cases) and NAB2exon4-STAT6exon2 (3 cases), followed by the breakpoint NAB2exon6—STAT6exon16, NAB2exon2—STAT6exon2 and NAB2exon6-STAT6exon16/NAB2exon6—STAT6exon17 in one case (Table 2). Regarding the Demicco score risk, the NABex6-STAT6ex17 fusion variant was present only in high- and intermediate-risk patients, even if NAB2-STAT6 fusion variants and Demicco score risk were not significantly correlated (p = 0.25).
3.4. TERT Promoter Mutations: C228T and C250T
4. TERT Promoter Mutations: C228T and C250T
The wild-type C250C genotype was shown in all 16 samples while no C250T mutations were detected. In only one DNA sample, a heterozygous C228T substitution was detected.
The only patient presenting this variant died one day after surgery due to complications; therefore, it was not possible to evaluate its prognostic role (Table 2).
3.5. p53 Mutations
5. p53 Mutations
Overall, we detected p53 genetic alterations in 11 samples (Table 2). Three samples presented point mutations: a nonsense heterozygous variant (p.Gln165*) was detected in patient 1; a missense heterozygous variants (p.Ala63Val), already described as a variant of uncertain significance (VUS), was detected in patient 16; and a homozygous splice site alteration (c.375 + 1G > A) was observed in patient 11. All samples except two (1 and 14) showed the presence of a copy number variation (CNV) involving at least exon 4 of p53. In detail, CNV deletions were detected in patient 2, 7, 13, 15, 18, 19, and 23 whereas CNV amplifications were detected in patient 16 and 21.
3.6. Correlations between Clinicopathological, Immunohistochemical, and Molecular Data
6. Correlations between Clinicopathological, Immunohistochemical, and Molecular Data
Regarding the entire population of study (24 cases), 5- and 10-year DSS were respectively 64% and 42%, whereas on the localized tumor, 5- and 10-year disease-related-specific DSS were respectively 80% and 60%. As expected, localized and surgically treated patients (16 out of 24, 66%) showed a better 5-year DSS than metastatic ones (74% vs. 33%) (Figure 3).
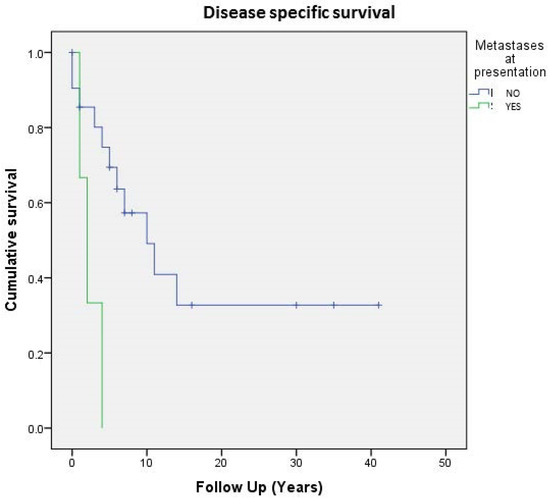
Figure 3. Cumulative survival of 24 patients affected by primary bone solitary fibrous tumor; stratification by metastases at presentation.
Table 3 summarizes the results of the Kaplan–Meier survival analysis of the clinicopathological variables (histological grade, tumor size, age, mitosis, necrosis, Demicco score risk). Stratification by tumor size did not correlate with DSS either for localized patients (p = 0.54) or for the whole series (p = 0.44). However, the only patient with tumor size <5 cm was alive at follow up (Table 3). Stratification based on mitotic count was carried out (A ≤ 1 mitosis, B = 1–3 mitosis, and C ≥ 4); no correlation was found in terms of DSS at the 5- and 10-year follow up either for the whole series (p = 0.54) or for patients with localized disease (p = 0.33) (Table 3).
Table 3.
Disease-specific survival (DSS) analysis related to clinicopathological parameters.
| Variables | Disease Specific Survival (24 pts) | Localized Disease * (16 pts) | |||||
|---|---|---|---|---|---|---|---|
| 5 Years-DSS | 10 Years-DSS | p-Value | 5 Years-DSS | 10 Years-DSS | p-Value | ||
| Histological Grade | |||||||
| Low | 62% | 31% | 0.52 | 100% | 67% | 0.84 | |
| High | 65% | 58% | 82% | 71% | |||
| Size | |||||||
| (A) 0–4.99 cm | 100% | 100% | 0.44 | 100% | 100% | 0.54 | |
| (B) 5–9.99 cm | 70% | 36% | 87% | 45% | |||
| (C)10–14.99 cm | 62% | 62% | 80% | 80% | |||
| (D) >15 | 50% | 50% | 50% | 50% | |||
| Age | |||||||
| <55 years | 86% | 27% | 0.06 | 100% | 77% | 0.15 | |
| ≥55 years | 61% | 27% | 100% | 60% | |||
| Mitosis | |||||||
| (A) <1 | 60% | 30% | 0.54 | 60% | 30% | 0.33 | |
| (B) 1–3 | 66% | 33% | 100% | 50% | |||
| (C) ≥4 | 65% | 58% | 76% | 68% | |||
| Necrosis | |||||||
| <10% | 80% | 47% | 0.66 | 100% | 62% | 0.95 | |
| ≥10% | 51% | 51% | 78% | 78% | |||
| Gene Fusion | |||||||
| Exon6 | 80% | 40% | 0.68 | ||||
| Other | 100% | 67% | |||||
| Demicco Score Risk | |||||||
| High | 54% | 54% | 0.43 | ||||
| Intermediate | 72% | 46% | |||||
| Low | 64% | 28% | |||||
* Surgically treated patients; DSS: disease-specific survival.
No significant differences in terms of DSS were found between the different variables analyzed by univariate analysis. Of interest, DSS in patients aged <55 and ≥55 years was found to be almost near statistical significance (p = 0.06), confirming a better prognosis in younger patients. In line with the malignancy histological criteria, none of the NAB2-STAT6 fusion variants detected were significantly correlated to DSS both in all 24 cases (p = 0.72) and in 16 localized cases (p = 0.57). In localized patients, Exon6 was involved in 2 cases out of 5 while other fusion variants (Exon2, Exon4, Other) were detectable in 3 cases out of 6; no significant correlation (p = 0.68) in terms of DSS was observed at the 5- and 10-year follow up (80% vs. 40% and 100% vs. 67%, respectively). P53 variants were assessed in 12 cases: 11 (91.6%) cases showed variation while in one case, no alteration was found. Since few cases were analyzed, no statistical analysis was done; however, tumors with p53 mutations were classified as follows: two ‘low-risk’, three ‘high-risk’, and six ‘intermediate-risk’ cases. Further, 5- and 10-year DSS in the mutated patient was 73% and 54%, respectively, with a mean follow up of 139 months (range 8–495).
The MFS was found to be about 72% at 5 years and 27% at 10 years, as 9 out of 16 patients developed distant metastasis after a mean time of 53 months, whereas the RFS was found to be 100% at 5 years and 75% at 10 years, respectively, as 3 patients out of 16 developed local recurrence after a mean time of 106 months. No significant differences in terms of MFS and of RFS were found between the different variables analyzed by univariate analysis.
Of interest was finding that no local recurrence occurred in patients considered to be low-grade malignancy. In particular, 10-year RFS was 64% for high-grade patients against 100% in low-grade patients. Nevertheless, the p value obtained was not significant (p = 0.19), probably due to the limited number of patients, which could represent a bias.
References
- Demicco, E.G.; Fritchie, K.J.; Han, A. Solitary fibrous tumor. In WHO Classification of Tumours 5th Edition: Soft Tissue and Bone Tumours; WHO Classification of Tumours Editorial Board, Ed.; IARC Press: Lyon, France, 2020; Volume 5, pp. 104–108.
- Klemperer, P.; Rabin, C.B. Primary neoplasms of the pleura. Arch. Pathol. 1931, 11, 385–412.
- Picci, P.; Manfrini, M.; Donati, D.M.; Gambarotti, M.; Righi, A.; Vanel, D.; Dei Tos, A.P. Diagnosis of Musculoskeletal Tumors and Tumor-Like Conditions. Clinical, Radiological and Histological Correlations—The Rizzoli Case Archive, 2nd ed.; Springer: Cham, Switzerland, 2020; pp. 3–11.
- Verbeke, S.L.; Fletcher, C.D.; Alberghini, M.; Daugaard, S.; Flanagan, A.M.; Parratt, T.; Kroon, H.M.; Hogendoorn, P.; Bovée, J.V. A Reappraisal of Hemangiopericytoma of Bone; Analysis of Cases Reclassified as Synovial Sarcoma and Solitary Fibrous Tumor of Bone. Am. J. Surg. Pathol. 2010, 34, 777–783.
- Dei Tos, A.P.; Righi, A.; Gambarotti, M.; Vanel, D.; Ferrari, C.; Benini, S.; Ferrari, S.; Picci, P. Reappraisal of primary spindle/pleomorphic sarcoma of bone. Mod. Pathol. 2014, 27, 15A.
- Fletcher, C.D. Haemangiopericytoma- A dying breed? Reappraisal of an ‘entity’ and its variants: A hypothesis. Curr. Diagn. Pathol. 1994, 1, 19–23.
- Fletcher, C.D. The evolving classification of soft tissue tumours: An update based on the new WHO classification. Histopathology 2006, 48, 3–12.
- Coca-Pelaz, A.; Llorente-Pendás, J.L.; Vivanco-Allende, B.; Suarez-Nieto, C. Solitary fibrous tumor of the petrous bone: A successful treatment option. Acta Oto-Laryngol. 2011, 131, 1349–1352.
- Ge, X.; Liao, J.; Choo, R.J.; Yan, J.; Zhang, J. Solitary fibrous tumor of the ilium. Medicine 2017, 96, e9355.
- Suarez-Zamora, D.A.; Rodriguez-Urrego, P.A.; Soto-Montoya, C.; Rivero-Rapalino, O.; Palau-Lazaro, M.A. Malignant Solitary Fibrous Tumor of the Humerus: A Case Report of an Extremely Rare Primary Bone Tumor. Int. J. Surg. Pathol. 2018, 26, 772–776.
- Jia, C.; Crim, J.; Evenski, A.; Layfield, L.J. Solitary fibrous tumor of bone developing lung metastases on long-term follow-up. Skelet. Radiol. 2020, 49, 1865–1871.
- Sbaraglia, M.; Righi, A.; Gambarotti, M.; Vanel, D.; Picci, P.; Tos, A.P.D. Soft Tissue Tumors Rarely Presenting Primary in Bone; Diagnostic Pitfalls. Surg. Pathol. Clin. 2017, 10, 705–730.
- England, D.M.; Hochholzer, L.; McCarthy, M.J. Localized Benign and Malignant Fibrous Tumors of the Pleura. Am. J. Surg. Pathol. 1989, 13, 640–658.
- Gold, J.S.; Antonescu, C.R.; Hajdu, C.; Ferrone, C.R.; Hussain, M.; Lewis, J.J.; Brennan, M.F.; Coit, D.G. Clinicopathologic correlates of solitary fibrous tumors. Cancer 2002, 94, 1057–1068.
- Gholami, S.; Cassidy, M.R.; Kirane, A.; Kuk, D.; Zanchelli, B.; Antonescu, C.R.; Singer, S.; Brennan, M. Size and Location are the Most Important Risk Factors for Malignant Behavior in Resected Solitary Fibrous Tumors. Ann. Surg. Oncol. 2017, 24, 3865–3871.
- Kim, J.M.; Choi, Y.-L.; Kim, Y.J.; Park, H.K.; Kima, J.M.; Choia, Y.-L.; Parka, H.K. Comparison and evaluation of risk factors for meningeal, pleural, and extrapleural solitary fibrous tumors: A clinicopathological study of 92 cases confirmed by STAT6 immunohistochemical staining. Pathol. Res. Pract. 2017, 213, 619–625.
- Doyle, L.A.; Fletcher, C.D.M. Predicting behavior of solitary fibrous tumor: Are we getting closer to more accurate risk assessment? Ann. Surg. Oncol. 2013, 20, 4055–4056.
- Demicco, E.G.; Park, M.S.; Araujo, D.M.; Fox, P.S.; Bassett, R.L.; E Pollock, R.; Lazar, A.J.; Wang, W.-L. Solitary fibrous tumor: A clinicopathological study of 110 cases and proposed risk assessment model. Mod. Pathol. 2012, 25, 1298–1306.
- Pasquali, S.; Gronchi, A.; Strauss, D.; Bonvalot, S.; Jeys, L.; Stacchiotti, S.; Hayes, A.; Honore, C.; Collini, P.; Renne, S.L.; et al. Resectable extra-pleural and extra-meningeal solitary fibrous tumours: A multi-centre prognostic study. Eur. J. Surg. Oncol. (EJSO) 2016, 42, 1064–1070.
- Salas, S.; Resseguier, N.; Blay, J.Y.; Le Cesne, A.; Italiano, A.; Chevreau, C.; Rosset, P.; Isambert, N.; Soulie, P.; Cupissol, D.; et al. Prediction of local and metastatic recurrence in solitary fibrous tumor: Construction of a risk calculator in a multicenter cohort from the French Sarcoma Group (FSG) database. Ann. Oncol. 2017, 28, 1779–1787.
- Machado, I.; Morales, G.N.; Cruz, J.; Lavernia, J.; Giner, F.; Navarro, S.; Ferrandez, A.; Llombart-Bosch, A. Solitary fibrous tumor: A case series identifying pathological adverse factors—implications for risk stratification and classification. Virchows Arch. 2019, 476, 597–607.
- Demicco, E.G.; Wagner, M.J.; Maki, R.G.; Gupta, V.; Iofin, I.; Lazar, A.J.; Wang, W.-L. Risk assessment in solitary fibrous tumors: Validation and refinement of a risk stratification model. Mod. Pathol. 2017, 30, 1433–1442.
- Chmielecki, J.; Crago, A.M.; Rosenberg, M.; O’Connor, R.; Walker, S.R.; Ambrogio, L.; Auclair, D.; McKenna, A.; Heinrich, M.C.; Frank, D.A.; et al. Whole-exome sequencing identifies a recurrent NAB2-STAT6 fusion in solitary fibrous tumors. Nat. Genet. 2013, 45, 131–132.
- Robinson, D.R.; Wu, Y.-M.; Kalyana-Sundaram, S.; Cao, X.; Lonigro, R.J.; Sung, Y.-S.; Chen, C.-L.; Zhang, L.; Wang, R.; Su, F.; et al. Identification of recurrent NAB2-STAT6 gene fusions in solitary fibrous tumor by integrative sequencing. Nat. Genet. 2013, 45, 180–185.
- Barthelmeß, S.; Geddert, H.; Boltze, C.; Moskalev, E.A.; Bieg, M.; Sirbu, H.; Brors, B.; Wiemann, S.; Hartmann, A.; Agaimy, A.; et al. Solitary Fibrous Tumors/Hemangiopericytomas with Different Variants of the NAB2-STAT6 Gene Fusion Are Characterized by Specific Histomorphology and Distinct Clinicopathological Features. Am. J. Pathol. 2014, 184, 1209–1218.
- Bahrami, A.; Lee, S.; Schaefer, I.-M.; Boland, J.M.; Patton, K.T.; Pounds, S.; Fletcher, C.D. TERT promoter mutations and prognosis in solitary fibrous tumor. Mod. Pathol. 2016, 29, 1511–1522.
- Bianchi, G.; Sambri, A.; Pedrini, E.; Pazzaglia, L.; Sangiorgi, L.; Ruengwanichayakun, P.; Donati, D.; Benassi, M.S.; Righi, A. Histological and molecular features of solitary fibrous tumor of the extremities: Clinical correlation. Virchows Arch. 2020, 476, 445–454.
- Park, H.K.; Yu, D.B.; Sung, M.; Oh, E.; Kim, M.; Song, J.-Y.; Lee, M.-S.; Jung, K.; Noh, K.-W.; An, S.; et al. Molecular changes in solitary fibrous tumor progression. J. Mol. Med. 2019, 97, 1413–1425.
More