In electric and hybrid vehicles Life Cycle Assessments (LCAs), batteries play a central role and are in the spotlight of scientific community and public opinion. Automotive batteries constitute, together with the powertrain, the main differences between electric vehicles and internal combustion engine vehicles. For this reason, many decision makers and researchers wondered whether energy and environmental impacts from batteries production, can exceed the benefits generated during the vehicle’s use phase. In this framework, the purpose of the present literature review is to understand how large and variable the main impacts are due to automotive batteries’ life cycle, with particular attention to climate change impacts, and to support researchers with some methodological suggestions in the field of automotive batteries’ LCA. The results show that there is high variability in environmental impact assessment; CO
2
eq emissions per kWh of battery capacity range from 50 to 313 g CO
2
eq/kWh. Nevertheless, either using the lower or upper bounds of this range, electric vehicles result less carbon-intensive in their life cycle than corresponding diesel or petrol vehicles.
- battery electric vehicles
- environmental impacts
- life cycle assessment
- review
Life Cycle Impact Assessment—LCIA
In an LCA, the impacts evaluation phase (Life Cycle Impact Assessment—LCIA) allows the assessment of potential impacts extent using data collected in the LCI. This operation links inventory data with specific impact categories and indicators, in order to better evaluate these impacts. The LCIA phase gives important information for life cycle results interpretation. Since different studies rely on different hypotheses, make use of different databases for background data and, above all, use different Life Cycle Impact Assessment Methods with their own unit, results cannot be compared easily with each other [1]. Nevertheless, some general conclusions may be drawn. First of all, for almost all impact categories, results show that the environmental major impacts of batteries life cycle occur during the production phase [2] and are due to energy consumption during materials and component production [3][4]. In particular, anode production process is responsible for the greatest impacts for impact categories such as eutrophication and acidification, whereas the cathode has major impacts for global warming and abiotic depletion [5]. Coming to the amount of the environmental impacts, results show great variability. Variability is due to, as mentioned, the use of different hypotheses and databases, but it is also linked to the different batteries’ chemistry. As discussed, global warming is the most investigated impact category, since EV market penetration is mainly driven by transport sector decarbonization. Figure 1 summarizes results variability linked to greenhouse gas emissions per kWh of batteries capacity, relating to batteries production phase. These values are extracted or inferred by the assessed studies in this literature review. Depending on the different technologies and on the age of the studies, greenhouse gas emissions per kWh batteries capacity can range from 53 kg CO
eq/kWh to more than 300 kg CO
eq/kWh.
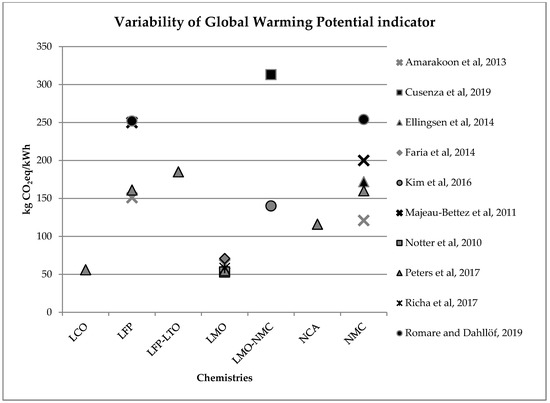
Variability of the global warming potential indicator (kg CO
eq/kWh) for batteries production phase (LCO: Lithium Cobalt Oxide; LFP: Lithium iron phosphate; LFP-LTO: Lithium iron phosphate-Lithium Titanate; LMO: Lithium Manganese Oxide; LMO-NCM: Lithium Manganese Oxide-Lithium Nickel Cobalt Manganese; NCA: Lithium Nickel Cobalt Aluminum Oxide; NCM: Lithium Nickel Cobalt Manganese Oxide).
Considering a modern EV equipped with a 40 kWh battery lasting for 210,000 km [6], the lower and the upper values in Figure 1 correspond to an emission per km ranging from less than 10 g CO
eq/km to almost 60 g CO
eq/km. Nevertheless, despite this high variability, if we consider for the other vehicles life cycle phases, the CO
eq/km reported in reference [6], the total CO
eq/km life cycle emissions of an average middle size EV equipped with a 40 kWh battery, are lower than those of similar diesel or petrol cars, no matter if we consider the upper or the lower bound of battery CO
eq emission variability (see Table 1).
Effects of the variability of CO
eq emission per kWh of battery on the life cycle comparison among a middle size electric, diesel and petrol car. Battery CO
eq emission per km derives from Figure 1
considering 40 kWh of capacity and 210,000 km of life. CO
eq emission per km of remaining life cycle phases are taken from reference [7].
| Vehicle Production | Battery Production | Maintenance | Road | Fuel/Electricity Production | Use | Total | |||||
|---|---|---|---|---|---|---|---|---|---|---|---|
| g CO | 2 | eq /km |
(w/out battery) | Min | Max | IT marg. Mix | Urban Cycle | Min | Max | ||
| Diesel | 38.2 | 0.0 | 0.0 | 7.7 | 0.6 | 41.1 | 198.5 | 286.1 | 286.1 |
| Electric | 37.7 | 9.5 | 59.6 | 6.2 | 0.6 | 92.5 | 0.0 | 146.6 | 196.7 |
| Petrol | 41.5 | 0.0 | 0.0 | 7.4 | 0.5 | 59.1 | 221.6 | 330.0 | 330.0 |
A similar range of variability can be found for other, less investigated, environmental impact categories (see Figure 2, Figure 3, Figure 4 and Figure 5). Again, if we consider a 40 kWh battery lasting for 210,000 km, and we consider the results from reference [7] for the other life stages, we can see that while for some impact categories for which EV perform worst, like eutrophication [7], the variability of the impacts associated with battery production does not affect the environmental ranking among EV and the corresponding ICE Vehicle. For categories like acidification, the use of the lower bound value implies that EV performs better than ICE Vehicle, while the use of the upper bound value implies that the ICE Vehicle is the best performer (see Table 2).
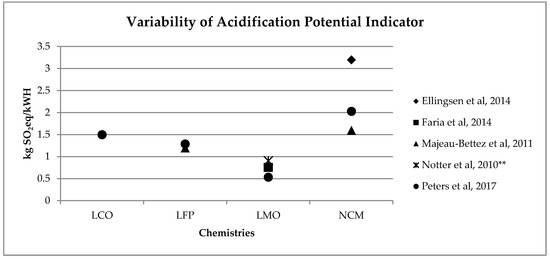
Variability of acidification potential (kg SO2eq/kWh) for batteries production phase (LCO: Lithium Cobalt Oxide; LFP: Lithium iron phosphate; LMO: Lithium Manganese Oxide; NCM: Lithium Nickel Cobalt Manganese Oxide); ** data from reference [3] have been updated using Ecoinvent v 3.5.
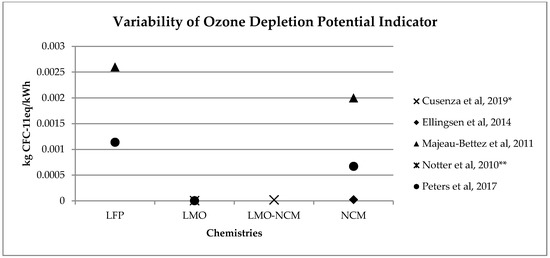
Variability of ozone depletion potential (kg CFC11eq/kWh) for batteries production phase (LFP: Lithium iron phosphate; LMO: Lithium Manganese Oxide; LMO-NCM: Lithium Manganese Oxide-Lithium Nickel Cobalt Manganese; NCM: Lithium Nickel Cobalt Manganese Oxide); * data from reference [2] are calculated on the basis of the total amount and the percentage for battery production, ** data from reference [3] have been updated using Ecoinvent v. 3.5.
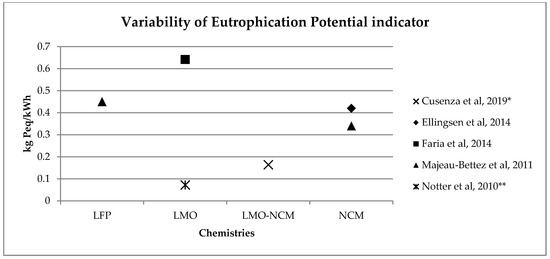
Variability of eutrophication potential (kg Peq/kWh) for batteries production phase (LFP: Lithium iron phosphate; LMO: Lithium Manganese Oxide; LMO-NCM: Lithium Manganese Oxide-Lithium Nickel Cobalt Manganese; NCM: Lithium Nickel Cobalt Manganese Oxide); * data from reference [2] are calculated on the basis of the total amount and the percentage for battery production, ** data from reference [3] have been updated using Ecoinvent v 3.5.
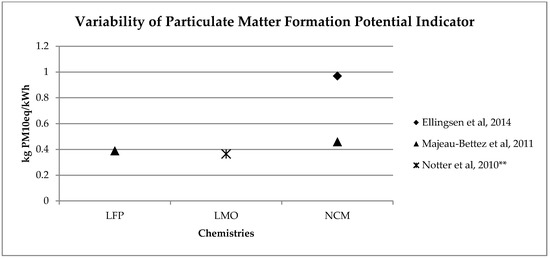
Variability of particulate matter formation potential (kg PM10eq/kWh) for batteries production phase (LFP: Lithium iron phosphate; LMO: Lithium Manganese Oxide; NCM: Lithium Nickel Cobalt Manganese Oxide); ** data from reference [3] have been updated using Ecoinvent v 3.5.
Effects of the variability of acidification potential (g SO
eq) and eutrophication potential (g PO
eq) per kWh of battery on the life cycle comparison among a middle size electric, diesel and petrol car. Battery Emissions per km derives from Figure 2 and Figure 4, considering 40 kWh of capacity and 210,000 km of life. Emissions per km of remaining life cycle phases are taken from reference [7].
| Vehicle | Vehicle Production & Disposal | Battery Production & Disposal | Fuel/Electricity Production & Supply | Use & Maintenance | Total | |||
|---|---|---|---|---|---|---|---|---|
| Impacts/km | Type | Min | Max | Min | Max | |||
| Acidification Potential | EV | 0.10 | 0.10 | 0.70 | 0.23 | 0.02 | 0.46 | 1.00 | ||
| g SO | 2 | eq | ICE | 0.14 | - | - | 0.55 | 0.11 | 0.79 | 0.79 |
| Eutrophication Potential | EV | 0.06 | 0.01 | 0.12 | 0.06 | 0.01 | 0.27 | 0.25 | ||
| g PO | 4 | eq | ICE | 0.06 | - | - | 0.07 | 0.03 | 0.16 | 0.16 |
Of course, many of the impacts associated with battery production could be lowered by recycling battery components and using recycled materials for battery production. Recycling may reduce material production energy demand up to 50% and can help to decrease environmental impacts for all the impact categories assessed [8]. Although there are a number of technologies and combinations of technologies being developed for batteries recycling (hydrometallurgy is close at hand, and can potentially extract more materials than pyrometallurgy) [9], battery recycling options are not always included in the analysis, due to the lack of relevant and reliable information [1]. Recently, a very careful recycle phase analysis has been realized in reference [2]. This work states that the environmental credits associated with materials recovered through battery recycling processes exceed the environmental impacts associated with recycling processes in all the impact categories examined, with the exception of ozone depletion, ionizing radiation and freshwater ecotoxicity. The environmental credits are particularly relevant for some impact categories such as: marine eutrophication (−27%), human toxicity (about −20% for human toxicity no cancer effect and −40% for human toxicity cancer effect), particulate matter (−17%) and abiotic depletion (−16.4%). In particular, the environmental credits related to cobalt, nickel and manganese sulphates, copper and steel are really significant and rise up to almost 80% for an important category such as abiotic depletion. Moreover, the environmental benefits linked to recycling could be increased if other cell components/materials, such as graphite, electrolyte and aluminum, are recovered, i.e., by designing battery cells to make disassembling and separating the cell components easier and more secure [2]. Additionally, for climate change impact, recycling can gain relevant positive effects, and the saved emission can be in a range of 16–32 kg CO
- Notter, D.A.; Gauch, M.; Widmer, R.; Wager, P.; Stamp, A.; Zah, R.; Althaus, H.J. Contribution of Li-ion batteries to the environmental impact of electric vehicles. Environ. Sci. Technol. 2010, 44, 6550–6556. [Google Scholar] [CrossRef] [PubMed]
- Romare, M.; Dahllöf, L. The life cycle energy consumption and greenhouse gas emissions from lithium-ion batteries. Stockholm Zugriff Am 2017, 23. Available online: https://www.ivl.se/download/18.5922281715bdaebede9559/1496046218976/C243+The+life+cycle+energy+consumption+and+CO2+emissions+from+lithium+ion+batteries+.pdf (accessed on 30 March 2020).
- Dunn, J.B.; Gaines, L.; Barnes, M.; Sullivan, J.L.; Wang, M. Material and Energy Flows in the Materials Production, Assembly, and End-of-Life Stages of the Automotive Lithium-Ion Battery Life Cycle; Argonne: Lemont, IL, USA, 2014. [Google Scholar]
- Amarakoon, S.; Smith, J.; Segal, B. Application of Life-Cycle Assessment to Nanoscale Technology: Lithium-Ion Batteries for Electric Vehicles; No. EPA 744-R-12-001; Environmental Protection Agency: Washington, DC, USA, 2013. [Google Scholar]
- ReCharge. PEFCR—Product Environmental Footprint Category Rules for High Specific Energy Rechargeable Batteries for Mobile Applications; Recharge: Brussels, Belgium, 2018. [Google Scholar]
- Richa, K.; Babbitt, C.W.; Nenadic, N.G.; Gaustad, G. Environmental trade-offs across cascading lithium-ion battery life cycles. Int. J. Life Cycle Assess. 2017, 22, 66–81. [Google Scholar] [CrossRef]
- Faria, R.; Marques, P.; Garcia, R.; Moura, P.; Freire, F.; Delgado, J.; de Almeida, A.T. Primary and secondary use of electric mobility batteries from a life cycle perspective. J. Power Sources 2014, 262, 169–177. [Google Scholar] [CrossRef]
- Oliveira, L.; Messagie, M.; Rangaraju, S.; Sanfelix, J.; Rivas, M.H.; Van Mierlo, J. Key issues of lithium-ion batteries–from resource depletion to environmental performance indicators. J. Clean. Prod. 2015, 108, 354–362. [Google Scholar] [CrossRef]
- Liu, C.; Lin, J.; Cao, H.; Zhang, Y.; Sun, Z. Recycling of spent lithium-ion batteries in view of lithium recovery: A critical review. J. Clean. Prod. 2019, 228, 801–813. [Google Scholar] [CrossRef]
- Peters, J.F.; Baumann, M.; Zimmermann, B.; Braun, J.; Weil, M. The environmental impact of Li-Ion batteries and the role of key parameters–A review. Renew. Sustain. Energy Rev. 2017, 67, 491–506. [Google Scholar] [CrossRef]
- Majeau-Bettez, G.; Hawkins, T.R.; Strømman, A.H. Life cycle environmental assessment of lithium-ion and nickel metal hydride batteries for plug-in hybrid and battery electric vehicles. Environ. Sci. Technol. 2011, 45, 4548–4554. [Google Scholar] [CrossRef] [PubMed]
- Dai, Q.; Kelly, J.C.; Gaines, L.; Wang, M. Life cycle analysis of lithium-ion batteries for automotive applications. Batteries 2019, 5, 48. [Google Scholar] [CrossRef]
- ISO—The International Organization for Standardization. ISO 14040:2006: Environmental Management—Life Cycle Assessment—Principles and Framework; ISO—The International Organization for Standardization: Geneva, Switzerland, 2006. [Google Scholar]
- ISO—The International Organization for Standardization. ISO 14044:2006: Environmental Management—Life Cycle Assessment—Requirements and Guidelines; ISO—The International Organization for Standardization: Geneva, Switzerland, 2006. [Google Scholar]
- European Commission—Joint Research Centre—Institute for Environment and Sustainability. International Reference Life Cycle Data System (ILCD) Handbook—Recommendations for Life Cycle Impact Assessment in the European Context, 1st ed.; EUR 24571 EN; Publications Office of the European Union: Luxembourg, 2011. [Google Scholar]
- Ellingsen, L.; Hung, C.; Strømman, A. Identifying key assumptions and differences in life cycle assessment studies of lithium-ion traction batteries with focus on greenhouse gas emissions. Transp. Res. Part D Transp. Environ. 2017, 55, 82–90. [Google Scholar] [CrossRef]
References
- Jens Peters; Manuel Baumann; Benedikt Zimmermann; Jessica Braun; Marcel Weil; The environmental impact of Li-Ion batteries and the role of key parameters – A review. Renewable and Sustainable Energy Reviews 2017, 67, 491-506, 10.1016/j.rser.2016.08.039.
- Maria Anna Cusenza; Silvia Bobba; Fulvio Ardente; Maurizio Cellura; Franco Di Persio; Energy and environmental assessment of a traction lithium-ion battery pack for plug-in hybrid electric vehicles. Journal of Cleaner Production 2019, 215, 634-649, 10.1016/j.jclepro.2019.01.056.
- Dominic A. Notter; Marcel Gauch; Rolf Widmer; Patrick A. Wäger; Anna Stamp; Rainer Zah; Hans-Jörg Althaus; Contribution of Li-Ion Batteries to the Environmental Impact of Electric Vehicles. Environmental Science & Technology 2010, 44, 6550–6556, 10.1021/es1029156.
- Kirti Richa; Callie Babbitt; Nenad G. Nenadic; Gabrielle Gaustad; Environmental trade-offs across cascading lithium-ion battery life cycles. The International Journal of Life Cycle Assessment 2015, 22, 66-81, 10.1007/s11367-015-0942-3.
- Ricardo Faria; Pedro Marques; Rita Garcia; Pedro Moura; Fausto Freire; Joaquim Delgado; Aníbal T. De Almeida; Primary and secondary use of electric mobility batteries from a life cycle perspective. Journal of Power Sources 2014, 262, 169-177, 10.1016/j.jpowsour.2014.03.092.
- Pierpaolo Girardi; Cristina Brambilla; Giulio Mela; Life Cycle Air Emissions External Costs Assessment for Comparing Electric and Traditional Passenger Cars. Integrated Environmental Assessment and Management 2020, 16, 140-150, 10.1002/ieam.4211.
- Pierpaolo Girardi; Alessia Gargiulo; Paola Cristina Brambilla; A comparative LCA of an electric vehicle and an internal combustion engine vehicle using the appropriate power mix: the Italian case study. The International Journal of Life Cycle Assessment 2015, 20, 1127-1142, 10.1007/s11367-015-0903-x.
- Anders Nordelöf; Maarten Messagie; Anne-Marie Tillman; Maria Ljunggren Söderman; Joeri Van Mierlo; Environmental impacts of hybrid, plug-in hybrid, and battery electric vehicles—what can we learn from life cycle assessment?. The International Journal of Life Cycle Assessment 2014, 19, 1866-1890, 10.1007/s11367-014-0788-0.
- Romare, M.; Dahllöf, L. The life cycle energy consumption and greenhouse gas emissions from lithium-ion batteries. Stockholm Zugriff Am 2017, 23. Available online: https://www.ivl.se/download/18.5922281715bdaebede9559/1496046218976/C243+The+life+cycle+energy+consumption+and+CO2+emissions+from+lithium+ion+batteries+.pdf (accessed on 30 March 2020).
- European Commission—Joint Research Centre—Institute for Environment and Sustainability. International Reference Life Cycle Data System (ILCD) Handbook—Recommendations for Life Cycle Impact Assessment in the European Context, 1st ed.; EUR 24571 EN; Publications Office of the European Union: Luxembourg, 2011.
- Chunwei Liu; Jiao Lin; HongBin Cao; Yi Zhang; Zhi H.I. Sun; Recycling of spent lithium-ion batteries in view of lithium recovery: A critical review. Journal of Cleaner Production 2019, 228, 801-813, 10.1016/j.jclepro.2019.04.304.