Thyroid cancer (TC) is the most common endocrine malignancy. Recent progress in thyroid cancer biology revealed a certain degree of intratumoral heterogeneity, highlighting the coexistence of cellular subpopulations with distinct proliferative capacities and differentiation abilities. Among those subpopulations, cancer stem-like cells (CSCs) are hypothesized to drive TC heterogeneity, contributing to its metastatic potential and therapy resistance. CSCs principally exist in tumor areas with specific microenvironmental conditions, the so-called stem cell niches. In particular, in thyroid cancer, CSCs’ survival is enhanced in the hypoxic niche, the immune niche, and some areas with specific extracellular matrix composition.
- thyroid cancer
- cancer stem cells
- tumor microenvironment
- CSCs niche
- targeted therapy
croenvironment1. Introduction
Thyroid cancer (TC) is the most common endocrine malignancy [1]. The thyroid gland is a complex endocrine organ that is potentially affected by a variety of cancers that differ in molecular profile, morphology, tumorigenicity, and invasiveness [1]. Follicular cells can give rise to three different subtypes of thyroid carcinoma: papillary thyroid carcinoma (PTC), follicular thyroid carcinoma (FTC), poorly differentiated thyroid carcinoma (PDTC) and anaplastic thyroid carcinoma (ATC) [2]. PTCs and FTCs account for 80–85% and 10–15% of all TCs, respectively, and usually have a good prognosis. In contrast, ATCs are rare but are characterized by an aggressive phenotype and a poor prognosis [2]. Although ATCs represent only 1% of all thyroid cancers, they account for >50% of the mortality, as they often acquire therapy resistance [3][4][3,4]. TCs have a complex genetic background, with the acquisition of hyperactivating mutations in the BRAF, RAS, and PI3K pathways, together with the loss of function and suppression of PTEN, p53, and b-catenin in the less differentiated forms [5][6][5,6].
Recent progress in thyroid cancer biology revealed a certain degree of intratumoral heterogeneity [7][8][9][10][7,8,9,10], highlighting the coexistence of cellular subpopulations with distinct proliferative capacities and differentiation abilities, whose hierarchical organization is fundamental to the maintenance of the malignant phenotype [11]. Similarly to other solid tumors [12][13][14][15][16][17][12,13,14,15,16,17], a rare subpopulation of cells called cancer stem-like cells (CSCs) is hypothesized to drive the TC heterogeneity and contribute to the metastatic potential and therapy resistance [18][19][20][21][18,19,20,21]. CSCs exist predominantly in different specific tumor niches, where the dynamic equilibrium within cell-intrinsic and cell-extrinsic factors derived by the tumor microenvironment allow for the maintenance of the stem-like phenotype, which is characterized by a lack of tissue-specific differentiation, slow-cycling rate, quiescence, and theoretically unlimited self-renewal abilities [13][22][23][13,22,23].
2. Thyroid Cancer and CSCs
2.1. Thyroid Carcinogenesis and CSCs Origins
According to the classic multistep carcinogenesis model (Figure 1A), TC cells arise from the gradual accumulation of genetic alterations within normal thyroid epithelial cells, leading to uncontrolled proliferation and an invasive phenotype [24][25][24,25]. Thus, PTC and FTC are the results of randomly occurring genetic alterations, such as BRAF and RAS point mutations or the more complex RET/PTC and PAX8/PPARγ rearrangements. The sequential accumulation of further genetic alterations, particularly the inactivating mutations of TP53 and CTNNB1, can then give rise to ATC [26]. These events come with the dedifferentiation process that occurs as the cancer cells acquire the neoplastic phenotype, with a marked epithelial-to-mesenchymal transition (EMT), a process that finally results in CSCs’ phenotype acquisition [27][28][27,28]. Nevertheless, this model has some intrinsic limitations. While the mature thyroid follicular cells have a low proliferation rate, intrinsically limiting the accumulation of multiple mutations [29], the introduction of large-scale genome sequencing techniques revealed that PTC and FTC already have much more complex genetic alterations than what the classical multistep model can explain [30][31][32][30,31,32].
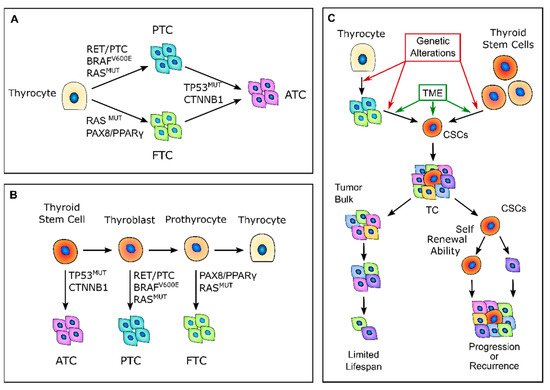
Figure 1. Thyroid carcinogenesis models. (A) Description of the classic multistep carcinogenesis model: the gradual accumulation of genetic alterations in normal thyrocytes leads to the transformation into cancer cells and to the acquisition of subsequently less differentiated and more aggressive phenotypes. Mutations in driver genes, such as BRAF and RAS or RET/PTC and PAX8/PPARγ rearrangements, give rise to the well-differentiated papillary thyroid cancers (PTCs) and follicular thyroid cancers (FTCs), while the acquisition of TP53 and CTNNB1 mutations leads to the transformation in anaplastic thyroid cancers (ATCs). (B) Fetal stem cells’ origin model: thyroid cancer cells are derived from normal stem cells or precursor cells of fetal origin that acquire transforming mutations. These genetic alterations confer proliferative advantages and prevent fetal thyroid cells from differentiating. Less differentiated stem cells give rise to ATCs, while the more differentiated thyroblasts and prothyrocytes give rise to PTCs and FTCs, respectively. (C) Cancer stem-like cells’ (CSCs) origin model: CSCs with high tumorigenic activity and increased ability to self-renew originate from either normal stem cells through a transformation process or from differentiated cancer cells as the result of a dedifferentiation process. The transition of stem cells into mature cancer cells is stimulated by the different tumor environment that is present outside the stem niches. Mature cells cannot sustain tumor progression, while CSCs can reconstitute and sustain tumor growth. TME, tumor microenvironment; TC, thyroid cancer.
In 2005, Takano et al. [26] proposed that TC cells are derived from normal stem cells or precursor cells of fetal origin that survive in the mature gland, rather than from differentiated thyroid follicular cells [26][33][26,33] (Figure 1B). According to this model, normal fetal thyroid stem cells, which express oncofetal fibronectin but none of the markers that are typical of differentiated thyroid cells, give rise to ATC. Thyroblasts, which express both oncofetal fibronectin and the differentiation marker thyroglobulin (Tg), give rise to PTC. Finally, prothyrocytes, which are the more differentiated cell type, should give rise to FTC and follicular adenoma [33]. In this model, genetic alterations confer proliferative advantages and prevent fetal thyroid cells from differentiating. However, there is no explanation regarding how quiescent thyroid stem cells acquire such genetic alterations or about the coexistence of cellular subpopulations with different degrees of differentiation. The evidence that a cancer cell population is heterogeneous and that molecular alterations are not present in the whole tumor bulk finally brought about the CSC hypothesis for TC. The CSCs hypothesis was first established by the observation that leukemia may contain hierarchical multi-lineage cells [34]. In this perspective, some authors hypothesized that TC may be a CSC-driven disease [26][35][36][26,35,36], with only a subset of cancer cells that possess high tumorigenic activity, with increased ability to self-renew and produce progenitor cells that can reconstitute and sustain tumor growth [1] (Figure 1C). In this setting, the transition of stem cells into mature cells is stimulated by growth factors and cytokines present in the microenvironment outside the stem niche [25]. According to this view, CSCs may originate from either normal stem cells through a transformation process or from differentiated cancer cells as the result of a dedifferentiation process [35]. The clinical implication of the CSC model may give rise to important effects for both the diagnosis and treatment of TC, especially for the management of poorly differentiated, recurrent, and rapidly growing diseases that are refractory to radioactive iodine (RAI) therapy. In this view, the eradication of all CSCs play a fundamental role in the disease eradication, whereas the failure to eliminate CSCs will eventually lead to tumor relapse [37].
2.2. Thyroid CSC Identification
Nowadays, CSC identification relies mostly on the evaluation of stemness biomarkers, together with specific in vitro and in vivo assays (Table 1).
In vitro assays aim to demonstrate the self-renewal abilities of the CSCs and comprise thyrosphere formation assays, limiting–diluting assay, serial colony formation, and differentiation assays. Because normal thyroid stem cells can be grown as sphere-like cellular aggregates in a specialized stem cell culture medium, the multicellular three-dimensional (3D) spheroids assay is the best-studied methodology to determine the clonality and multipotency of putative thyroid CSCs [1][38][1,38]. Indeed, the ability to generate spheres in serum-free medium, even after serial passages, indicates that the cells have an extensive capacity for self-renewal and should be able to recreate a heterogeneous tumor cell population and recapitulate the primary tumor morphology [39]. Moreover, different from two-dimensional monolayer cultures, tumor spheroids create intercellular contacts and usually display low values of nutrients, oxygen, and glucose, generating a hypoxic core in the center of the 3D structure, thereby imitating the natural environment of solid tumors [40]. Researchers have also established a colony-forming assay in which cells are cultured in a semisolid methylcellulose medium that recapitulates the extracellular matrix (ECM). This assay allows the clonal progeny of a single cell to grow as a distinct cluster or colony and monitors anchorage-independent growth, which is a key property of cancer cells.
The most definitive way to assess putative CSCs is to inject these cells into immunocompromised mice to verify their ability to develop tumors over time [41]. In particular, the serial transplantations of cells that were isolated from secondary and tertiary xenografts allow for defining their long-term tumorigenic potential, as well as their self-renewing ability [42]. A further enhancement of this approach involves combining these serial transplantations with limiting–dilution assays to determine the minimum number of cancer stem cells that are required for tumor formation and to confirm that tumor size is positively correlated with the number of cells injected [1]. Moreover, the ability of tumor initiation can be more accurately evaluated using an orthotopic transplantation to mimic the tumor environment as closely as possible [39].
Table 1. Markers that are used to identify thyroid CSCs.
. Another putative CSCs marker is prominin-1, also called CD133, which is a five transmembrane domain glycoprotein with unknown function that behaves as a stemness marker in many normal and tumor cells. In TC, Tseng et al. [49] isolated CD133+ cells from ATC primary tumors and ATC cell lines. The CD133+ cells expressed stemness genes, such as POU class 5 homeobox 1 (POU5F1), sex-determining region Y-box 2 (SOX2), and NANOG1, as well as drug-resistance genes (ABCG2, MDR1, and MRP). These cells were also chemoresistant and formed thyrospheres in vitro and tumors in vivo [49].
Ahn et al. [50] identified CD44 and CD24 expression in a small percentage of cells with tumorigenic potential in PTC cell lines and human primary samples. They observed that this subset of cells with tumorigenic capability expressed high levels of CD44, but no expression was detected for CD24 (CD44+/CD24−) [50]. Moreover, these CD44+/CD24− cells expressed the stem cell markers OCT4 and POU5F1 and had a low expression of differentiation markers [50].
To further identify specific thyroid CSCs markers, Shimamura et al. [47] performed a comprehensive analysis of multiple markers (CD13, CD15, CD24, CD44, CD90, CD117, CD133, CD166, CD326, and ALDH activity) on eight thyroid cancer cell lines and then evaluated their ability to form thyrospheres in vitro and tumors in vivo. Their results suggest that ALDHpos and CD326high subpopulation of cells showed higher sphere-forming ability and both self-renewal and differentiation capability, generating homogeneous and heterogeneous cell populations. However, even if ALDH activity and CD326 expression are reliable candidates for detecting thyroid CSCs, they are not universal [47].
Another method to detect CSCs is the side population (SP) assay. This identifies a small subpopulation of cancer cells that is able to exclude the DNA binding dye Hoechst 33342 through the adenosine triphosphate-binding cassette (ABC) family of membrane transporters, which is also responsible for the anticancer drug export and therapy resistance of CSCs [15].
SP cells have been identified in different TCs: they presented a primitive morphology, with a high nuclear-to-cytoplasmic ratio, the ability to undergo thyrosphere formation, and expressed typical stem cell markers, such as OCT-4, NANOG, and SOX2, but no markers of thyroid differentiation [51][52][51,52].
Mitsutake et al. [54] also found a very small portion of SP cells in human thyroid cancer cell lines. The detection of putative thyroid CSCs can also be supported by the evaluation of the expression of biomarkers belonging to self-renewing control pathways, such as Wnt/β-catenin, Sonic hedgehog protein, and Notch1, which are also responsible for the EMT process regulation [54]. Indeed, there is a strong correlation between EMT markers’ expression and the presence of CSCs in TC [28][55][28,55]. For example, a loss of E-cadherin is associated with the expression of CD44, CD133, and Nestin, while Snail1 and vimentin upregulation is associated with ALDH expression [56][57][58][56,57,58].
3. Tumor Microenvironment and CSC Maintenance
Cancer stem cells are a small subpopulation that principally exists in tumor areas with specific microenvironmental conditions, the so-called stem cell niches, which are constituted by different stromal cell types, including a vascular system, mesenchymal and immune cells, the ECM, and soluble factors [13][59][13,59] (Figure 2 and Table 2). The stromal cells and the substances that they secrete are fundamental to maintain the CSCs in a quiescent state and regulate their self-renewal and differentiation through the modulation of several signaling pathways [59]. The principal regulators of thyroid CSCs are the cancer-associated fibroblasts (CAFs) and the matrix secreted from them, the local variations in nutrients and oxygen distribution, mainly due to tumor fibrosis and altered vasculature growth that may create specific hypoxic niches, and immune cells, such as tumor-associated macrophages (TAMs) and mast cells (MCs), which secrete important paracrine factors.
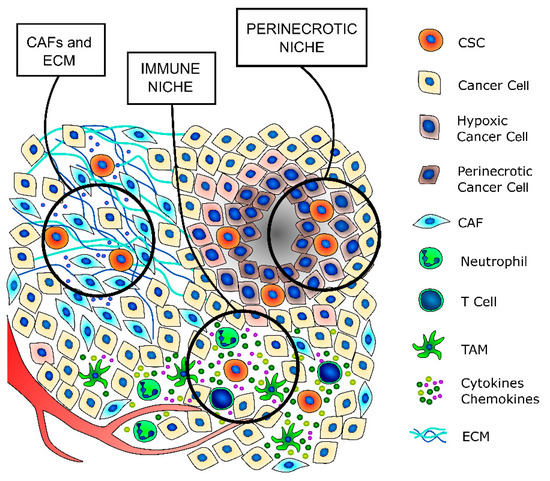
Figure 2. TC stem cell niches. CSCs principally exist in tumor areas with specific microenvironmental conditions, the so-called stem cell niches. The cancer-associated fibroblasts (CAFs) secrete a thicker extracellular matrix (ECM) and different pro-stemness soluble factors that induce the acquisition of a stem-like phenotype by cancer cells and promote and support the survival and self-renewal abilities of already existing CSCs. The immune niche is composed of all the different immune cells that contribute to regulate the CSCs’ phenotypes, such as T lymphocytes, tumor-associated macrophages (TAMs) and neutrophils. Indeed, immune cells secrete a wide variety of cytokines and chemokines that support the maintenance of the stem-like phenotype. The hypoxic niche contributes to CSCs’ phenotype maintenance, mainly through the induction of hypoxia-inducible factors (HIFs), whose activation deeply influences the paraphysiological adaptations to the changes of the tumor microenvironment. Indeed, increasing evidence indicates that HIFs are one of the main regulators of CSC subpopulation maintenance, not only by stimulating an increase in the number of CSCs but also by enhancing the stem-like phenotype of dedifferentiated cancer cells.
Table 2. Secreted factors that promote CSCs’ phenotypes and survival.
Factors | Cell Type | Action/Function | Pathways Involved | Other Cancers | References | |||||||||||||||
|---|---|---|---|---|---|---|---|---|---|---|---|---|---|---|---|---|---|---|---|---|
CCL-2 | CAFs, | TAMs | Stimulates CSCs survival | Notch, | NF-κB | Breast cancer | ||||||||||||||
CCL-15 | TCs | Recruit TAMs | Promotes therapy resistance | CCR1 |
[62] |
.
Another mechanism by which p53 loss promotes stemness is the upregulation of Twist1 and Snail2 expression, which are two important regulators of the EMT process that promote the generation of CSCs through the dedifferentiation of cancer cells [117][118][213,214]. Moreover, p53 can also regulate CD44 expression by modulating its alternative splicings through the RNA-binding protein ZMAT3 [119][215].
Furthermore, a loss of p53 functions promotes the metabolic switch from cellular respiration to glycolysis known as the Warburg effect [120][121][216,217]. This is fundamental for the survival of CSCs in the altered tumor microenvironment, and especially in the hypoxic niches.
Lastly, epigenetic alterations also play a role in CSC maintenance, but this area has been scarcely investigated in TC. A significant number of genes with abnormally methylated promoters in TC are involved in the regulation of the MAPK pathways controlled by RAS, BRAF, and PI3K, and can act as regulators of the EMT [122][123][124][218,219,220]. In addition, in FTC, hypermethylation of the E-cadherin promoter has been reported and was hypothesized to be a further mechanism of the EMT [125][126][221,222]. A similar mechanism is also responsible for the suppression of thyroid differentiation markers, such as NIS and TTF1 [127][128][223,224].
5. Therapeutic Targeting of CSCs and TME Crosstalk
Because CSCs are the main cause of therapy resistance and disease relapse, in recent years, different strategies to target these cancer subpopulations have been developed. Indeed, CSC-targeting therapies rely mostly on three different strategies: the inhibition of CSC stem factors, the modulation of CSCs and TME crosstalk, and the promotion of CSC differentiation [129][225] (Figure 3 and Table 3).
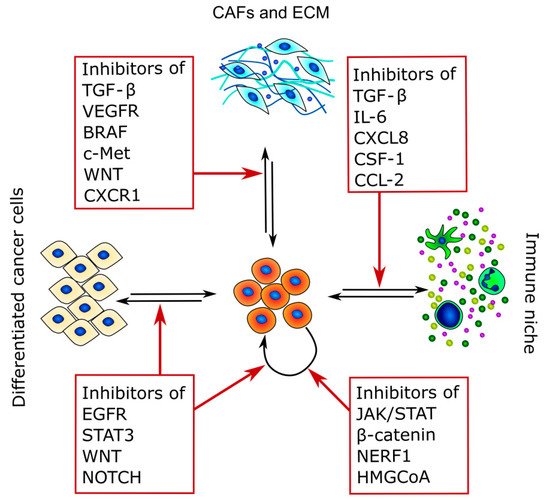
Figure 3. Therapeutic targets of CSCs and TME crosstalk. The figure summarizes the main pathways that can be targeted and highlights the main interactors of CSC crosstalk in which they are involved.
Table 3. Compounds that act against CSC-related pathways.
Pathways | Compound | Cancer Type | Clinical Trials | ||||||||||||||||||||
|---|---|---|---|---|---|---|---|---|---|---|---|---|---|---|---|---|---|---|---|---|---|---|---|
CD44 | H90, P245, H4C4, RO5429083, SPL-108, AMC303 | Ovarian, solid tumors | NCT01358903, NCT03078400, NCT03009214 | ||||||||||||||||||||
CD133 | BsAb | Glioblastoma | NCT03085992 | ||||||||||||||||||||
CXCL-1 | CAFs | Promotes cancer cell stemness | IL-1a/JAK/STAT | Pancreatic ductal adenocarcinoma | |||||||||||||||||||
CXCL-12 | CAFs | Induces CSC markers expression | Wnt, | PI3K/Akt | Colorectal cancer | ||||||||||||||||||
CXCL-2 | CAFs | Promotes cancer cell stemness | |||||||||||||||||||||
Nanog | BBI503 | Hepatocellular, advanced solid tumors | NCT02483247, | NCT01781455, NCT02279719 | |||||||||||||||||||
EpCAM | Catumaxomabr (emovab) | Ovarian | NCT00189345 | ||||||||||||||||||||
Notch | MK-0752, RO4929097, LY3039478, AL101, CB-103, BMS-906024 | ||||||||||||||||||||||
IL-1a/JAK/STAT | |||||||||||||||||||||||
Pancreatic, breast, melanoma, hematologic malignancies | NCT00106145, NCT01098344, NCT00645333, NCT01196416, NCT01232829, NCT02836600, NCT02518113, | NCT03422679 | NCT01363817 | ||||||||||||||||||||
Pancreatic ductal adenocarcinoma | |||||||||||||||||||||||
[ | ] | [ | 71] | ||||||||||||||||||||
CXCL-8 | TAMs, | TCs | Promotes and maintains CSCs phenotype and induces EMT. | NF-κB, EGFR/RAS | Melanoma, | ovarian cancer | Colorectal cancer, | non-small cell lung cancer | |||||||||||||||
Wnt | Vantictumab, Ipafricept | Pancreatic, ovarian, hepatocellular, | breast | ||||||||||||||||||||
] | |||||||||||||||||||||||
NCT02050178, | NCT02092363, | NCT02069145, | NCT01973309, | NCT02005315 | |||||||||||||||||||
[ | ] | [ | |||||||||||||||||||||
HGF | CAFs | Induces CSC markers expression | |||||||||||||||||||||
Β-catenin | PRI-724, CWP232291 | ||||||||||||||||||||||
PI3K, | Met | ||||||||||||||||||||||
Pancreatic, hematologic malignancies | NCT01606579, | NCT01764477, | NCT01398462, NCT02426723 | ||||||||||||||||||||
Colorectal cancer | [ | ||||||||||||||||||||||
IGF-2 | CAFs | Promotes acquisition of stem-like phenotype | |||||||||||||||||||||
FAK | Defactinib/VS-6063, VS-4718 | Lung, ovarian, non-hematologic | |||||||||||||||||||||
PI3K, | TGF-β, | Wnt, | SHH | Non-small cell lung cancer | |||||||||||||||||||
NCT01951690, NCT01778803, NCT02004028, | NCT01849744 | ||||||||||||||||||||||
[ | ] | [ | |||||||||||||||||||||
IL-6 | CAFs, | MCs | Promotes and maintains CSCs phenotype and induces EMT. | JAK/STAT, | NF-κB | Breast cancer, | pancreatic ductal adenocarcinoma | ||||||||||||||||
JAK/STAT | Ruxolitinib, AZD4205, SAR302503, BBI608 | Breast, | glioblastoma, hematopoietic malignancies, | pancreatic | NCT01594216, NCT00952289, NCT03450330, NCT01523171, | NCT02178956, | NCT02315534, | NCT02352558, | NCT02231723 | ||||||||||||||
[ | ] | [79][83][84][85][86],79[,8387,84][,8588] | |||||||||||||||||||||
IL-8 | CAFs, | MCs | |||||||||||||||||||||
EGFR | |||||||||||||||||||||||
Promotes and maintains CSCs phenotype | |||||||||||||||||||||||
Bevacizumab, Matuzumab | |||||||||||||||||||||||
FAK/AKT, Akt/Slug | |||||||||||||||||||||||
Breast, gastric | |||||||||||||||||||||||
NCT01190345, NCT00215644 | |||||||||||||||||||||||
Breast cancer, pancreatic ductal adenocarcinoma | |||||||||||||||||||||||
[ | ] | [ | |||||||||||||||||||||
OPN | CAFs, | ||||||||||||||||||||||
HIFs | |||||||||||||||||||||||
TCs | |||||||||||||||||||||||
PX478, Topotecan | |||||||||||||||||||||||
Supports the clonogenic capacity of CSCs | Induces CSCs markers expression | Wnt, | PI3K | Colorectal cancer | |||||||||||||||||||
Solid tumors, lymphoma, ovarian | |||||||||||||||||||||||
[ | ] | ||||||||||||||||||||||
NCT00522652, NCT01600573, NCT00194935, | NCT02963090 | ||||||||||||||||||||||
[ | ] | [ | ][96] | ||||||||||||||||||||
TGF-β | |||||||||||||||||||||||
AMPK | |||||||||||||||||||||||
CAFs, | TAMs, | TCs | |||||||||||||||||||||
Metformin | |||||||||||||||||||||||
Induces CSCs markers expression | |||||||||||||||||||||||
Ovarian, | |||||||||||||||||||||||
Wnt, | PI3K | ||||||||||||||||||||||
lung | NCT01579812, | NCT01717482 | |||||||||||||||||||||
Colorectal cancer | [ | ][97] | |||||||||||||||||||||
TNF-α | |||||||||||||||||||||||
CXCR4 | |||||||||||||||||||||||
MCs | |||||||||||||||||||||||
Plerixafor, BL-8040, BKT140, BMS-936564, LY2510924, USL311, AMD3100 | |||||||||||||||||||||||
Stimulate immune tolerance | |||||||||||||||||||||||
CCL20 | CXCL8/EGFR | ||||||||||||||||||||||
Pancreatic, glioblastoma, hematologic malignancies | NCT02179970, | ||||||||||||||||||||||
Breast cancer, | colorectal cancer |
Markers |
|---|
Functions | References | ||||||
|---|---|---|---|---|---|---|---|
aldehyde dehydrogenase (ALDH) activity (ALDEFLUOR) | Used to isolate CSCs based on their elevated ALDH activity via positive flow cytometry selection | ||||||
CD133 (prominin-1) | CD133+ cells express stemness genes (POU5F1, SOX2, and NANOG1), drug-resistance genes (ABCG2, MDR1, and MRP), and a low expression of thyroid differentiation markers. | ||||||
CD44+/CD24− phenotype | CD44+/CD24− subpopulation of cells with tumorigenic potential identified by flow cytometry positive selection | ||||||
Side population (SP) cells | Ability to exclude DNA-binding dye Hoechst 33342 via ABC family of transporters; they export anticancer drugs when overexpressed in tumor cells | ||||||
Stem cell transcription factors (OCT-4, SOX2, NANOG) | Highly enriched markers in cell populations with stemness properties | ||||||
EMT-promoting pathways (Notch-1, Wnt signaling, Sonic hedgehog protein) | Pathways involved in promoting self-renewal ability and tumorigenic potential |
Many studies have been carried out to identify the specific biomarkers of thyroid CSCs in the three histopathological TC variants.
Evaluating the enzymatic activity of aldehyde dehydrogenase (ALDH) is a well-known approach for identifying putative CSCs. Indeed, high levels of ALDH activity are present in stem and progenitor cells and seem to be related to their resistance to chemotherapy. Todaro et al. [21] were the first to isolate CSCs from primary thyroid tumors using ALDH activity. They demonstrated that the three histopathological TC variants expressed a small population of cells with tumorigenic potential, elevated ALDH activity, and unlimited replication ability [21]. This subpopulation of cells (1.2–3.5%) of the whole tumor was ALDHhigh and was able to form thyroid spheres when expanded in vitro in serum-free conditions, as well as create sequential tumor xenografts in immunocompromised mice model [21]
MCs: mast cells.
4. Genetic Alterations, TME, and CSCs
Many of the different genetic alterations present in TC cells not only confer a proliferative advantage to the cell themselves but also deeply influence the surrounding microenvironment and the survival of CSCs.
The most studied alteration in this regard is BRAFV600E. Mutated cells have an altered expression of factors that are crucial for ECM remodeling, such as thrombospondin 1, CD44, fibronectin, cathepsin B, TGF-β1, collagen 1, and LOX [100][101][102][117,131,132]. Indeed, the ECM of BRAFV600E TCs has a composition and stiffness that promote the EMT of TC cells and enhances the stem-like phenotype of CSCs. Moreover, the alterations induced by BRAF hyperactivation induce a more acidic TME that also contributes to the induction of an undifferentiated cell phenotype [103][199].
BRAFV600E also significantly induces HIF1a in a hypoxia-unrelated way, and through TIMP-1 activation, synergizes with HIF1A itself to promote metastatic potential and a stem-like phenotype [104][105][200,201]. Similar alterations are also found in TC with PTEN loss, though fewer studies support these findings [100][117].
Alterations in p53 activity that are usually found in less differentiated TCs can deeply influence the CSCs phenotype and maintenance in different ways, from metabolic reprogramming to immune evasion. Even if p53 loss-of-function mutations are characteristic only of the less differentiated TCs, the proinflammatory TME induced by bulk cancer cells can suppress p53 function with various mechanisms. For instance, the activation of pathways such as NOTCH, WNT/b-catenin, and Hedgehog contribute to CSC stemness maintenance by suppressing p53 expression [106][107][108][109][110][202,203,204,205,206].
Indeed, p53 activity is critical for the maintenance of cell proliferation and differentiation, where the loss of p53 functionality promotes the dedifferentiation and maintenance of CSCs [111][207]. In addition, p53 suppression has also been reported in the thyrosphere generated from wild-type p53 TCs [112][208], and the inhibition of p53 is also fundamental in the reprogramming process that allows for the generation of induced pluripotent stem-cells (iPS) cells [113][114][115][116][209,210,211,212]
NCT02907099, |
NCT02765165, | |||||||||||||||||
NCT00512252 | |||||||||||||||||
TGF-β | |||||||||||||||||
Galunisertib, LY3200882, Trabedersen, Fresolimumab, Vactosertib, NIS793 | |||||||||||||||||
Prostate, colorectal, pancreatic, | breast, | melanoma, | hepatocellular, | glioblastoma | NCT02452008, NCT04031872, NCT00844064, NCT01959490, NCT00431561, | NCT00356460, | NCT02947165 |