In 2016 the first >2 MWp fixed tilt bifacial PV system (“La Hormiga”) was built by MegaCell in San Felipe, located in the region of Valparaiso in Chile, using nPERT BiSoN modules. The innovations in this system were the adapted mounting structures (which were not covering the rear side of the modules), as well as the enhancement of albedo using white quartz stones below them. The bifacial gain was about 15% with the natural albedo of ca. 28%, whereas the albedo enhancement to 75% provided by the white stones led to a bifacial gain of about 25%. After that, Sunpreme installed their SHJ (Silicon HeteroJunction) modules in a 10 MWp bifacial system on a US industrial rooftop, and large bifacial systems were installed in China in the TopRunner program, where the Chinese Government was supporting innovations to be introduced into the market. Yingli installed a fixed tilt 50 MWp system with bifacial nPERT Panda modules, followed by a 100 MWp “Panda PV system” in 2018. Since then large bifacial PV systems are entering the PV market. In 2021 bifacial PV became bankable and will become main-stream in the coming 5 years.
- photovoltaics
- bifacial
- energy yield
1. Status of Bifacial PV
Bifacial PV is entering the market quickly as the modules are available at the same cost as their monofacial equivalents. This is because bifacial cells are an evolutionary process of c-Si device development and because module manufacturers are, regardless, increasingly switching to double-glass modules to increase the duration of product warrantees.
1.1. Status of Bifacial Solar Cells
As can be seen in Figure 1a, solar cell technology was for many decades dominated by a very simple Al-BSF (aluminum back surface field) technology using mostly cheap mc-Si (blue bars in the chart) with some more expensive mono Cz-Si wafers (orange bars). In 2015 this was still the case.
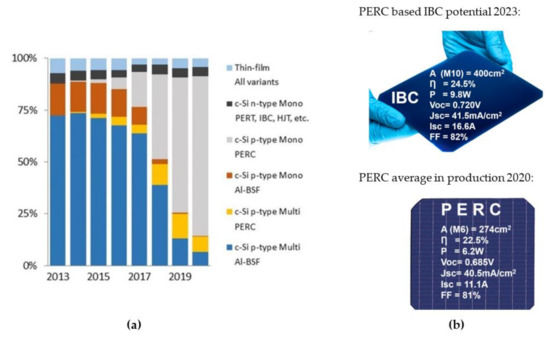
Figure 1. (a) PV solar cell technology share [10][1] and (b) PERC average efficiency in 2020 as well as IBC potential in 2023.
In 2016 the situation changed completely as LONGi put low cost c-Si wafers on the market and the PV industry started to become more innovative in terms of implementing new cell concepts such as PERC and nPERT, which were actually already developed in the laboratories years before that. These low-cost c-Si wafers were also the start of a new bifacial era as good material quality allows a better implementation of open rear side. So, it was no wonder that LONGi was the first Tier1 company to announce a bright future for bifacial PV in 2017 [11][2], pushing bifacial PERC into the PV market. The other large bifacial company is Jolywood, who are however betting on nPERT and TOPCon, and claiming that n-type bifacial is the future. The current situation is that Al-BSF has completely disappeared from the map (only India is still building on Al-BSF mc-Si technology), and PERC still dominates the PV market (gray bar); however, n-type technologies are gaining momentum. This is because PERC, with 22.5% in average in production, is coming to its efficiency limits and it is much easier to implement new technologies such as poly-Si on n-type, as it shows better quality compared to p-type. In order to prolong the p-type dominance in the PV market, LONGi is playing two more aces: improving the p-type material quality by Ga-doping instead of B-doping, and increasing the wafer size. Ga-doping has the advantage that there is no LID (Light Induced Degradation) in the p-type material, since LID occurs due to the formation of B-O complexes. This brings the quality of p-type material closer to n-type; however, n-type still has advantages as it is less sensitive to prominent metallic impurities such as e.g., Fe, and also less sensitive to high temperature processing. Increasing the wafer size from the long time standard, M0 (156 × 156 mm2) to M6 (160 × 160 mm2) and even up to M10 (180 × 180 mm2), and M12 (210 × 210 mm2) has two major drivers: (1) as PERC is coming to its efficiency limits, further cost down of cell production per Wp is not possible with efficiency increases and can thus only be achieved with wafer size increases enhancing the throughput per Wp of the production and, (2) on the other hand, when you are dictating the wafer size you can wash out the small producers which cannot afford to upgrade their machines to larger wafer formats. At the moment the “wafer-size war” is being fought by two companies: LONGi is promoting M10 as standard, and Zhonghuan Semiconductor is promoting M12 [12][3].
Figure 2 shows the history and possible future of c-Si wafer formats. In 2015 the market was still dominated by M0 formats with cell having 3 busbars. Today the average wafer size of newly installed manufacturing lines is M6 with increasing numbers of busbar. As the cell size increases, the use of half cut cells is becoming standard so as to avoid increases in resistive power losses due to higher currents from larger cells. A perfect shape for a solar cell is not a square but rather a long rectangle. In 2022, M10 will become standard and beginning in 2025 we believe that back contact technology will start to dominate the market because it is much easier to improve the contacting with e.g., poly-Si on the rear side of the cell meaning that, in the end, IBC will be the winner of the c-Si solar cell development. Later, to increase efficiencies above 30%, c-Si based tandem technologies such as Perovskite/IBC tandems [13][4] will enter the PV arena. For utility scale applications, these cell architectures will also have to be bifacial.
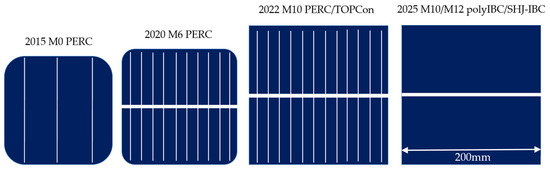
Figure 2. Increasing wafer sizes, number of busbars and solar cells moving away from being a square.
1.2. Status of Bifacial Solar Modules
c-Si based modules are now the focus of developments in order to increase the efficiency of PERC technology, as on cell level the technology is coming to its efficiency limits. What has been developed in recent years is the use of full square wafers and technologies to pack the solar cells closer together and maximize the front side area efficiencies, yielding PERC modules with front side efficiencies close to 21% at STC (Standard Testing Conditions). Another trend is to make the modules bifacial so that the system can benefit from the additional bifacial gain. Figure 3 depicts such a module from the front and rear.
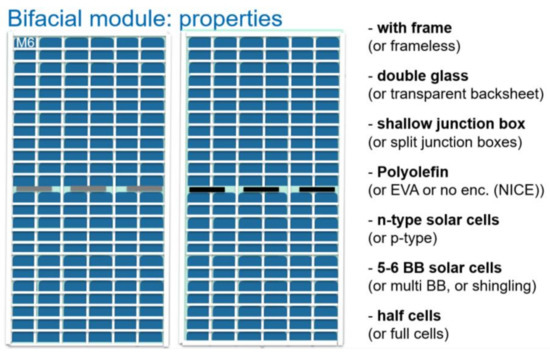
Figure 3. Front (left) and rear side (right) of a bifacial module and its properties.
The modules can be built either with frame or without, as most of the bifacial modules are produced with double glass. The trend these days rather goes back to bifacial modules with frames as they are more stable and can be installed easier. The junction boxed are designed to be shallow in order not to cause any shadowing on the rear side. For p-type cells, the encapsulant used is ethylvinylacetate (EVA), while for n-type cells polyolefin elastomers (POE) are used to reduce PID (Potential Induced Degradation), which is not as easy for n-type as for p-type to be reduced on a cellular level. Since the current increases with increased efficiency and bifaciality, the number of busbars must be increased and the cells must be cut in half or even smaller pieces so as to avoid increased resistive power losses in the connecting ribbons. The major difference for a bifacial module is that white reflectors are being included in-between the cells so that the front side power is not reduced due to the light escaping through the openings between the solar cells instead of being reflected back into the module as it would in monofacial modules with white backsheet.
Table 1 summarizes the status of modules currently on the PV market, showing the efficiency, power, bifaciality, and costs. Depending on the application and the additional costs for BOS (Balance of System), some modules are useful for utility scale while others are more suited for rooftop applications or building integration.
Table 1. Average solar cell and module parameters of different c-Si technologies from [14,15][5][6].
| Solar Cell Technology | Solar Cell Efficiency [%] |
Module Efficiency [%] | M6 72 Half Cells Modue Power [Wp] | Bifaciaity Factor | COO for Cell [€ct/Wp] |
|---|---|---|---|---|---|
| Al-BSF | 21.0 | 19.5–20.0 | up to 410 | 0 | 9–10 |
| PERC | 22.5 | 20.0–20.8 | up to 440 | 0.60–0.75 | 9–11 |
| nPERT | 22.5 |
1.4.1. Energy Yield Measurements
Finally, there are now enough published measurements from bifacial PV systems [19][10] to allow reliable, evidence-based conclusions to be drawn regarding the real world performance of this technology. Table 2 shows a summary of annual energy generation gains for different constellations in comparison to their monofacial equivalents.
Table 2. Energy gains in systems using tracking and bifacial modules [20][11].
| Installation Geometry | Monofacial [%] | Bifacial [%] |
||||||
|---|---|---|---|---|---|---|---|---|
| Fixed tilt (flat roof) | 100 | 105–115 | ||||||
| Fixed tilt (utility scale) | 100 | 107–130 | ||||||
| 20.0–20.8 | up to 440 | 0.85–0.90 | 12–13 | |||||
| Vertical (utility scale) | 40–50 | TOPCon | 23.0 | 20.8–21.5 | up to 450 | 0.85–0.90 | 13–16 | |
| 95–140 * | ||||||||
| HSAT | 110–122 | 117–145 | SHJ | 23.5 | 21.5–22.0 | up to 460 | 0.90–0.95 | 18–22 |
| Low cost IBC | 23.5 | 21.3–21.4 | up to 460 | 0.60–0.75 | 16–20 | |||
| Complex IBC | 24.5 | 21.5–22.5 | up to 480 | 0.40–0.60 | 40–60 |
1.3. Status of Bifacial PV Systems
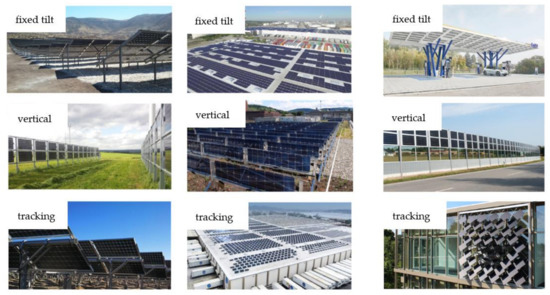
By the end of 2020, worldwide PV installations will comprise up to about 700 GWp. Even with this, we are still only at the beginning of the global PV rollout, and it is expected that annual installations of at least 1 TW will become the norm from 2030 at the latest. However, the daily energy generation profile of a bifacial PV installation can be quite different to that of monofacial equivalents. Figure 4a–d shows the possible installations for bifacial modules and Figure 4e their power generation profiles.
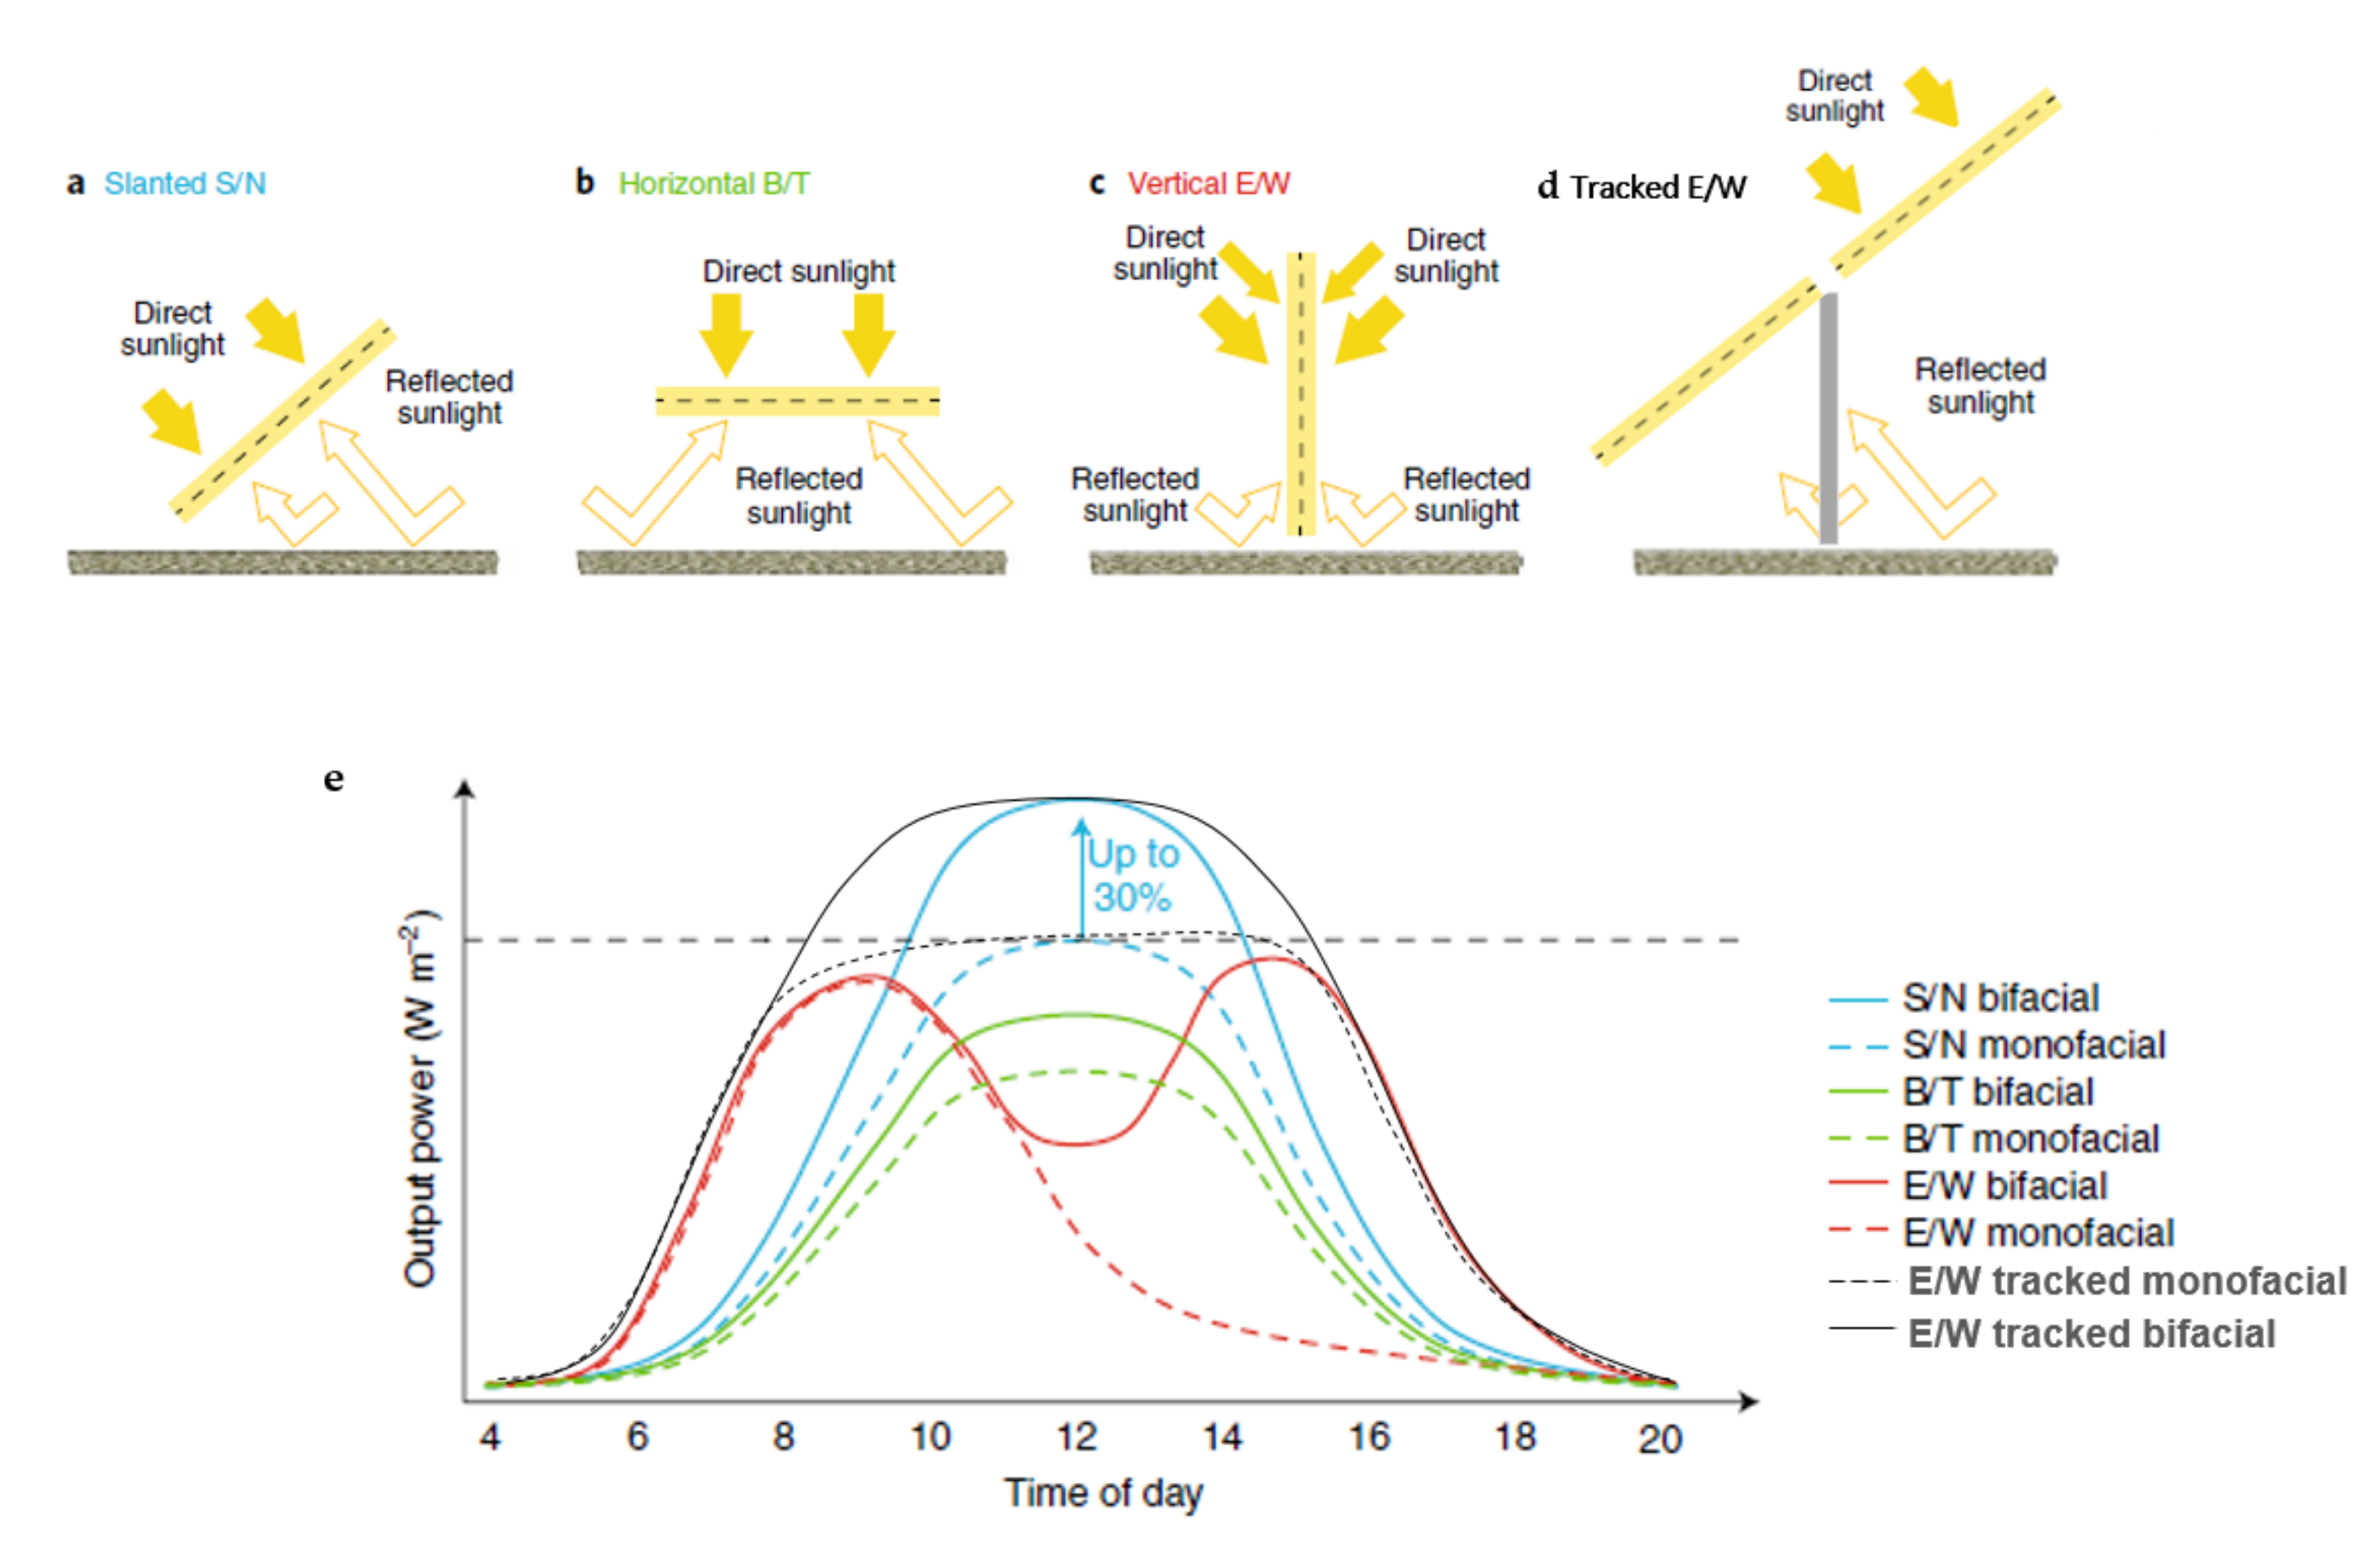
Figure 4. (a–d) possibilities for installations of bifacial modules and (e) comparison of power generation curves for monofacial and bifacial modules [16][7]. S/N means South/North, B/T is Bottom/Top and E/W is East/West.
Classical fixed tilt installations as depicted in Figure 4a can lead to maximum bifacial yield gains of up to 30% in large PV systems, if the installation geometry is optimal (i.e., bottom module edge installed >0.5 m from the ground, low shading from the rear, high row distance, as well as very high albedo e.g., fresh snow). Horizontal installations (Figure 4b) are interesting e.g., for carports, and vertical installations for making use of low GCR (Ground Coverage Ratio) as in AgriPV where the land is also used for farming (Figure 4c). The installation with the highest energy production is the combination of HSAT (Horizontal Single Axis Tracker) with bifacial modules, and in most cases this also results in the lowest LCOE as described in the introduction. In our opinion, as tracking systems require a rather high row-to-row distance anyway and the modules have to be mounted high from the ground (due to the geometrical constraints of the trackers), it does not make sense to use monofacial modules in HSAT systems anymore, and this fact clearly indicates how fast bifacial modules will penetrate the PV market.
Figure 5 shows examples of real installations of bifacial systems for utility scale (left), flat rooftops (centre) and integrated (right). Fixed tilt, vertical, and tracking systems can be seen in all installations types. For ground mounted utility scale systems, it is necessary to evaluate for each specific project (location) whether the maintenance of the moving parts of a tracking system can be assured at a reasonable cost or not. Minimizing the LCOE for desert systems works best with HSAT, as can be seen in the lowest numbers in the MENA region. An important topic these days is AgriPV (agricultural PV) and the double use of space in the EU. In this context, Next2sun has developed a very interesting technology using vertical mounting systems [17][8] on dual use land. The company is cooperating on this technology with TOTAL in France [18][9], as well as other large electricity suppliers throughout countries such as Poland and Sweden. We are sure that this emerging technology will play an important role in AgriPV. Similarly, Solarspar and Solyco are working on vertical installations for flat roof systems to be combined with vegetation on roofs. For electro mobility, vertical installations in sound blocking systems and horizontal installations in car ports will also be useful for generating additional electricity for charging stations.
1.4. Energy Yield Measurements and Simulations
* comparison with monofacial fixed tilt.
Depending on the type of module, the installation geometry, and local albedo, the bifacial energy yield gain can be up to 5–15% on a flat roof. For utility scale this can be increased up to 30% because the installation height can be increased. Vertical installations are comparable to monofacial fixed tilt and, in sun-belt regions, can be lower than for the monofacial reference system. In EU countries such as Germany, Next2sun has measured a 12% bifacial gain. However, the holy grail of highest electricity generation is still HSAT combined with bifacial modules.
1.4.2. Energy Yield Simulations for Bifacial PV Systems
The financial return of a PV project is directly linked to the LCOE (levelized cost of electricity, see e.g., chpater 6 of [19][10] for an overview) that can be achieved when implementing it, which in turn strongly depends on the accumulated energy generation during the lifetime of this PV system. Therefore, as mentioned earlier, one of the key prerequisites for making PV system projects bankable is the existence of accurate energy yield prediction models. Accordingly, in recent years many academic institutions as well as providers of commercial software tools have been putting a lot of effort into the development of physical and mathematical models suitable for accurately modelling the energy yield of bifacial PV systems (see [21][12] for an overview). Compared to the modelling of PV systems consisting of monofacial modules, the need to quantify the rear irradiance received by bifacial modules dramatically increases the degree of complexity. The irradiance incident in the plane of the array on the rear side of a bifacial module is determined by a series of factors that have little or no impact on the energy yield of monofacial modules. These factors are:
-
albedo of the ground surface
-
mounting height of the modules above the ground
-
number of modules in the same row as the module of interest
-
ratio between DHI (diffuse horizontal irradiance) and GHI (global horizontal irradiance)—also called diffuse irradiance fraction
The values of these parameters have to be known with a high degree of accuracy in order to feed the simulation models with high quality input data, and to thus reduce their contribution to the uncertainty in the simulated energy yield. The two main concepts for the optical models that are pursued by scientists involved in the development of such energy yield models are based either on ray tracing or on the view factor concept. While ray tracing models allow for complex geometries such as the shading of the module rear sides by mounting structure elements to be considered, optical models based on view factor are more suitable for simple system configurations, such as large scale ground mounted PV systems with mounting structures that are optimized for bifacial modules. After having determined the front and the rear side irradiance at a given point in time, these values—along with the ambient temperature and the wind speed and direction—serve as inputs to a thermal model (e.g., NOCT model or Faiman model) that calculates the operating temperature of the bifacial module under the given conditions. Finally, the front and rear irradiance, as well as the module operating temperature, are fed into an electrical model of the PV module, providing the electrical power output of the module at the considered point in time, and taking into account the I/V characteristics of the module measured at STC under both the front and rear irradiance. Repeating the above procedure over a given time period—typically a complete year, using typical meteorological year (TMY) data as the input—and subsequently integrating the results over this time period delivers the cumulative energy yield for the year, and it is this annual energy yield that serves as the key figure of merit used to differentiate between the investment value of different installation types, locations, and constellations.
As mentioned above, for all three sub models there are also a variety of choices available, each of them having their advantages and drawbacks. Accordingly, one crucial activity in the development of bifacial energy yield prediction models is the validation of their accuracy using high quality field data. In order to enable such validations, it is helpful to first set up a test PV system with a well-defined geometrical configuration and consisting of bifacial PV modules, as well as monofacial references (having accurate indoor I/V measurement data of the modules available is crucial) and to equip them with the required sensors for global and diffuse irradiance, ambient temperature, and wind speed and direction, as well as for the ground albedo. Then, the electrical output power (of a single module or a string of modules) must be accurately monitored with a given frequency over a time period of ideally at least twelve months so as to cover all seasonal variations. By feeding the energy yield model with the geometrical configuration, as well as the meteorological and I/V data of the modules, modelled values for the instantaneous electrical output at each point of time, and thus the cumulative energy yield can be determined and finally compared with the measured values. The deviation between the measured and modelled values—considering all involved measurement uncertainties—represents an important metric for the accuracy of the model under test.
The simulation model that has been under development at ISC Konstanz since 2015 is called MoBiDiG (“modelling of bifacial distributed gain”) [22][13] and this model is capable of simulating the energy yield of bifacial fixed tilt as well as horizontal single axis tracked systems, with either ray tracing or view factor based optical models, according to the choice of the user. Based on the latest improvements to this simulation model with extensive field data, it has been shown that the energy yield of bifacial PV systems can now be predicted with the same accuracy as their monofacial counterparts (Figure 6 and Table 3).
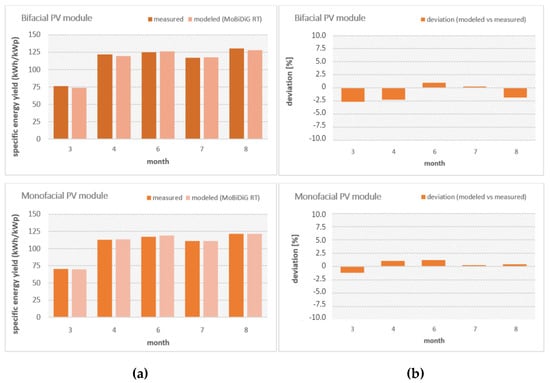
Figure 7. (a) Comparison between measured and modelled specific energy yield of a monofacial and a bifacial PV module (located within a module row) for a time period of 5 months [23][14] with (b) the coresponding deviation. The modelled energy yield has been calculated with the MoBiDiG simulation model using the ray tracing based optical model.
1.5. Bankability
As already stated, bifacial PV systems are finally bankable. This is partly due to the long development of the technology which has become low cost, and partly to the availability of data generated from large bifacial PV installations, standards, and reliable energy yield simulations as explained in the previous sections. “Bankable” means that banks are now giving loans for large bifacial PV systems and finally the private investors do not have to invest on their own. This cycle is common to most technologies: where the “first movers” such as bSolar and MegaCell had to do the initial risky work, and now the “second movers” can enter the market with a more reliable profit potential.
2. Opportunities
Higher complexity offers various installation possibilities. This has been already discussed and shown in previous paragraphs. If you want to reach lowest LCOEs, bifacial HSAT offers the best solution. If you want to benefit from dual use of land area as, e.g., for combined electricity production and agriculture as depicted in Figure 7, then bifacial vertical installations offer the best option.
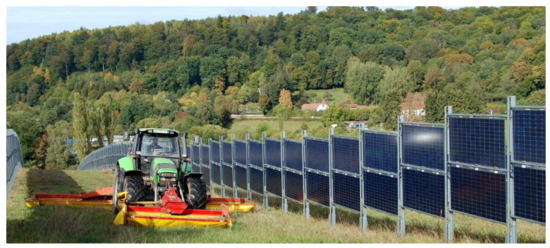
Figure 7. Vertical bifacial PV system by Next2Sun showing the advantage of double use of land [17][8].
We call such unconventional installations from the beginning “PV vineyards”. Such installations offer many advantages in addition to the double use of the land. The electricity generation of such systems is shifted more to the morning and evenings (see Figure 4e). After snow fall, during winter time, the albedo is increased and the modules are not covered by snow, as can be seen in Figure 8. When combined with already installed PV systems facing to the south, the overall generation curve becomes broader—reducing the need for energy storage. Systems such as those provided by Next2sun are gaining in popularity and, with the ongoing collection of data and experience, this technology is becoming increasingly bankable so that even larger systems will be built with this technology in the future.
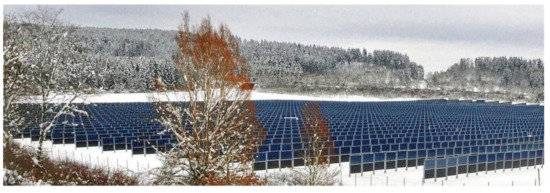
Figure 8. Vertical bifacial PV system by Next2Sun in winter, showing one of the advantages not being covered by snow [17][8].
The opportunities for bifacial PV systems are increasing with time as the bifacial modules these days are now being sold at the same price as their monofacial equivalents. We predict that in a few years it is likely that there will be hardly any monofacial modules left in the PV market for utility scale installations.
References
- PV CellTech 2020 to Explain Why n-PERT Emerging as Differentiated Play for Chinese Leaders. Available online: (accessed on 9 March 2021).
- Intersolar Europe 2017: Bifacial will be Mainstream in Two Years Says LONGi. Available online: (accessed on 9 March 2021).
- Shifting to a Larger Solar Wafer Format: The Rise of M6. Available online: (accessed on 9 March 2021).
- Kopecek, R.; Koduvelikulathu, L.J.; Tune, D.; Kirk, D.; Case, C.; Rienäcker, M.; Schulte-Huxel, H.; Warren, E.; Tamboli, A.; Peibst, R.; et al. tandem PV: A review of c-Si-based tandem technology and what is needed to bring it into production. PV Int. 2020, 45, 40–52.
- PV Market Trends. Available online: (accessed on 9 March 2021).
- Taiyang News Advanced Modules 2019 Report Shows Surprising Developments Leading to Significantly Higher Power Ratings of Solar Panels. Available online: (accessed on 9 March 2021).
- Kopecek, R.; Libal, J. Towards large-scale deployment of bifacial photovoltaics. Nat. Energy 2018, 3, 443–446.
- Next2sun. Available online: (accessed on 9 March 2021).
- French-German Alliance for Vertical PV. Available online: (accessed on 9 March 2021).
- Kopecek, R.; Libal, J. (Eds.) Bifacial Photovoltaics: Technology, Applications and Economics; Institution of Engineering and Technology: Stevenage, UK, 2018; ISBN 978-1-78561-274-9.
- White Paper on Bifacial PV. Available online: (accessed on 9 March 2021).
- Liang, T.S.; Pravettoni, M.; Deline, C.; Stein, J.S.; Kopecek, R.; Singh, J.P.; Luo, W.; Wang, Y.; Aberle, A.G.; Khoo, Y.S. A review of crystalline silicon bifacial photovoltaic performance characterisation and imulation. Energy Environ. Sci. 2019, 12, 116–148.
- Shoukry, I.; Libal, J.; Kopecek, R.; Wefringhaus, E.; Werner, J. Modelling of Bifacial Gain for Stand-alone and in-field Installed Bifacial PV Modules. Energy Procedia 2016, 92, 600–608.
- Berrian, D. Accuracy of Ray Tracing and View Factor Optical Models For Energy Yield Prediction of Fixed Tilt and Tracked Bifacial PV Systems. Ph.D. Thesis, Universität Freiburg, Freiburg, Germany, 2020. Unpublished work.