Your browser does not fully support modern features. Please upgrade for a smoother experience.
Please note this is a comparison between Version 3 by Ke Wang and Version 2 by Ke Wang.
This entry introduces the environmental stability of MAPbI3 perovskite thin film and MAPbBr3 perovskite single crystal.
- photoemission spectroscopy (PES)
- perovskite thin films
- perovskite single crystals
- environmental stability
1. Background
Since the first application in photovoltaic cells in 2009. Organic−inorganic halide perovskites have received considerable attention and have been the focus of the enormous research effort in the past few years due to their outstanding performance in optoelectronic devices. The power conversion efficiency (PCE) of the perovskite solar cells (PSCs) raised from 3.8% in 2009 to 25.5% in 2020 only for a decade of development, given their superb properties such as long diffusion length, long carrier lifetime, tunable bandgap and high absorption coefficient. In addition, ease of fabrication and low production cost make them competitive to the traditional silicon-based solar cells. With these unique features, PSCs are a suitable choice for the next generation of photovoltaic devices. Although the performance of the PSCs has been heavily investigated, the long-term stability is still the biggest concern in the research community that prevents them from further commercial applications.
There are a lot of factors that limit the stability and performance of perovskites, like moisture, oxygen, light irradiation, which have been found and investigated by the research community. Niu et al. found that CH3NH3PbI3 (MAPbI3) could degrade in the presence of moisture and Al2O3 could successfully protect the perovskite layer [10]. Aristidou et al. reported that MAPbI3 photoactive layers rapidly decompose into CH3NH2, PbI2, and I2 after oxygen and light exposure, which is triggered by the reaction of superoxide (O2−) with the CH3NH3+ cation from the perovskite absorber [11]. Philippe et al. studied performance of both MAPbI3-xClx and MAPbI3 under higher temperatures. The perovskite films were heated in an ultra-high vacuum (UHV) chamber without the presence of air and moisture and degraded when the temperature approached 100 °C [12]. Lee et al. observed UV degradation on PSCs after a 1000-h exposure of 365 nm UV light under inert gas at <0.5 ppm humidity without encapsulation [13]. Nie et al. showed their PSCs formed light-activated meta-stable trap states under constant light illumination, which is caused by photocurrent degradation [14]. In addition to the MA-based perovskite, Formamidinium (FA) based perovskites have been reported more stable than pure MA-based perovskites under high temperature, as the molar mass of FA is larger than MA. [15,16] There are also investigations on other factors, such as Iodine vapor, voltage, device structure and mechanical stress [17,18,19,20,21].
2. Environmental Stability of Perovskite Thin Films
2.1. Air Exposure on MAPbI3 Thin Film
The 60 nm thick evaporated MAPbI3 thin film was exposed to the ambient air for ~24 h at room temperature (RT) and relative humidity (RH) of 25%. The total thickness of the perovskite layer was determined by the reading of quartz crystal microbalance during the sample growth process. Figure 2 shows the XPS spectrum that before and after the exposure [46]. Only C, N, I and Pb peaks can be observed and no other elemental features can be found in Figure 2a. The elemental ratio of C:N:Pb:I:O is 1.29:1.07:1.00:2.94:0 which was similar to the ideal stoichiometry of MAPbI3 and better to those from spin-coated ones. These again proved the high quality of the thermal evaporated thin film. For the perovskite thin film after air exposure, the red marks show the appearance of gold and oxygen peaks, and the blue mark stands for the disappearance of the N 1s peak. Therefore, the ratio changed to C:N:Pb:I:O = 2.22:0:1.00:1.26:0.58. This can be attributed to the absorption of moisture from the environment, thus caused the film to degrade into PbI2. It has also been reported that MAPbI3 film became less n-type after a 15-min exposure to ambient air [61]. The XPS used in this study has an MFP of ~2 nm, which unable to detect the underlying gold substrate. In this case, gold signal may suggest that the sample was heavily roughened by air exposure to the gold layer.
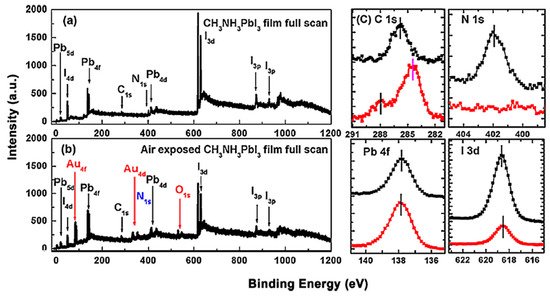
Figure 2. (a) XPS full scan of co-evaporated MAPbI3 thin film and (b) XPS full scan of air-exposed film. (c) XPS spectra comparisons of C 1s, N 1s, Pb 4f, and I 3d core levels. From Ref. [35] with permission.
However, the effects of air exposure are controversial since some reports show that moderate exposure to ambient air could improve crystallinity, grain size, carrier mobility, and charge carrier lifetime of perovskites, thus leading to a better performance of PSCs [62,63,64]. This is contrasted with our observation and the claim that moisture in the air can accelerate the degradation of perovskites [65,66].
2.2. Oxygen Exposure on MAPbI3 Thin Film
Oxygen, as the second-largest composition of air, is considered a potential trigger of perovskite degradation. There are several studies showed that moisture and oxygen could affect the performance of PSCs severely. Sun et al. observed that oxygen-induced degradation is triggered at the surfaces and grain boundaries, which is irreversible and can occur at oxygen levels as low as 1% under light illumination [67]. However, most reports focused on the effects of oxygen and moisture together, while this work discusses the effects from each factor independently.
XPS core level spectra of the MAPbI3 film under O2 exposure and dry air exposure are shown in Figure 3 [47]. Langmuir (L, 1 L = 10−6 Torr·s) is used to measure gas adsorption in a UHV system as a unit of exposure to a surface. No obvious change was observed during the exposure in terms of peak positions and intensities. No oxygen signal can be found even after 1013 L of exposure. There is also no apparent change in the BEs of C 1s, I 3d, and Pb 4f [47]. The valence band maximum (VBM) slightly moved from 0.85 to 0.67 eV after 1013 L of exposure, suggesting that oxygen may serve as a p-type dopant without changing the structure of the film. This can be explained that oxygen photogenerated electrons from the perovskite as an acceptor, leading to the formation of superoxide (O2−) species or the reduction of the metallic Pb-related surface states [11,61,68]. From these spectra, it can be seen that there is no change of the film composition and structure without the presence of moisture. These results indicate that the evaporated film is inert to oxygen. Similarly, Ralairosa et al. also observed shifts of the VBM to lower BE during oxygen exposure, which agrees with our observation [61]. Kim et al. also confirmed that minimal oxygen exposure does not damage the final perovskite structure [69].
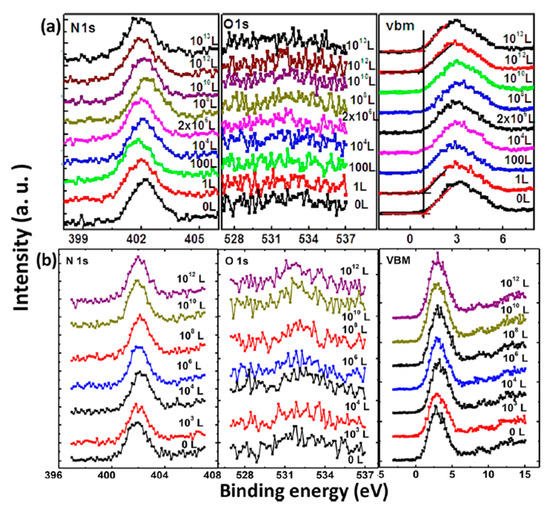
Figure 3. XPS spectra of N 1s, O 1s, and the VBM region of co-evaporated MAPbI3 thin film during (a) oxygen exposure and (b) dry air exposure From Ref. [37] with permission.
2.3. Water Exposure on MAPbI3 Thin Film
Based on the observations above, we learned that water is the most concerned environmental factor that initiates the degradation process of perovskites. To have more insight of the mechanism behind water-induced degradation, air exposure and water exposure monitored with XPS in a well-controlled sequence are shown in Figure 4. Air exposure was conducted at RT and RH of 41%. The spectra were normalized to the same height in order to be compared properly except for those of N 1s because the signal vanished as the exposure proceed. Both structural and compositional trends of the two measurements are similar. There is no significant change of the spectral shape for perovskite carbon peak C 1s-A and nitrogen peak N 1s before 60 min of air exposure and 1 × 10¹⁰ L of water exposure (Stage one); there is only a rigid shift toward the higher BE region. O 1s peak intensity was not increasing in this stage either. In Figure 4b, after 1 × 10¹⁰ L of water exposure, Fermi level moved from 0.85 to 1.41 eV in the VBM region and almost reached the bottom of the conduction band (CB) as the bandgap of MAPbI3 is 1.55 eV [47]. This indicates that water heavily n-doped perovskite in this stage, while the integrity of the sample remains unchanged. This has been related to the metallic Pb surface defects and the position of EF in the bandgap sensitively shifts with the density of these surface states [70,71]. Besides, a density of state develop at 6.5 eV indicates the formation of the metallic Pb, leading to an irreversible degradation [72,73].
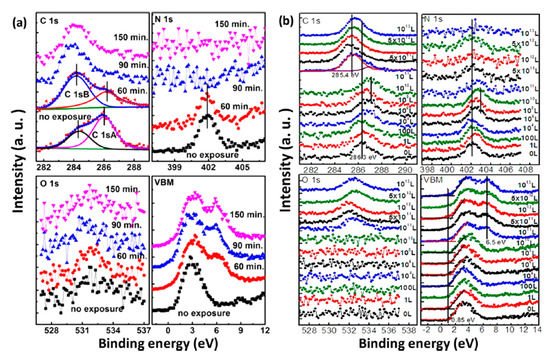
Figure 4. XPS spectral evolutions of C 1s, N 1s, O 1s, and the VBM region of evaporated MAPbI3 thin film during (a) atmospheric air exposure and (b) H2O exposure. From Ref. [37] with permission.
The sample was observed to have dramatic change after 60 min of air exposure and 1 × 10¹⁰ L of water exposure (stage two). In the air exposure, the intensity of perovskite carbon peak C 1s-A started to decrease, while amorphous carbon peak C 1s-B and leftover carbon from the degradation of perovskite began to increase. In water exposure, C 1s peak shifted from 286.3 eV (MA+) to 285.4 eV, which represents the decomposition of MA+ into hydrocarbon complex. After 90 min and 5 × 10¹¹ L of exposure of air and water, the carbon from perovskite was almost disappeared. Similarly, N 1s signal was gone after 150 min and 1012 L of exposure to air and water, respectively, while the O 1s peak from water adsorption appeared and developed significantly. The movement of the O 1s position in Figure 3b is a firm indication of chemical reactions. A broad peak at around 6.5 eV in the VBM region showed up and became sharper over time, suggesting the presence of water on the sample surface in stage two. There is almost no change in the intensity of Pb 4f, while the I/Pb ratio dropped to 2.1 when the exposure ended. These show that water in the air triggers the decomposition of perovskite.
Based on the discussion above, the degradation mechanism of the evaporated MAPbI3 thin film under air exposure was expressed as
CH3NH3PbI3 −→H2O (−CH2−) + PbI2 + NH3↑ + HI↑
The reaction between MAPbI3 and H2O results in a hydrocarbon complex (most likely polyethylene-like (−CH2−CH2−)) [74]. PbI2, and absorbed water. Nitrogen and part of Iodine left the surface as gases. This agrees well with water catalytic model proposed by other groups [10,75]. The degradation process is irreversible as the gaseous species leave the sample surface. However, it has been reported that perovskite monohydrate phase was identified with in-situ grazing-incidence X-ray diffraction (GIXRD) after ~170 min exposure to RH over 80%, which could be attributed to water physisorption [73].
By combining the time of air exposure and the water exposure level, the threshold of water degradation can be obtained. The RH of the atmospheric air was 41% and the saturated vapor pressure is ∼18.650 Torr at RT [76]. Thus, the 60 min exposure amount of ambient air can be calculated as 0.41 × 60 × 60 s × 18.650 Torr = 2.75 × 10¹⁰ L, which is consistent with the threshold between 1010 and 1011 L in water exposure. It can be concluded that water only acts as an n-dopant before ∼2 × 10¹⁰ L of water exposure, while starts to react with the sample and destroy the structure of perovskite beyond the exposure level. In addition to the PES study, XRD measurements also showed a similar degradation process which further confirmed the mechanism [47].
2.4. Light Exposure on MAPbI3 Thin Film
Besides the environmental factors discussed above, light illumination is also another potential trigger of decomposing the perovskite and a number of researchers have been studying this issue. Leijtens et al. claimed that the light-induced degradation of PSCs can be attributed to the TiO2 layer in the device [17]. Murugadoss et al. revealed a strong substrate dependence of perovskite thin films [77]. Bryant et al. studied perovskite stability in gases and ambient environment and found that light illumination was the main factor causing the degradation [78]. Das et al. also reported that the chemical properties of their spin-coated MAPbI3 film change upon illumination in vacuum with the formation of metallic Pb and then by conversion into PbI2. These changes can be restricted by applying an extraction voltage to the device contacts which leads to the extraction of the photogenerated charges from the absorber [79]. Zhao et al. found that MAPbI3 thin films are strained which is caused by the mismatched thermal expansion during the annealing process, thus increases ion migration in strained perovskites films and accelerates degradation of perovskite films under light illumination [80]. Yuan et al. showed that ion migration caused by electric current can accelerate the decomposition of MAPbI3 [81]
The photostability investigation of the MAPbI3 thin film with XPS is shown in Figure 5. The laser has a wavelength of 408 nm and the intensity is ~7 times the AM 1.5 irradiation [82]. For the laser irradiated spot, all peaks began to shift to the higher BE region after 120 min of light exposure and saturated after 480 min. There is a 0.4 eV increase in the VBM after 2210 min of illumination, which agrees with the idea that the film became more n-type during the exposure. A new Pb component showed up at 136.87 eV after 120 min of illumination, which is synchronized with the new feature in the VBM region at 6.5 eV. This new Pb peak represents a new chemical component and was caused metallic Pb to form, which has previously been reported at 137.0 eV for the Pb 4f7/2 and was synchronized with the new peak at 6.5 eV in the VBM region [83,84]. About 33% of the total Pb converted to metallic Pb after the exposure. The intensity of the N 1s and I 3d were also reduced during irradiation. With these observations, it is clear that the film was first decomposed into PbI2 by light irradiation and was further degraded into metallic Pb and iodine. Therefore, excess Pb may cause the sample became n-doping, which is similar to the high temperature annealing of perovskite [43]. The metallic Pb can heavily limit the performance of the device by acting as a quenching center of excitons. For the nonirradiated spot, there is no obvious change for all the peaks.
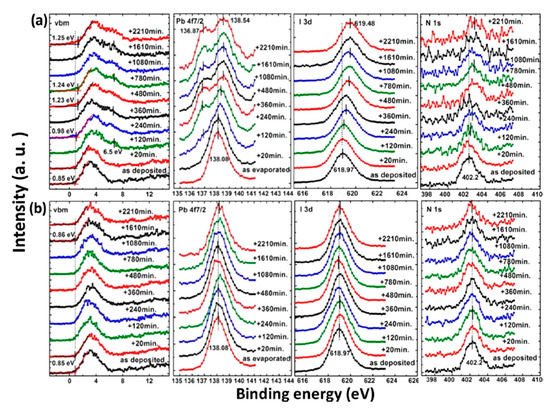
Figure 5. XPS spectra of co-evaporated MAPbI3 thin film at (a) laser irradiated and (b) nonirradiated positions. From Ref. [54] with permission.
The light-induced degradation process discussed above can be expressed as the two following steps [82]

CH3NH3PbI3 −→−Light (−CH2−) + PbI2 + NH3↑ + HI↑
PbI2 −→−Light Pb + I2↑
The volatile species, NH3 and HI leave the surface in the first step, and so does the iodine in the second step by sublimation, leaving the remaining MAPbI3, metallic Pb, and hydrocarbon complex components on the surface. This is also observed by other groups [11,85]. In contrast, Das et al. suggested that photodegradation of MAPbI3 film occurs in two steps in vacuum. First, iodine vacancies were created by vacuum in perovskite, then light-induced charge carriers react with perovskite, forming organic dissociates. These iodine vacancies can trap the photogenerated electrons before the recombination, then Pb2+ could acquire the electron and convert to metallic Pb [79,86]. The vacuum could also accelerate the removal of the volatile species from the perovskite. However, in various literature, it has been reported that the metallic Pb can convert back to perovskite when rest in the dark and cation migration in the dark can enhance the decreased performance of the PSCs [14,87].
3. Environmental Stability of Perovskite Single Crystals
3.1. X-ray Exposure on MAPbBr3 Single Crystal
In Figure 6a, a second Pb component (Pb-B) started to show up at ∼136.04 eV from the second scan as marked by the red arrow, which is identified as the metallic Pb, while the perovskite Pb-A peak is at ∼138.05 eV. As shown in Figure 7, the core level of all elements has no significant change, except for Pb.
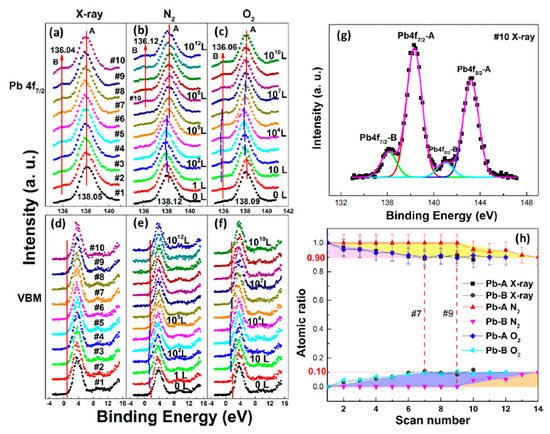
Figure 6. (a–f) XPS spectral evolutions of Pb 4f7/2 and VBM of cleaved MAPbBr3 single crystal under X-ray, N2, and O2 exposures, respectively. (g) The detailed fitting curves for Pb under the 10th X-ray scan. (h) Elemental ratio comparisons of Pb peaks under the three conditions with error bars. From Ref. [38] with permission.

Figure 7. Evolutions of C 1s, N 1s, Br 3d, and O 1s XPS spectra of cleaved MAPbBr3 single crystal under X-ray exposure. From Ref. [38] with permission.
A possible reaction is proposed to explain the conversion of metallic Pb under X-ray exposure [49].

CH3NH3PbBr3 −→−−X−ray CH3NH3Br + Pb + Br2↑
By comparing the elemental ratios of the whole process, 10% Pb-A converted to Pb-B, which suggests that 10% of the perovskite decomposed after 10-h X-ray exposure. C 1s peak position is ∼285.81 eV and no amorphous carbon showed up at ∼284.6 eV at either the test spot (Figure 7) or the control spot (Figure S1 (see supplementary materials)). It shows that the increased carbon was not from the contamination in the UHV chamber, which may suggest that it could be attributed to the surface diffusion of MABr.
3.2. Nitrogen Exposure on MAPbBr3 Single Crystal
Although N2 is normally used to protect the sample as an inert gas during the perovskite environmental studies [66,88,89,90]. the role of N2 in the degradation process remains to be clarified.
Figure 6b,e and Figure 8 are associated with N2 exposure. Before 107 L, it can be observed that all peaks and VBM started to move toward the low BE direction and reach the maximum at 102 L by about 0.31 eV, then shifted back to the original position at 105 L. This represents that the perovskite crystal was slightly p-doped by nitrogen via physical absorption and N2 slowly left the surface afterward. There is no metallic Pb nor other elemental ratio change at 107 L with 9-h X-ray exposure, suggesting that the sample surface can be protected from X-ray degradation with N2 for up to 9 h and stop MABr diffusion at the same time. However, metallic Pb peak started to show up at 108 L and increased to 10% of the total Pb at 1012 L (14-h XPS scan). The degradation process is the same as discussed in Equation (5). It can be concluded that N2 could protect perovskite crystal from XPS X-ray degradation for 9 h as it p-doped perovskite by ∼0.31 eV first then slowly left the surface.
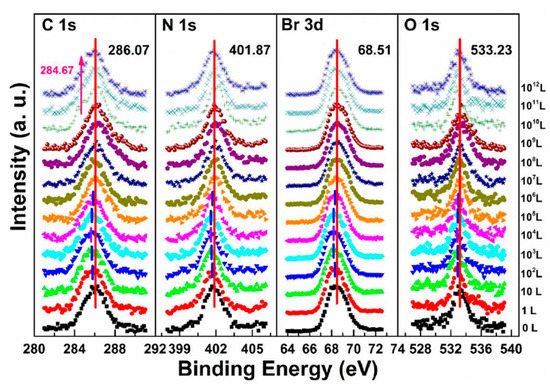
Figure 8. Evolutions of C 1s, N 1s, Br 3d, and O 1s XPS spectra of cleaved MAPbBr3 single crystal under N2 exposures. From Ref. [38] with permission.
3.3. Oxygen Exposure on MAPbBr3 Single Crystal
In the previous discussion of perovskite thin films, O2 does not react with the sample and only acts as a p-dopant during the exposure. It’s also important to know if it acts the same with perovskite SCs.
The metallic Pb peak began to develop from the second scan as under the X-ray exposure, which suggests that O2 cannot shield the sample as N2 did under the same condition, as shown in Figure 6c,f. The peak position and the ratio changes indicate that the exposure process consists two steps. In step one, all peaks started to move to the lower BE direction from 1 L and reached the maximum at 104 L, except O 1s. The VBM also had the same pattern with a maximum shift of ∼0.18 eV, which is the same as the oxygen exposure on perovskite thin films [47]. Meanwhile, O 1s started to move to the higher BE region from the beginning and achieved the maximum of ∼534.09 eV at 104 L. These firmly suggested that the detected O 1s mostly came from the crystal surface by O2 p-doping.
Figure 9 shows that a second carbon peak at ∼287.71 eV (C 1s-B) and a second oxygen peak at ∼532.56 eV (O 1s-B) appeared after 104 L in step two, which indicates the doped oxygen started to bond with carbon and formed C−O bond, at 1010 L. Other peaks began to move back to their original positions as the doped O2 decreased. It is noted that carbon which bonded with oxygen came from MABr due to X-ray degradation and also from MA+ diffusion. Similar to perovskite thin film, perovskite SC also does not react with O2.
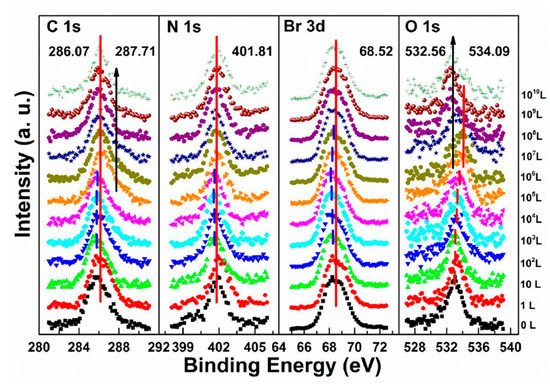
Figure 9. Evolutions of C 1s, N 1s, Br 3d, and O 1s XPS spectra of cleaved MAPbBr3 single crystal under O2 exposures. From Ref. [38] with permission.
By comparing the metallic Pb ratios from the three atmospheres, it can be found that no matter when the degradations started and how long the exposures were, the ratio of the metallic Pb always saturated at 10%. This may be because that the perovskite surface was covered by the 10% metallic Pb layer which prevented it from further decomposition. It has been reported that MAPbBr3 single crystal has better stability and can be stored in air for eight months [91,92,93]. In addition, oxygen exposure could enhance photoluminescence (PL) performance of the MAPbBr3 single crystal [94].
3.4. Water Exposure on MAPbBr3 Single Crystal
Similar to the perovskite thin film, perovskite SC may also vulnerable to moisture. Figure 10 shows the evolution of five major elements and the VB region. The whole exposure process can also be divided into two stages.
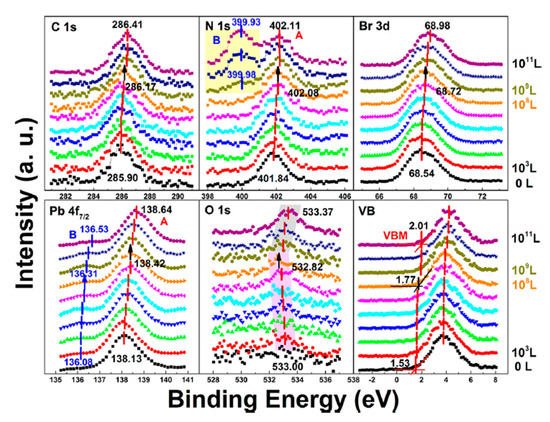
Figure 10. Evolution of C 1s, N 1s, Br 3d, Pb 4f7/2, O 1s, and the VB region of cleaved MAPbBr3 single crystal under water exposure from 0 to 1011 L. From Ref. [38] with permission.
In stage one, there was a rigid shift of ∼0.24 eV to the higher BE direction for carbon, nitrogen, bromine, and lead peaks before 108 L. The rigid shift indicates that water worked as an n-dopant, causing the Fermi level of the crystal to move from 1.53 eV to 1.77 eV. The metallic Pb peak appeared at ∼136.08 eV from the second scan which was caused by X-ray degradation. There is no obvious signal for oxygen from the freshly cleaved sample and the oxygen peak started to show up at ∼533.00 eV from 103 L, which can be attributed to water. Then it moved toward the lower BE direction with a maximum of ∼0.18 eV at 108 L. This displacement in opposite direction indicates that there was no chemical reaction between water and the SC during this stage.
The ratio is C/N/Pb/Br/O = 1.53:1.10:1:2.92: for the freshly cleaved MAPbBr3 SC. The same 10% ratio of Pb from perovskite converted into metallic Pb at the end of the first stage (108 L of H2O), as the net change under 7 h exposure of X-ray. However, the ratios of C 1s, N 1s, and Br 3d5/2 dropped by ∼30, 37, and 27%, respectively, and doped water caused a 14% increase in O 1s. In addition to Equation (5)Similar with X-ray degradation, the following mechanism is proposed for step one in water exposure [49].

CH3NH3Br −→−−−−−H2O+ X−ray CH3NH2(g) + HBr↑
There is ~30% MABr from the diffusion and the X-ray degradation further decomposed into CH3NH2 and HBr gases under X-ray with 14% doped water and then escaped the sample surface.
In the second stage, MAPbBr3 SC started to react with water from 109 L as two noticeable changes are shown in Figure 10. First, the O 1s quickly moved to the higher BE direction by ∼0.55 eV, which was the same for the other major peaks but opposite from that before 108 L. The oxygen peak at ∼533.37 eV (1011 L) may come from hydroxide. C 1s, Br 3d5/2, two Pb peaks, and VBM all shifted ∼0.24 eV to the higher BE during the period. Second, there was a second nitrogen peak (N 1s-B) showed up at ∼399.98 eV, which may be caused by NH4+ formed by the reaction of NH3 and H2O. It slightly shifted ∼0.05 eV to the lower BE direction, while perovskite nitrogen peak N 1s-A kept moving to the higher BE until achieving ∼402.11 eV at 1011 L. These results strongly demonstrate that water was a key factor causing decomposition of perovskite SC in the second step. After the exposure, Fermi level was moved to 0.29 eV, as the bandgap is 2.3 eV for the MAPbBr3 SC, which indicates a very n-type doping.
Metallic Pb increased 17% while the saturate ratio is only 10% under the same X-ray exposure condition. The extra metallic Pb may attribute to X-ray degradation of PbBr2, which is from MAPbBr3 and water reaction. After 1010 L, carbon increased ∼40%, while nitrogen and bromine decreased ∼39 and 32%, respectively, exposure level. Therefore, the following reactions were proposed in stage two [49].

CH3NH3PbBr3 −→H2O (−CH2−) + PbBr2 + NH3↑ + HBr↑
PbBr2 −→−−X−ray Pb + Br2↑
2Pb + 2H2O + O2 → 2Pb(OH)2⏐↓
This degradation mechanism is very similar to Equwater degradation (2). of the MAPbI3 thin films. About 35% perovskite was decomposed into HBr and NH3 gases by water in UHV. Partial ammonia was absorbed by water, while PbBr2 was further decomposed into metallic Pb and Br2. From 1010 L, white precipitate Pb(OH)2 was formed by the reaction of metallic Pb, water and the residual oxygen in the chamber. Bulk crystal could be intact with some water molecules and reversible photoelectrical properties [94]. However, PL confirmed the doping of the H2O molecules, thus leading to the lattice distortion-induced reconstruction of the SC [95].
3.5. Light Exposure on MAPbBr3 Single Crystal
The stability of MAPbBr3 SC under light illumination was investigated with a blue laser, which has a wavelength of 408 nm and intensity is ~7 times the AM 1.5 irradiation. The exposed spot received a total light exposure time of 44 h. Strong chemical decomposition was observed with XPS after the light exposure. It has been reported that structural changes in the perovskite lattice were observed under illumination, which is related to the light-induced ion migration and associated defect passivation [96]. Anaya et al. reported that by combining in situ PL and XPS analysis, they found the formation of a negatively charged layer of adsorbed anionic oxygen species on the surface which could drive halide anions away from the illuminated areas toward the bulk of the material [97].
A new metallic Pb spectral component started to show up in the Pb core level spectra as shown in Figure 11. The original perovskite Pb 4f7/2 and 4f5/2 peaks were located at 138.27 and 143.17 eV, respectively. A new metallic Pb feature started to appear for each Pb core level after light exposure. Both the metallic and the perovskite Pb peaks moved to a lower BE which occurred within the first hour of light exposure. C, N, and Br peaks also had a similar initial BE movement as shown in Figure 12. This rigid shift is corresponding to the Fermi level movement within the bandgap, which suggests the perovskite was p doped.
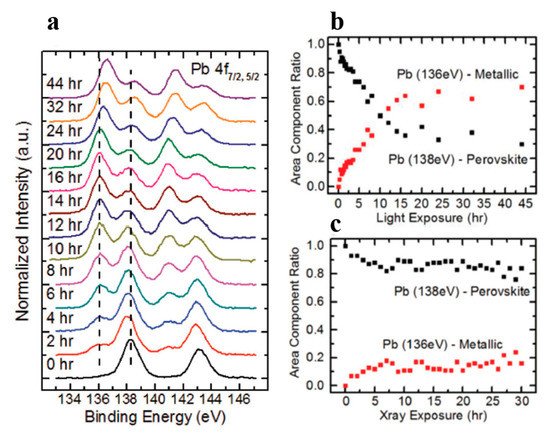
Figure 11. (a) A stack plot of the Pb 4f7/2 and 4f5/2 core levels of cleaved MAPbBr3 single crystal with increasing light exposure. (b,c) The ratio of perovskite Pb to metallic Pb under light exposure and X-ray exposure, respectively. From Ref. [62] with permission.
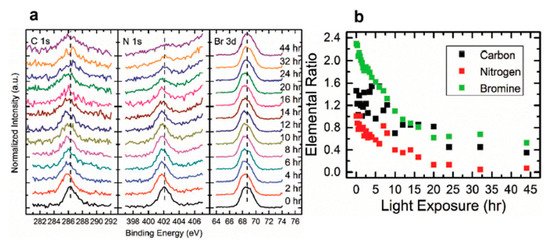
Figure 12. (a) A stack plot of the C 1s, N 1s, Br 3d5/2 core levels of cleaved MAPbBr3 single crystal with increasing light exposure. (b) Elemental ratio change for C, N, and Br under light exposure. From Ref. [62] with permission.
After the initial BE shift, all peaks started to gradually shift back to higher BEs and the metallic Pb peaks stopped at ~136.6 and 141.4 eV for the 4f7/2 and 4f5/2 core levels, respectively. As the light exposure progressed, the metallic Pb component continued to gain in intensity and finally dominated the overall Pb core level after ~10 h of exposure. When the whole 44 h exposure was finished, ~70% of Pb signal came from the metallic Pb, while only ~30% signal was the perovskite Pb.
For all other elements, there were no new features observed during the exposure, which suggests that they did not change their chemical states. However, the surface saw noticeable concentration losses in C, N, and Br. In Figure 12, at ~10 h of light exposure, C, N, and Br lost about half of their initial concentration, and ~50% of the perovskite Pb was degraded into metallic Pb. Based on these observations, the following mechanism was proposed to explain the degradation process [98].


CH3NH3PbBr3 −→−Light CH3NH3Br + PbBr2
PbBr2 −→−Light Pb + Br2
The perovskite SC first degraded into MABr and PbBr2, then PbBr2 further degrade into metallic Pb and Br2 under light exposure. C, N, and Br were decomposed as volatile species, then escape the sample surface similar to simple outgassing. Interestingly, a similar degradation process was also observed under E-Beam Irradiation [99].