The NF-Y gene family is a highly conserved set of transcription factors. The functional transcription factor complex is made up of a trimer between NF-YA, NF-YB, and NF-YC proteins. While mammals typically have one gene for each subunit, plants often have multigene families for each subunit which contributes to a wide variety of combinations and functions. Soybean plants with an overexpression of a particular NF-YC isoform
GmNF-YC4-2
(Glyma.04g196200) in soybean cultivar Williams 82, had a lower amount of starch in its leaves, a higher amount of protein in its seeds, and increased broad disease resistance for bacterial, viral, and fungal infections in the field, similar to the effects of overexpression of its isoform
GmNF-YC4-1
(Glyma.06g169600). Interestingly,
GmNF-YC4-2-OE
(overexpression) plants also filled pods and senesced earlier, a novel trait not found in
GmNF-YC4-1-OE
plants. No yield difference was observed in
GmNF-YC4-2-OE
compared with the wild-type control. Sequence alignment of GmNF-YC4-2, GmNF-YC4-1 and AtNF-YC1 indicated that faster maturation may be a result of minor sequence differences in the terminal ends of the protein compared to the closely related isoforms.
- NF-YC4 transcription factor
- early maturation
- disease resistance
- seed protein
1. Introduction
Effectively feeding an ever-growing global population begins with nutrient rich, resilient crops. Over one in seven people in the world do not have access to a sufficient protein supply in their diets [1]. In addition, the majority of the population relies on a plant-based diet for their protein uptake [2]. As most livestock also requires plant-based diets for their protein, the dietary needs of the world can mostly be attributed to plants. Thus, generating plants with increased protein content can help efficiently feed the global population.
Crop plants such as
Glycine max (soybean) are grown in a wide range of environments and face a multitude of both biotic and abiotic challenges. While plants have evolved a complex immune system [3,4,5,6,7], crops across the world suffer yield loss due to diseases [8,9,10,11] and environmental factors [12,13]. Many genetic engineering methods have been used to combat these factors [8,14]. However, many of these induce constitutively active defense responses that can in turn negatively affect the growth and yield of the plant [15,16]. For example, silencing mitogen-activated protein kinase
(soybean) are grown in a wide range of environments and face a multitude of both biotic and abiotic challenges. While plants have evolved a complex immune system [3][4][5][6][7], crops across the world suffer yield loss due to diseases [8][9][10][11] and environmental factors [12][13]. Many genetic engineering methods have been used to combat these factors [8][14]. However, many of these induce constitutively active defense responses that can in turn negatively affect the growth and yield of the plant [15][16]. For example, silencing mitogen-activated protein kinase
MAPK4
in soybean plants severely stunts the plants when providing a resistance to pathogens [17]. Therefore, genetic engineered resistance that allows for an enhanced pathogen resistance while avoiding major growth defects is important.
While plants have evolved a complex immune system to deal with minor biotic and abiotic perturbations, they have also evolved a more drastic mechanism to deal with seasonal environmental changes. As plants are sessile organisms, rather than maintaining full function throughout a harsh season, they instead undergo programmed cell death called senescence [18,19,20]. This process allows for nutrient re-localization, such as nitrogen remobilization from leaves to seeds, and it is important for seed quality and nitrogen use efficiency [21,22,23,24]. With the looming threat of climate change and the growing global population, the challenge set before us is to improve crop nitrogen use efficiency in order to allow for less reliance on nitrate fertilizers [22]. It has been speculated that stimulating autophagy during stress response could improve crops’ resistance to the effects of climate change [22].
While plants have evolved a complex immune system to deal with minor biotic and abiotic perturbations, they have also evolved a more drastic mechanism to deal with seasonal environmental changes. As plants are sessile organisms, rather than maintaining full function throughout a harsh season, they instead undergo programmed cell death called senescence [18][19][20]. This process allows for nutrient re-localization, such as nitrogen remobilization from leaves to seeds, and it is important for seed quality and nitrogen use efficiency [21][22][23][24]. With the looming threat of climate change and the growing global population, the challenge set before us is to improve crop nitrogen use efficiency in order to allow for less reliance on nitrate fertilizers [22]. It has been speculated that stimulating autophagy during stress response could improve crops’ resistance to the effects of climate change [22].
2. GmNF-YC4-2-OE Plants Have High Transcript Levels of GmNF-YC4-2 in Leaves and Seeds
To confirm the efficacy of our OE vectors, the transcript level of
GmNF-YC4-2was assessed in leaves and seeds. The transcript level of
GmNF-YC4-2in leaves of
GmNF-YC4-2-OElines ranged from 12.3-16.4 average relative quantification (RQ) compared to wild type (WT) (
Figure 1A). That magnitude was increased in seeds where the average RQ ranged from 31.0-69.3 (
Figure 1A). The validity of the 35S driven OE vectors used in this study was assessed by GUS (β-glucuronidase) staining of 35S-QQS-GUS constructs in soybean. Moderate to high levels of GUS signal were present in leaves, flowers, pods and seeds, indicating 35S activity in these tissues (
Figure 1B–D) and confirming previous studies demonstrating no tissue specificity for the CaMV 35S promoter [30].B–D) and confirming previous studies demonstrating no tissue specificity for the CaMV 35S promoter [25].
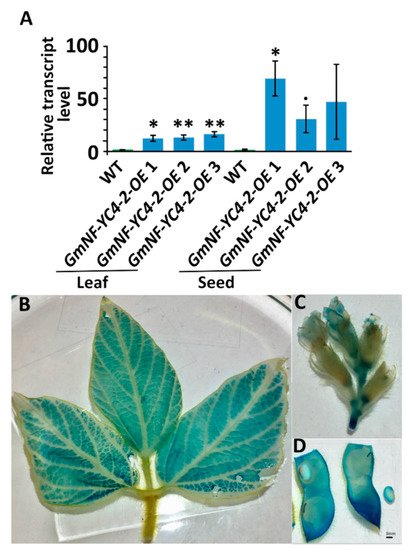
transcript level was increased in leaf and seed tissue in
plants. (
) Quantitative reverse transcription PCR of
transcript level. GUS staining of 35S-QQS-GUS soybean plants shows 35S drove expression of GUS in leaves (
), flowers (
), and pods/seeds (
). All data in bar chart shows mean ± SE (Standard Error),
= 3. A two-tailed Student’s t-test was used to compare
and WT, **
< 0.01; *
< 0.05;
< 0.1.
3. GmNF-YC4-2 Is Involved in Regulation of Plant Composition
Similar to previous studies in
GmNF-YC4-1-OE plants [27],plants [26],
GmNF-YC4-2-OEplants also showed altered leaf and seed composition.
GmNF-YC4-2-OEplants had a decrease in leaf starch (
Figure 2A,B,
p< 0.05 for
GmNF-YC4-2-OE1,2 and
p< 0.1 for
GmNF-YC4-2-OE3) and leaf protein content was increased (
Figure 2C,
p< 0.01 for
GmNF-YC4-2-OE1 and
p< 0.05 for
GmNF-YC4-2-OE2,3).
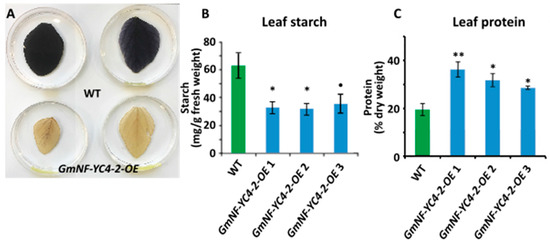
Leaf starch and protein composition was altered in
plants. Leaf starch content in
plants was decreased when compared to WT, indicated by starch staining (
) and quantification (
). (
) Leaf protein content was increased in
plants. All data in bar charts show mean ± SE,
= 3 or 4 (in
). A two-tailed Student’s t-test was used to compare
and WT, **
< 0.01; *
< 0.05;
< 0.1.
Metabolic analysis on
GmNF-YC4-2-OEseeds was performed to determine if this metabolic effect in leaf tissue was unique. Near Infrared Spectroscopy (NIRS) analysis on seeds showed a significant increase in protein levels and decreased oil levels in three independent
GmNF-YC4-2-OElines compared to WT plants (
Figure 3A,
p< 0.01 for all three lines). Chemical analysis on crushed seeds was performed to test levels of ash, crude fat, crude fiber, crude protein, and total sugars. Of these metabolites, ash (
p< 0.01, < 0.1, and < 0.05, respectively), crude fat (
p< 0.01 for all), and crude fiber (
p< 0.05 for all) showed a significant decrease in OE lines, while protein (
p< 0.01 for all) and total sugar (
p< 0.05 for
GmNF-YC4-2-OE1 and 3) levels were increased (
Figure 3B). In addition,
GmNF-YC4-2-OEplants had an even higher seed protein content, approximately 5–10%, when compared to
GmNF-YC4-1-OEplants (
Figure S1,
p< 0.01). Interestingly, there was no significant difference in seed yield per plant between WT and OE plants (
Figure 3C). Therefore,
GmNF-YC4-2-OEplants display similar metabolic alterations in both leaf and seed tissue.
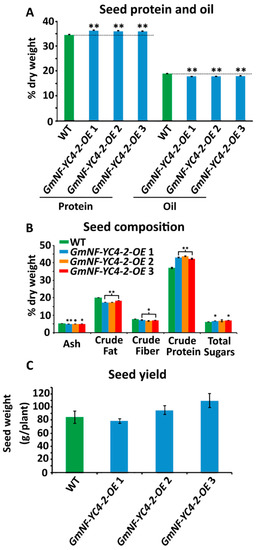
Seed composition was altered in
plants. (
) Seed protein content was significantly increased in all lines while oil content was significantly decreased. Composition was analyzed by near infrared spectroscopy (NIRS). (
) Ash content, crude fat and crude fiber were decreased compared to WT, while crude protein and total sugars were increased. Composition was analyzed by chemical methods. (
) No significant difference in seed yield was found. All data in bar charts show mean ± SE, (in
)
= 235 (WT), 125 (
1), 155 (
2), 81 (
3), (in
)
= 3, (in
)
= 20 (WT), 24 (
1), 17 (
2), and 26 (
3). A two-tailed Student’s t-test was used to compare
and WT; **
< 0.01, *
< 0.05,
< 0.1.
4. GmNF-YC4-2 Confers Broad Disease Resistance
To test if
GmNF-YC4-2-OEcould affect interactions between soybean and pathogens, WT and transgenic plants were inoculated with a virus, bacterium, and fungus.
GmNF-YC4-2-OEplants inoculated with a recombinant
Bean pod mottle virus(BPMV) expressing green fluorescent protein (GFP) had reduced numbers of green fluorescent infection foci when compared to WT plants at both 11 and 13 days post inoculation (DPI) (
Figure 4A,
p< 0.01). The
GmNF-YC4-2-OEplants were also infected with
Pseudomonas syringaepv.
glycineaRace 4 (
PsgR4), the cause of bacterial blight. The growth of PsgR4 was decreased by 96.3%, 96.8%, and 92.8% in
GmNF-YC4-2-OE 1,
GmNF-YC4-2-OE 2, and
GmNF-YC4-2-OE 3plants compared to Williams 82 control plants (
Figure 4B, all
p< 0.01).
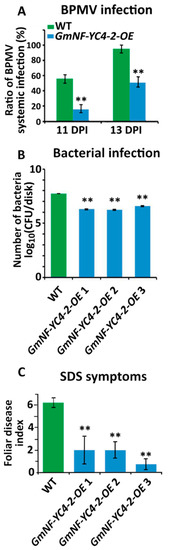
plants showed enhanced disease resistance. (
) The BPMV viral foci rate was decreased at both 11 and 13 DPI in
plants compared to WT. (
) Growth of
R4 bacteria was reduced in
plants. CFU, colony forming units. (
)
plants also showed enhanced resistance to SDS. All data in bar charts show mean ± SE, (in
and
)
= 3, (in
)
= 5 (WT,
1,2), 6 (
3). A two-tailed Student’s t-test was used to compare
and WT; **
< 0.01.
The plants were planted in the field and inoculated with the fungus that leads to sudden death syndrome (SDS)-
Fusarium virguliforme. OE plants also displayed less severe symptoms of SDS in a field inoculation trial with a 67.8%, 67.8%, and 88.1% decrease in foliar disease index for
GmNF-YC4-2-OE1,
GmNF-YC4-2-OE2, and
GmNF-YC4-2-OE3 respectively (
Figure 4C, all
p< 0.01). These data show that overexpression of
GmNF-YC4-2in soybean plants confers enhanced disease resistance to the viral, bacterial, and fungal pathogens tested along with the altered leaf and seed composition.
5. GmNF-YC4-2 Regulates Plant Maturation
GmNF-YC4-2-OE
plants displayed several aspects of expedited growth. In the field,
GmNF-YC4-2-OE
plants showed significantly faster pod development compared to the WT plants (
A). OE plants of all three lines also showed earlier senescence compared to WT (
B). As the date of flowering was similar for both WT and OE (
C), the faster maturation was seen mainly in the transition from flowering stage to pod development.
GmNF-YC4-2-OE
plants contained more pods than WT at 73 Days After Planting (DAP), while WT contained more flowers (
D, flowers:
p
< 0.01 for
GmNF-YC4-2-OE
2, <0.05 for
GmNF-YC4-2-OE
3; pods:
p
< 0.01
GmNF-YC4-2-OE
1 and
GmNF-YC4-2-OE
3, < 0.1 for
GmNF-YC4-2-OE
2). Thus,
GmNF-YC4-2-OE
plants transited quickly from flowering to pod development and this likely impacted senescence independent of flowering time. OE plants fully matured around two weeks prior to WT plants.
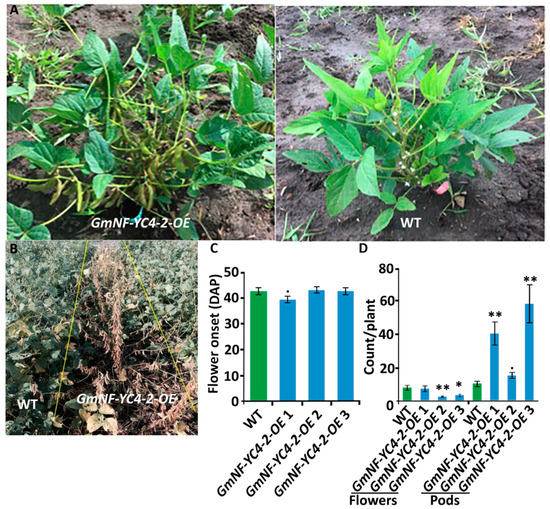
Figure 5.
GmNF-YC4-2-OE
plants transited from flowering stage to podding stage faster than WT plants. (
A
)
GmNF-YC4-2-OE
plants showed seeding pods while WT plants were still in the flowering stage at 77 DAP. (
B
)
GmNF-YC4-2-OE
plants senesced earlier than WT plants at 96 DAP. (
C
) The onset of flowering (DAP of first observed open flower) was slightly faster for
GmNF-YC4-2-OE
1 plants but similar in
GmNF-YC4-2-OE
2 and 3 plants compared to WT. (
D
) At 73 DAP, pod development for
GmNF-YC4-2-OE
plants was advanced compared to WT plants while the number of flowers was decreased. All data in bar charts show mean ± SE, (in
C
)
n
= 24 (WT), 46 (
GmNF-YC4-2-OE
1), 39 (
GmNF-YC4-2-OE
2), 26 (
GmNF-YC4-2-OE
3); (in
D
) 15 (WT), 9 (
GmNF-YC4-2-OE
1), 19 (
GmNF-YC4-2-OE
2), 11 (
GmNF-YC4-2-OE
3). A two-tailed Students t-test was used to compare
GmNF-YC4-2-OE
and WT; **
p
< 0.01, *
p
< 0.05,
•
p
< 0.1.
References
- Godfray, H.C.; Beddington, J.R.; Crute, I.R.; Haddad, L.; Lawrence, D.; Muir, J.F.; Pretty, J.; Robinson, S.; Thomas, S.M.; Toulmin, C. Food security: The challenge of feeding 9 billion people. Science 2010, 327, 812–818.
- Pimentel, D.; Pimentel, M. Sustainability of meat-based and plant-based diets and the environment. Am. J. Clin. Nutr. 2003, 78, 660S–663S.
- Jones, J.D.G.; Dangl, J.L. The plant immune system. Nature 2006, 444, 323–329.
- Katagiri, F.; Tsuda, K. Understanding the Plant Immune System. Mol. Plant-Microbe Interact. 2010, 23, 1531–1536.
- Nishimura, M.T.; Dangl, J.L. Arabidopsis and the plant immune system. Plant J. 2010, 61, 1053–1066.
- Han, G.-Z. Origin and evolution of the plant immune system. New Phytol. 2019, 222, 70–83.
- Nobori, T.; Tsuda, K. The plant immune system in heterogeneous environments. Curr. Opin. Plant Biol. 2019, 50, 58–66.
- Wulff, B.B.H.; Horvath, D.M.; Ward, E.R. Improving immunity in crops: New tactics in an old game. Curr. Opin. Plant Biol. 2011, 14, 468–476.
- Mueller, D.S.; Wise, K.A.; Sisson, A.J.; Allen, T.W.; Bergstrom, G.C.; Bosley, D.B.; Bradley, C.A.; Broders, K.D.; Byamukama, E.; Chilvers, M.I.; et al. Corn Yield Loss Estimates Due to Diseases in the United States and Ontario, Canada from 2012 to 2015. Plant Health Prog. 2016, 17, 211–222.
- Peltier, A.J.; Bradley, C.A.; Chilvers, M.I.; Malvick, D.K.; Mueller, D.S.; Wise, K.A.; Esker, P.D. Biology, Yield loss and Control of Sclerotinia Stem Rot of Soybean. J. Integr. Pest Manag. 2012, 3, B1–B7.
- Wrather, A.; Shannon, G.; Balardin, R.; Carregal, L.; Escobar, R.; Gupta, G.K.; Ma, Z.; Morel, W.; Ploper, D.; Tenuta, A. Effect of Diseases on Soybean Yield in the Top Eight Producing Countries in 2006. Plant Health Prog. 2010, 11, 29.
- Raza, A.; Razzaq, A.; Mehmood, S.S.; Zou, X.; Zhang, X.; Lv, Y.; Xu, J. Impact of Climate Change on Crops Adaptation and Strategies to Tackle Its Outcome: A Review. Plants 2019, 8, 34.
- Adhikari, U.; Nejadhashemi, A.P.; Woznicki, S.A. Climate change and eastern Africa: A review of impact on major crops. Food Energy Secur. 2015, 4, 110–132.
- Wally, O.; Punja, Z.K. Genetic engineering for increasing fungal and bacterial disease resistance in crop plants. GM Crop. 2010, 1, 199–206.
- Bolton, M.D. Primary Metabolism and Plant Defense—Fuel for the Fire. Mol. Plant-Microbe Interact. 2009, 22, 487–497.
- Heil, M. The Ecological Concept of Costs of Induced Systemic Resistance (ISR). Eur. J. Plant Pathol. 2001, 107, 137–146.
- Liu, J.-Z.; Horstman, H.D.; Braun, E.; Graham, M.A.; Zhang, C.; Navarre, D.; Qiu, W.-L.; Lee, Y.; Nettleton, D.; Hill, J.H.; et al. Soybean Homologs of MPK4 Negatively Regulate Defense Responses and Positively Regulate Growth and Development. Plant Physiol. 2011, 157, 1363–1378.
- Lim, P.O.; Kim, H.J.; Nam, H.G. Leaf Senescence. Annu. Rev. Plant Biol. 2007, 58, 115–136.
- Humbeck, K. Senescence in Plants. J. Plant Growth Regul. 2014, 33, 1–3.
- Woo, H.R.; Masclaux-Daubresse, C.; Lim, P.O. Plant senescence: How plants know when and how to die. J. Exp. Bot. 2018, 69, 715–718.
- Guiboileau, A.; Avila-Ospina, L.; Yoshimoto, K.; Soulay, F.; Azzopardi, M.; Marmagne, A.; Lothier, J.; Masclaux-Daubresse, C. Physiological and metabolic consequences of autophagy deficiency for the management of nitrogen and protein resources in Arabidopsis leaves depending on nitrate availability. New Phytol. 2013, 199, 683–694.
- Havé, M.; Marmagne, A.; Chardon, F.; Masclaux-Daubresse, C. Nitrogen remobilization during leaf senescence: Lessons from Arabidopsis to crops. J. Exp. Bot. 2016, 68, 2513–2529.
- Hörtensteiner, S.; Feller, U. Nitrogen metabolism and remobilization during senescence. J. Exp. Bot. 2002, 53, 927–937.
- Liu, J.; Wu, Y.H.; Yang, J.J.; Liu, Y.D.; Shen, F.F. Protein degradation and nitrogen remobilization during leaf senescence. J. Plant Biol. 2008, 51, 11–19.
- Yang, N.-S.; Christou, P. Cell type specific expression of a CaMV 35S-GUS gene in transgenic soybean plants. Dev. Genet. 1990, 11, 289–293.
- Qi, M.; Zheng, W.; Zhao, X.; Hohenstein, J.D.; Kandel, Y.; O’Conner, S.; Wang, Y.; Du, C.; Nettleton, D.; MacIntosh, G.C.; et al. QQS orphan gene and its interactor NF-YC4 reduce susceptibility to pathogens and pests. Plant Biotechnol. J. 2019, 17, 252–263.