Infrastructure is a fundamental sector for sustainable development and Earth observation has great potentials for sustainable infrastructure development (SID). However, implementations of the timely, large–scale and multi–source Earth observation are still limited in satisfying the huge global requirements of SID. This review demonstrates that Earth observation has great potentials for sustainable infrastructure development. EOSI can benefit about 85% of infrastructure influenced SDGs and 61% of all SDGs, but Earth observation has been implemented in only 15% of infrastructure influenced SDG targets, and 70% of the infrastructure influenced targets that can be directly or indirectly derived from Earth observation data have not been included in current SDG indicators.
- sustainable infrastructure
- earth observation
- remote sensing
- earth big data
- Sustainable Development Goals (SDGs)
- SDG targets
- bibliographic analysis
Note: The following contents are extract from your paper. The entry will be online only after author check and submit it.
1. Introduction
Sustainable infrastructure is one of the key paths, from research, policies, actions to impacts, for achieving the Sustainable Development Goals (SDGs) of United Nations [1][2][3][4][5][6][1,2,3,4,5,6]. Infrastructure can impact about 72% of the 169 targets of 17 SDGs [1]. The investment of large–scale infrastructure, especially for developing countries, has been a priority for socio–economic development [4]. However, rapid infrastructure construction usually leads to different degrees of environmental and ecological issues, such as grassland, forest and wetland degradation [7][8][9][7,8,9], air, water and soil pollution [10][11][10,11], biodiversity loss [12] and temperature rise [13]. Sustainable infrastructure aims at developing methods and solutions for resilient and sustainable energy, water, solid waste, transport and digital communication facilities [1]. Therefore, sustainable infrastructure development (SID) is the key to address the infrastructure related environmental and ecological problems.Emerging technologies become an increasingly critical support of current and future SID [14][15][16][14,15,16]. It is estimated that about 70% of SDG targets can be supported by technology innovation [15]. The recent advanced technologies for SID generally include following categories. First, clean and low–carbon technologies have been widely applied in industries to decrease emission intensive operations and reduce emissions during infrastructure construction and maintenance [17]. In addition, the development of artificial intelligence (AI) provides effective solutions and opportunities for SID [18][19][18,19]. More importantly, AI is helpful for the implementations of relevant technologies in SID, such as smart cities, internet of things, big data, cloud computing, BIM-GIS (building information modeling and geographical information science) integration, machine learning and deep learning [20][21][22][23][24][25][26][20,21,22,23,24,25,26]. Studies have also demonstrated that AI may inhibit the achievement of 35% of SDG targets [18]. Third, blockchain can revolutionize knowledge and value of the whole life cycle of SID [22][27][22,27]. Blockchain technology is characterized in transparency, decentralization, openness, interconnection and sharing for more reliable and efficient life cycle assessment of SID [16][27][28][16,27,28]. The last but not least category of technologies for SID is the Earth observation technology, such as remote sensing [29][30][29,30], light detection and ranging (LiDAR) [31][32][31,32], unmanned aerial vehicle (UAV) [33] and precise in–situ or ground observations [34][35][34,35]. In recent a few years, Earth observation has been increasingly applied in quantifying impacts of infrastructure on environment and ecosystems [30][32][30,32], due to its advantages in the timely and large–scale eco–environmental assessment [36][37][38][39][36,37,38,39]. In this study, the Earth observation technology for supporting SID will be systematically reviewed and analyzed.There are still gaps and challenges in the Earth observation for sustainable infrastructure (EOSI). First, explicit goals of EOSI are increasingly required to guide decision making and actions. A key question is to convert requirements of SID to Earth observation based solutions to satisfy the requirements. Next, there are huge gaps between the global requirements of SID and limited Earth observation applications for the infrastructure sector. Sustainable infrastructure consists of diverse sectors, but the implementations of Earth observation in different sectors are unequal. For instance, topics of current EOSI studies primarily include green infrastructure [34], ecological assessment of infrastructure and surrounding environment [40][41][40,41], and developing sustainability indicators for infrastructure [42][43][42,43], but they are limited in solid waste and digital communication facilities. Finally, technology integration is a key difficulty for the implementation, leading to the lack of benchmark studies, due to the practical challenges in the interdisciplinary studies [44][45][44,45]. Thus, it is desired to develop innovative methodology and benchmark cases for reasonable implementations of technology integration in SID.
2. Concepts of Sustainable Infrastructure
Sustainable infrastructure can be described as infrastructure that is designed, constructed and maintained with socio–economic and environmental considerations and that can perpetuate and enhance the environment [46]. The objective of SID is to develop methods and solutions for resilient and sustainable infrastructure and facilities [1]. From the socio–economic perspective, sustainable infrastructure has benefits for adding value for infrastructure investment, finance and business [47][48][47,48], and for triggering the technology innovation [14][32][14,32] and the implementation of renewable energy [49]. Meanwhile, sustainable infrastructure should be delivered in compliance with labor standards and human rights [46][50][46,50]. From the eco–environmental perspective, the primary task of sustainable infrastructure is to decrease carbon and pollutant emissions during the whole life cycle of design, construction, maintenance and demolition [51][52][53][51,52,53]. More importantly, sustainable infrastructure should take an active role in protecting and enhancing ecosystems [54] and be resilient to global climate change [13].
3. Trends of Earth Observation for Sustainable Infrastructure (EOSI)
3.1. Data and Methods
The literature review of EOSI aims at describing application trends of previous studies and identifying research gaps between the requirements of SID and potentials of Earth observation. The data was collected from Web of Science using following search criteria:
- Topic (including title, abstract, and keywords): ((sustainab* OR green) AND infrastructure AND (“remote sensing” OR “Earth observation”))
- Publication Years: Before 2020 (inclusive)
- Research Areas: Areas in environment, geosiences, engineering, computer sciences and mathematics.
- Document types: Article and review
- Language: English
The analysis of literature in this part is presented from the perspective of the whole infrastructure systems, instead of sectors within infrastructure systems. Therefore, studies for individual sectors and specific cases of infrastructure, such as energy, transport, and water infrastructure, are not included in this analysis. Earth observation for individual sectors of infrastructure and typical cases are analyzed in Section 4 and Section 5, respectively.A bibliometric analysis was applied to analyze research trends of EOSI in terms of publications, references, citations and information of literature. The bibliometric analysis is a quantitative method to describe and assess academic literature according to the information of bibliographies [55]. In this study, research trends and topics of EOSI were identified from the conceptual structure map regarding keywords and keyword co-occurrences network. The literature analysis was performed using R “bibliometrix” package [55]. The “bibliometrix” package is a powerful tool for statistical analysis and visualization of the bibliometric analysis.
3.2. Analysis
According to the search criteria, 271 academic publications have been collected. The publication years range from 1996 to 2020, where 74% of the research were published after 2015 (Figure 1). The rapid growth trend of publications demonstrates that studies of EOSI are attracting increasing research attentions in recent a few years and in the future, and they have great potentials for research and practice. In addition, in the publications, the top five most frequent keywords are “remote sensing”, “GIS”, “urbanization”, “green infrastructure” and “Earth observation”, which appear in 79, 23, 21, 18 and 14 publications, respectively. This means the collected publications are consistent with the topic and objective of the literature review. Top three areas in the Web of Science Categories are environmental sciences, remote sensing, and environmental studies. The total number of publications in the three areas accounts for 81% of all collected publications. Top ten countries of corresponding authors in terms of the number of publications include China (40), USA (40), India (22), Germany (20), Italy (16), United Kingdom (13), Australia (12), Turkey (11), Canada (7) and Spain (7).
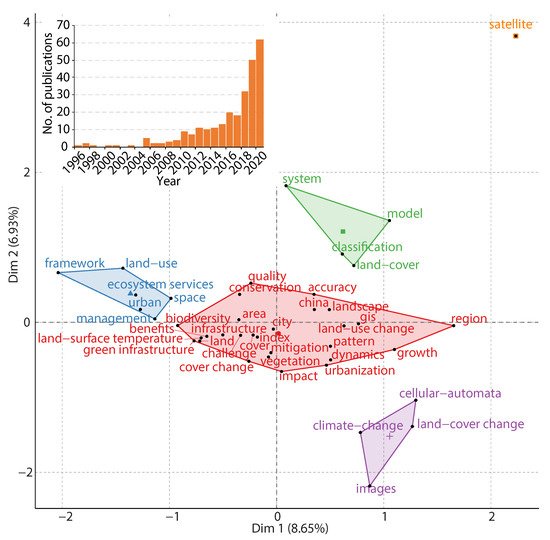
Figure 1. Conceptual structure map of EOSI.

Figure 1 shows a conceptual structure map of EOSI in terms of keywords in literature. The two dimensions of the map demonstrate the highest variance for visualizing the average location of articles related to the keywords [55]. In this conceptual structure map, the dimensions 1 and 2 explain 8.7% and 6.9% of variances of the keywords, respectively. The location where dimension value is 0 indicates the midpoint of all articles of EOSI studies [55]. For instance, the keyword “city” is close to the midpoint, meaning that a large number of articles of EOSI highlight city studies. The conceptual structure map includes five groups of primary concepts related to EOSI. The largest group (red) of concepts located at the center of the map includes terms related to infrastructure (e.g., infrastructure and green infrastructure), ecosystems (e.g., biodiversity, landscape, conservation, and vegetation), urbanization (e.g., city, growth and urbanization), Earth observation (e.g., land surface temperature, land, land cover change, and land use change) and geospatial models (e.g., GIS and accuracy). This group of concepts demonstrates a general approach to address EOSI issues: using Earth observation data and geospatial models to assess contributions of infrastructure to urbanization and infrastructure impacts on ecosystems. Another four groups of concepts are urban space management and ecosystem services (blue), land cover modeling (green), climate change and land cover change investigation (purple), and satellite data (orange). These concepts present the essential technical and management topics in EOSI.Figure 2 shows the keyword co–occurrences network of EOSI in a word cloud form, where the top 200 keywords according to frequency and their links are visualized. In the figure, top 20 keywords are marked with black color and other keywords are shown in gray color. The sizes of circles show the frequency of keywords, and the widths of lines and distances of circles illustrate the closeness of keywords, which were identified from co–citation information of publications. According to the distributions and links of keywords, the network includes five primary clusters. The first cluster primarily consists of keywords related to the “city and infrastructure” (blue), such as city, infrastructure, vegetation, classification, land surface temperature, heat island, health, mitigation, etc. The second cluster characterizes “ecosystems” (purple) with keywords ecosystem services, biodiversity, management, forest, land, habitat, sustainability, parks, etc. The third cluster presents the relationships of “climate, land cover, GIS, urbanization and impacts” (red), which includes seven of the top 20 keywords: impact, GIS, dynamics, pattern, climate change, urbanization and land cover. The fourth cluster contains keywords related to “remote sensing and conservation” (orange), such as area, conservation, remote sensing data, water, etc. The last cluster primarily covers “modeling” (light red) related keywords: model, quality, index, methodology, MODIS, etc. The brief summaries of clusters are not absolutely consistent with keywords within clusters, since all clusters are interacted with each other through locations and links on the network. This phenomenon is identical with practical issues of EOSI that contain different combinations of topics, objectives, data and methods.
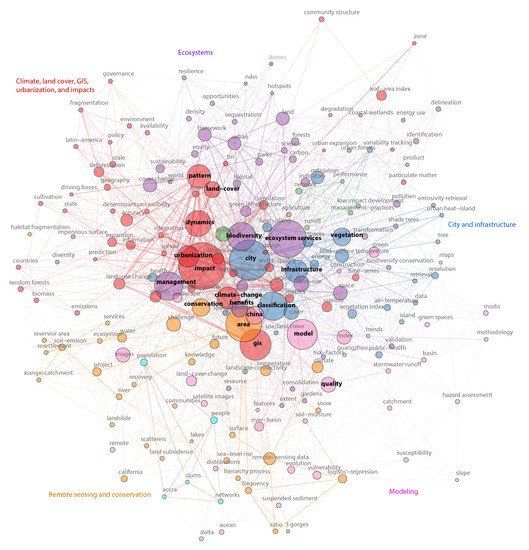
Figure 2. Keyword co–occurrences network of EOSI.In addition to above five primary clusters, the network also includes two small clusters.
One cluster is the keywords with green circles distributed between “city and infrastructure” and “ecosystems”. The keywords include system, network, runoff, low impact development, management practices and performance. This cluster shows a few studies that apply strategies and management practices to reduce impacts of infrastructure and urban development on ecosystems, especially hydrologic performance [56][57][58][56,57,58]. Another cluster is the keywords with light blue circles, such as populations, people and slums, located near the cluster of remote sensing and conservation. This cluster highlights the relationship between human activities and environment.In summary, the conceptual structure map and keyword co–occurrences network demonstrate the close associations of infrastructure, urban development, ecosystems, climate, Earth observation and GIS in EOSI. The interactions among the first three clusters reveal the trade–offs between the benefits of infrastructure to cities and urbanization, and the pressures on ecosystems and environment from infrastructure. In addition, it is common that Earth observation data and geospatial models are usually simultaneously utilized to address EOSI issues.
4. EOSI and Sustainable Development Goals (SDGs)
4.1. Concepts and Scope
The targets of SDGs are effective indicator tools for identifying interactions, benchmark studies and gaps of EOSI [59]. Sustainable infrastructure is directly or indirectly associated with about 72% (121/169) of the targets of SDGs [1]. Simultaneously, Earth observation can contribute large-scale and timely data for about 18% (30/231) indicators across the targets of SDGs, where 70% of the data have been available in the Global SDG Indicators Database [60][61][60,61].In this review, the relationship between EOSI and SDGs is analyzed by comparing each SDG target and previous Earth observation–based case studies. In the analysis, the relevant concepts and assumptions are presented. First, infrastructure is classified into five types according to the definition presented by [1], including energy, transport, water, solid waste and digital communications. The direct and indirect influences of infrastructure on SDG targets have been justified in [1]. Only the targets affected by infrastructure shown in [1] are assessed in this review.In addition, Earth observation data for indicators and targets of SDGs is classified into four categories according to their contributions to SDG targets, consisting of available, direct, indirect and irrelevant indicators. A direct relationship exists when EOSI can be used to calculate or directly contribute to relevant SDG targets. For instance, nighttime lights obtained through EO can be used to calculate economic indicators, thus a direct relationship is observed. On the other hand, an indirect relationship exists when EOSI data cannot do so. For example, EOSI can support the access of fishers to markets (SDG 14.b) by providing physical and virtual access through transport and digital communications, and support the development of effective, accountable, and transparent institutions (SDG 16.6) by assessing performance of public infrastructure, but it is not the predominant factor of these targets. Therefore, the classification of EOSI in terms of SDG targets is carried out according to following steps.
- If Earth observation data has been used in the Global SDG Indicators Database?
- –
- If “Yes”, the EOSI is an available indicator.
- –
- If “No”, are there any direct relationships between EOSI and SDG targets according to case studies in literature?
- ∗
- If “Yes”, the EOSI is a direct indicator that can be potentially used in SDG targets.
- ∗
- If “No”, are there any indirect relationships between EOSI and SDG targets according to case studies in literature?
- ·
- If “Yes”, the EOSI is an indirect indicator that can be potentially used to support achieving SDG targets.
- ·
- If “No”, the EOSI is an irrelevant indicator.
The available indicators are data of Earth observation that can exactly match the required indicators of SDGs [60] and have been used in the Global SDG Indicators Database [61]. Currently, at least 21 Earth observation based SDG indicators have been implemented in the SDG Indicators Database [60]. The direct indicators that can be potentially used in SDG targets are derived from Earth observation-based data products and models from case studies in literature, such as global raster data of population, economy, poverty and disease. A large number of data products are currently available at open data portals for direct applications and other data should be computed using mathematical and geospatial models according to literature. The potential indicators also can be indirect indicators of SDG targets. They may have indirect, partial or weak associations with SDG targets, but they can still be applied to support achieving SDGs. In general, data of indirect indicators should be processed and analyzed to derive parts of SDG indicators. The data processing generally includes data collection, processing, modeling, computations, assessment and validation.
4.2. Analysis
Figure 3 shows the relationship between EOSI and SDGs according to targets and indicators clarified in [61] and case studies in literature, such as [39][60][62][63][64][65][39,60,62,63,64,65]. In the figure, data of the direct and indirect influences of infrastructure on SDG targets are sourced from the infrastructure influence justification presented in [1]. Results show that the distribution of EOSI categories is critically varied for different targets. For instance, Earth observation based indicators have been available for at least two infrastructure influenced targets for SDG 6, 11, 14 and 15, but more than half of the infrastructure influenced targets cannot be derived from available or direct Earth observation indicators for SDG 9 and 16.
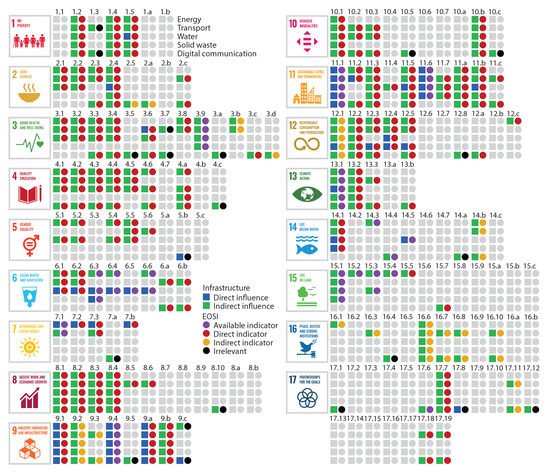
Figure 3. The relationship between Earth observation for sustainable infrastructure (EOSI) and Sustainable Development Goals (SDGs).
The direct and indirect influences of infrastructure on SDG targets are adapted from the infrastructure influence justification in [1] and the relationship between EOSI and each target is identified from case studies in literature, such as [39][60][62][63][64][65][39,60,62,63,64,65]. More importantly, the interaction between different categories of infrastructure and the support of Earth observation shows a full picture of current efforts and future potentials of EOSI (Figure 4). In total, there are 30 types of interactions regarding infrastructure category, direct or indirect influence of infrastructure and EOSI. The interactions are explained from following aspects. First, the available indicators are confirmed data that can support SID and most of the case studies in literature about EOSI have been performed for this type of indicators. For instance, for SDG 11.1 that the access to living space and services should be ensured [6], all infrastructure have direct influence on the target and Earth observation based indicators have been available in the official database [60][61][60,61], where the data have been assessed in recent case studies [66][67][173,174]. In addition, the summary indicates that the Earth observation for indirect influenced targets of infrastructure is the predominant one for all five categories of infrastructure. This means a considerable part of SDG targets will be achieved with the indirect influence of infrastructure, and these targets can be assessed with direct Earth observation data that have not yet been formally used in the Global SDG Indicators Database. For instance, SDG 11.3 is to enhance “sustainable urbanization and human settlement planning” [6] and all infrastructure have indirect influence on this target. Earth observation data, such as Landsat satellite images, Land–Use/Cover data, Defense Meteorological Satellite Program/Operational Linescan System (DMSP/OLS) nighttime light data, Human Settlement data, urban impervious surface data, and population grid data, have been applied in estimating land consumption rate [68][175] and identifying urban land use efficiency [69][70][71][72][176,177,178,179]. Finally, the indirect Earth observation indicators are primarily used for assessing targets indirectly influenced by infrastructure. For instance, SDG 9.2 is to “promote sustainable industrialization” and improve industry–related employment and economic growth [6], which is indirectly affected by infrastructure sectors since studies have demonstrated that the infrastructure quality can impact industrial productivity and economic growth [73][74][180,181]. Earth observation data, such as climate, soil, flood and storm data, have been used to assess the quality of different types of infrastructure in case studies of literature [75][76][77][78][71,182,183,184].
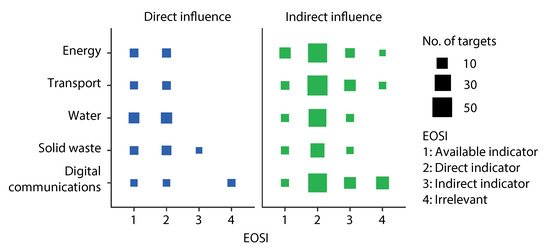
Figure 4. A summary of the interaction between different categories of infrastructure and EOSI.
Figure 5 shows a statistical summary of the relationship between EOSI and SDGs. The analysis demonstrates that among the 121 infrastructure influenced SDG targets, about 15% of the targets already have Earth observation based indicators and 15% of the targets are currently irrelevant to Earth observation according to the literature that we have collected. About 58% and 12% of the targets have direct and indirect indicators, respectively, that potentially can be applied in SDG assessment, characterization and decision making. This means about 70% of the infrastructure influenced targets can be directly or indirectly supported by Earth observation, but have not been included in current SDG indicators, which indicates a huge potential of Earth observation in achieving SID. The literature also show a critical challenge that benchmark case studies are only available for a part of the indicators.
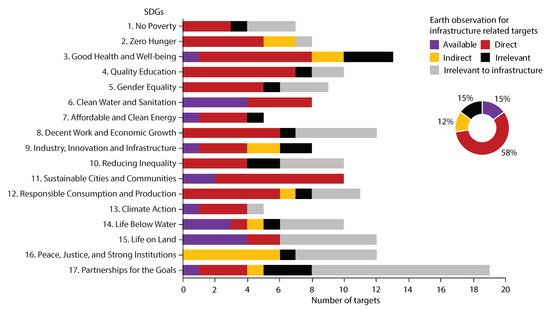
Figure 5. A statistical summary of the relationship between EOSI and SDGs.