Sports performance is a multifactorial trait, expressed by the interaction of both individual and environmental characteristics. Taking this into account, it is of relevance consider the context where athletes are inserted to better understand variability in the performance, specially in practice mainly performed in outdoor environment, such as running.
- running
- variability
- performance
- multilevel approach
1. Introduction
Sports performance is a multifactorial trait, determined by different predictors related to both the subject and the environment[1]. According to ecological model theory, human development (or a given behaviour) is the result of the interaction of variables derived from different levels, organized in a hierarchical structure, comprising variables directly related to the subjects as well as those related to social, physical, and natural environments[2][3][4]. In this context, athletes have different life stories, train with different coaches, and live in given neighbourhoods, which are located in cities/states/countries with distinct sports policies, different natural environments, and designs[5]. All of these aspects act together to produce the different athletes’ profiles and performance[5][6].
2. Running Performance Variability
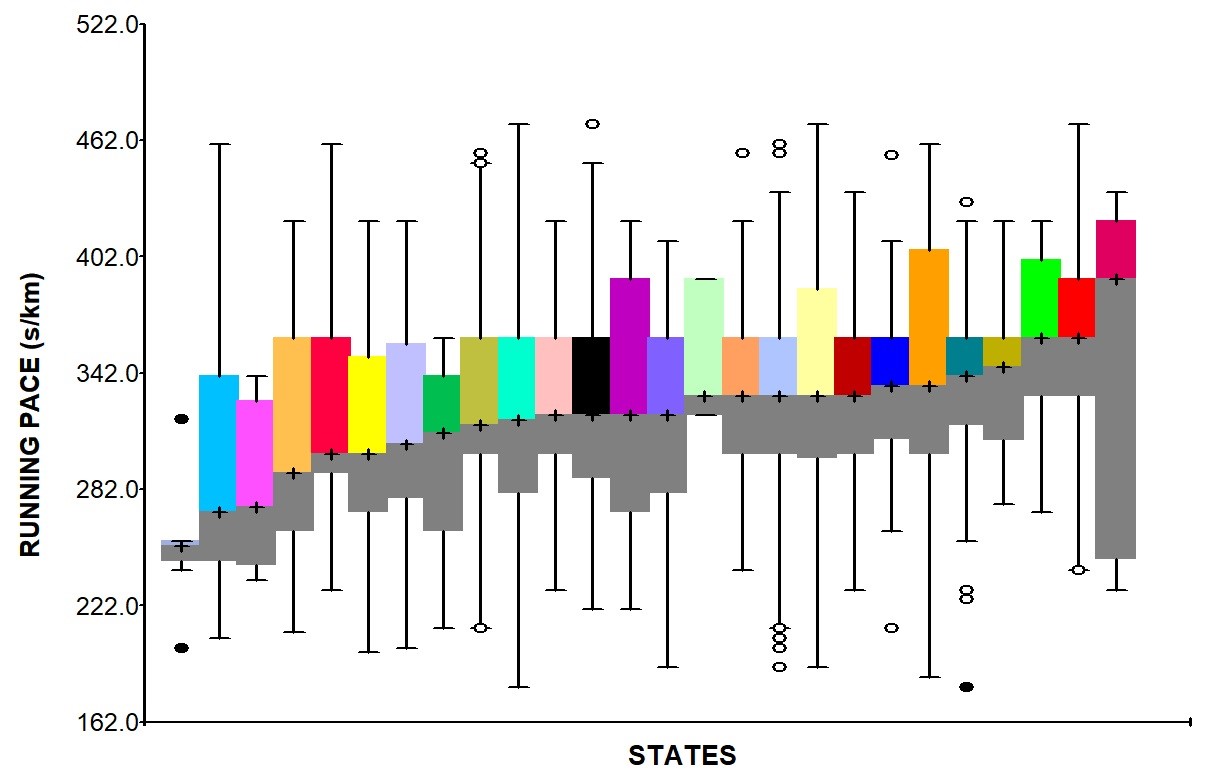
These relationships can be illustrated when considering changes in runners’ performance worldwide during the last decades[7]. As the largest South American country, Brazil presents nearly continental dimensions and sociocultural contrasts[8], making such differences in runners’ performances notable. In the manuscript “Running performance variability among runners from different Brazilian states: a multilevel approach”, published in International Journal of Environmental Research and Public Health (doi: 10.3390/ijerph18073781), we have identified a relevant between- and within-state variance in running performance (figure 1).

Figure 1. Running pace variance between Brazilian states, sorted by the median. Box-plot elements are as follow: cross, median; superior and inferior box limits, mean 75th and 25th percentiles, respectively; top and bottom bars, maximum and minimum normal values, respectively; circles indicate outliers.
. Running pace variance between Brazilian states, sorted by the median. Box-plot elements are as follow: cross, median; superior and inferior box limits, mean 75th and 25th percentiles, respectively; top and bottom bars, maximum and minimum normal values, respectively; circles indicate outliers.
In addition, we have identified state-level differences explained 3% of the total variance in Brazilian runners’ performance, with 54.4% of this variance being explained by running events, Human Development Index, and violence index. At the individual level, biological (sex, age, and BMI), socio-demographic (SES), and training (training frequency and volume/week) variables explained 56.4% of the 97% of the variance fraction associated with individual-level characteristics.
These results reinforce the significant role of the environment on the explanation of running performance variability; given the diversity across states, environmental variables should not be neglected, as they are relevant to the exploration of other variables possibly related to running performance.
References
- Yan, X.; Papadimitriou, I.; Lidor, R.; Eynon, N. Nature versus Nurture in Determining Athletic Ability. Med Sport Sci 2016, 61, 15-28, doi:10.1159/000445238.
- Tehrani, H.; Majlessi, F.; Shojaeizadeh, D.; Sadeghi, R.; Hasani Kabootarkhani, M. Applying Socioecological Model to Improve Women's Physical Activity: A Randomized Control Trial. Iran Red Crescent Med J 2016, 18, e21072, doi:10.5812/ircmj.21072.
- Vella, S.A.; Cliff, D.P.; Okely, A.D. Socio-ecological predictors of participation and dropout in organised sports during childhood. Int J Behav Nutr Phys Act 2014, 11, 1-10.
- Bronfenbrenner, U. Bioecologia do desenvolvimento humano: tornando os seres humanos mais humanos; Artmed: Porto Alegre, 2011; pp. 310.
- Maia, J.A.R.; Garganta, R.; Seabra, A.; Lopes, V.P.; Vinagre, J.; Freitas, D.L.d.; Prista, A.; Meira, C. Dados longitudinais e modelação hierárquica. Um tutorial para investigadores das ciências do desporto. . Revista Brasileira de Cineantropometria & Desempenho Humano 2005, 7, 94-108.
- Rossing, N.N.; Stentoft, D.; Flattum, A.; Côté, J.; Karbing, D.S. Influence of population size, density, and proximity to talent clubs on the likelihood of becoming elite youth athlete. Scandinavian Journal of Medicine and Science in Sports 2018, 28, 1304-1313, doi:10.1111/sms.13009.
- Marca, A.; Sedeaudab, A.; Guillaumea, M.; Rizka, M.; Schipmana, J.; Antero-Jacquemina, J.; Haidaa, A.; Berthelotab, G.; Toussainta, J.-F. Marathon progress: demography, morphology and environment. J Sports Sci 2014, 32, 524-532, doi:10.1080/02640414.2013.835436.
- Instituto Brasileiro de Geografia e Estatística, I. Painel de Indicadores. Availabe online: https://www.ibge.gov.br/indicadores.html (accessed on 19 Aug).
