The placental methylation pattern is crucial for the regulation of genes involved in trophoblast invasion and placental development, both key events for fetal growth. We investigated LINE-1 methylation and methylome profiling using a methylation EPIC array and the targeted methylation sequencing of 154 normal, full-term pregnancies, stratified by birth weight percentiles. LINE-1 methylation showed evidence of a more pronounced hypomethylation in small neonates compared with normal and large for gestational age. Genome-wide methylation, performed in two subsets of pregnancies, showed very similar methylation profiles among cord blood samples while placentae from different pregnancies appeared very variable. A unique methylation profile emerged in each placenta, which could represent the sum of adjustments that the placenta made during the pregnancy to preserve the epigenetic homeostasis of the fetus. Investigations into the 1000 most variable sites between cord blood and the placenta showed that promoters and gene bodies that are hypermethylated in the placenta are associated with blood-specific functions, whereas those that are hypomethylated belong mainly to pathways involved in cancer. These features support the functional analogies between a placenta and cancer.
- placenta
- methylome
- LINE-1
- birth weight
- normal pregnancies
1. Introduction
The placenta is the transient organ of primary importance during pregnancy, acting as a highly specialized interface intimately connecting mother and fetus. It ensures an adequate provision of nutrients and oxygen to the embryo as well as waste disposal and hormone production to support pregnancy and promote fetal growth. In order to allow the pregnancy to progress, even in presence of unfavorable conditions (of maternal or fetal origin), the placenta can adapt dynamically. Several factors, including in utero environmental changes and adverse maternal conditions such as infections, metabolic changes, and poor nutrition or obesity can induce placental adaptability through fine regulation processes that are not fully understood
. Despite the adaptability properties, early defects in the structure or function of the placenta or some maternal/fetal pathologic conditions can severely alter the maternal–fetal interface causing abortion, fetal death, abnormal fetal growth and maternal complications, including preeclampsia
. The causes of placental failure are often of genetic origin: mutated genes during conception, confined chromosomal unbalances, or genomic imprinting disturbances
. All these conditions can affect the gene expression equilibrium during pregnancy and, therefore, undermine the outcome.
Beyond the presence of recognizable genetic defects, gene expression modifications in crucial windows of placental development could affect its functioning, thus modifying maternal and fetal physiology. These placental changes can be difficult to identify for different reasons: accessibility to placental cells during pregnancy, morphological heterogeneity and the complex cellular composition of the organ. Despite the difficulties in recognizing the genetic/epigenetic alterations arising during pregnancy, they can represent biological markers of a pregnancy outcome.
Among the adverse factors, maternal undernutrition or poor nutrient intake due to a malfunction of placental transport can induce metabolic modifications in the fetus to maximize the limited nutrient resources and maintain survival. This process could be favored by epigenetic modifications to finely control the expression of genes crucial for fetal metabolic homeostasis. These signatures may persist after birth as an “epigenetic memory” of the metabolic adaptation during the prenatal life. A concept, in keeping with the DoHad hypothesis introduced by David Barker
[7]
, links poor prenatal growth with susceptibility to metabolic disorders throughout life, such as type 2 diabetes and metabolic syndrome.
Epigenetics regulates gene expression without altering the DNA sequence, by combining the actions of enzymes that allow or inhibit gene expression
[8]
. It also functions as an interface between external inputs (e.g., drugs, infections, diseases, aging, diet, stress) and gene expression
[9]
.
The development itself is an epigenetic process. This means that during fetal life the epigenome of the embryonic and extraembryonic compartments undergoes continuous change, which is essential for cell lineage differentiation, fetal and placental growth, and responses to external factors
[10]
. The pattern of placental methylation is crucial for the regulation of genes involved in trophoblast invasion and placental development, which are key events for fetal growth
. For example, the expression of the gene encoding chorionic gonadotropin is related to the gestational week of pregnancy and its expression is epigenetically regulated
[13]
.
The DNA methylation landscape of the placenta is distinct from that of other tissues. The trophoblast and the mesenchyme core of the chorionic villi have a unique methylation profile compared with maternal decidua, fetal membranes and embryonic tissues
[14]
. The presence of large blocks (>100 kb) of intermediate methylation, named Partially Methylated Domains (PMDs), accounting for about 37% of the placental genome, can help explain the typical hypomethylation observed in the placenta, compared to other tissues
.
In adult somatic tissues, DNA methylation is characterized by homogeneous distribution where most of the CpG sites show either high (> 90%) or low (<10%) methylation. In the placental DNA, however, the remarkable presence of PMDs results in a unique distribution of the methylation profile, characterized by peaks with partially methylated and highly methylated regions
[16]
.
The hypomethylation of different families of Retrotransposable Elements (REs) is more pronounced in the placenta compared to other tissues, and the specific methylation pattern depends on the REs family and the evolutionary age of the sequence
. Furthermore, the methylation status of REs, such as the Long Interspersed Nuclear Elements (LINE-1), appears to be related to their location within or outside the PMD domains
[16]
.
The placental methylome undergoes dynamic changes during gestation
not only to promote fetal development but also in response to environmental exposure that requires adaptive changes in the cellular composition of the placenta
. Fetal/placental adaptation to unfavorable situations, such as poor nutrient availability, can be achieved by epigenetic modification that can persist, thus modifying the physiological expression of genes in the fetus
[22]
. The dynamic of DNA methylation in fetal/placental compartments may be one of the mechanisms by which environmental exposure and genetic variation may influence fetal growth
. Several studies have shown that fetal growth and birth weight are significantly associated with global and specific methylation profiles of defined loci and CpG sites in the placental genome
. However, contradictory results are reported on the association of placental methylation level of LINE-1 and fetal growth defects
.
2. LINE-1 Methylation Analysis
We performed the analysis on maternal and cord blood and placenta samples of 154 pregnancies (
).
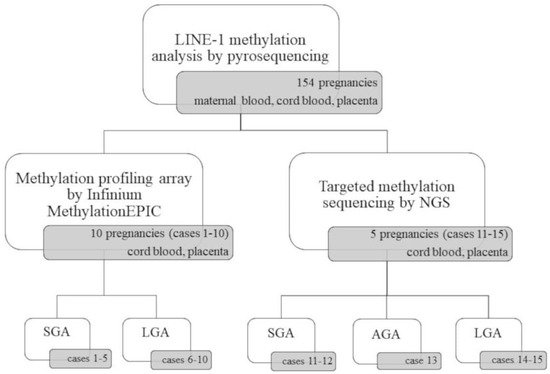
Figure 1. Schematic overview of the experimental design. SGA, small for gestational age; AGA, appropriate for gestational age; LGA, large for gestational age.
As shown in
As shown in
A, we found a significant LINE-1 hypomethylation in the placenta and compared it with both cord blood and maternal peripheral blood (The mean methylation ± standard deviation (%): 39.86 ± 6.08; 63.14 ± 4.88; 62.44 ± 4.47, respectively; p-value of placenta vs fetal blood: 4.5 × 10
−115
). Notably, methylation levels in cord and maternal blood were very similar, thus suggesting that LINE-1 methylation pattern in blood is stable and does not change throughout life.
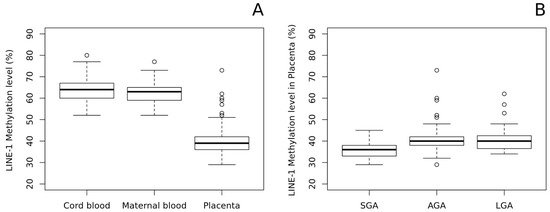
Figure 2.
A
B
p
= 1.67 × 10⁻⁴
) and LGA (p
= 6.36 × 10⁻⁵
) newborns. No differences were observed between AGA and LGA placentae (B). In addition, neither maternal or cord blood LINE-1 methylation differs among SGA, AGA, and LGA groups.3. Methylation-Profiling Array
The analysis was carried on cord blood and placenta from 10 pregnancies (
) using the Infinium EPIC array approach.
The Principal Component Analysis was adopted to reduce the complexity of whole genome methylation data. The results, shown in
, clearly indicate evident differences between the two tissues: clustered distribution of cord blood samples (green circle) and scattered distribution of placental cases (orange triangle). Therefore, each placenta showed a unique methylation profile unrelated to the neonatal birth-weight percentile.
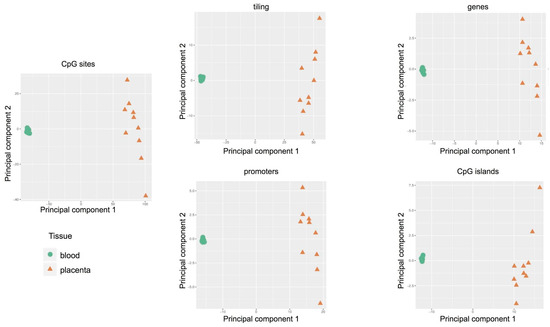
Figure 3.
Supplementary Table S1 supplementary could be found in https://www.mdpi.com/1422-0067/22/4/2136/htm). Differential methylation analysis performed at the regional level was carried out considering CpG islands, promoters, genes, and tiling. Results of the differential methylation analysis at the probe and regional levels were represented by volcano plots as shown in
. Differential methylation analysis performed at the regional level was carried out considering CpG islands, promoters, genes, and tiling. Results of the differential methylation analysis at the probe and regional levels were represented by volcano plots as shown in .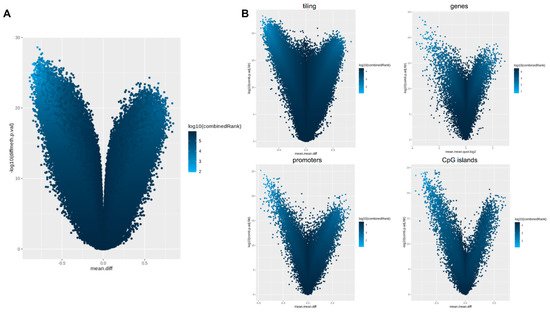
Figure 4.
A
x
y
B
4. Targeted Methylation Sequencing by NGS
The analysis was carried out on cord blood and placental DNA from five pregnancies (
) using SureSelect Human Methyl-Seq approach.
By PCA we found that the main source of variability in the methylation levels was between the two tissues, allowing us to distinguish specific CpG methylation clusters (
) and confirming data obtained by the methylation array approach.
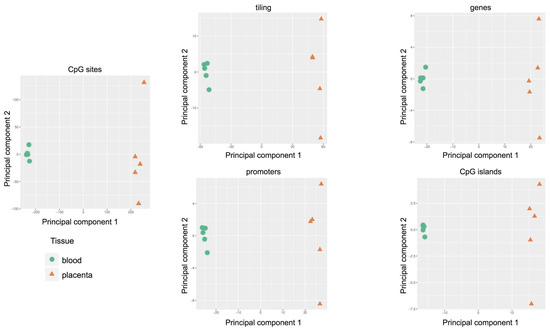
Figure 5.
Hierarchical clustering based on a CpG methylation score in cord blood and placenta (
) demonstrates that a general hypomethylation in placenta samples compared to cord blood was assessed, thus confirming data of LINE-1 methylation. In particular,
A depicts the distribution of each methylation value. The data show that the methylation profile of the placenta is not only composed of fully methylated or unmethylated regions but includes a wider range of regions displaying intermediate methylation scores compared to cord blood. This intermediate methylation status is likely due to PMDs, typical components of the placental genome
[16]
.
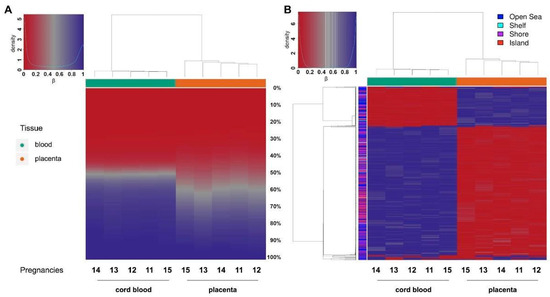
Figure 6.
A
B
In order to define the differentially methylated sites in cord blood and placenta, we selected the 1000 most variable sites and performed hierarchical clustering. We were thus able not only to distinguish between the two tissue clusters based on their opposite methylation patterns, but we also confirmed that the majority of differentially methylated sites are hypomethylated in the placenta (
B).
For the differential methylation module, we used the RnBeads rank, combining the mean methylation differences, methylation ratio, and
p
-value, to identify differences between the placenta and cord blood at the CpG site and at the region level, including tiling (5 kilo base pair regions), genes, promoters and CpG islands (
A).
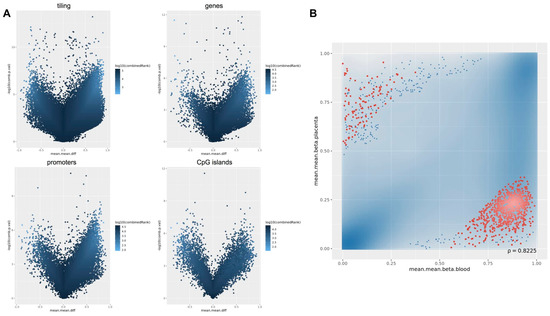
Figure 7.
A
x
y
10
B
x
y
We selected the 1000 most differentially methylated promoter regions and, to distinguish promoters based on their tissue-specific methylation status, stratified them into two subgroups. We identified 119 promoter regions methylated in the placenta and hypomethylated in the cord blood, and 881 promoters methylated only in the cord blood (
B).
By means of the Ingenuity Pathway Analysis (IPA) software v.60467501 (QIAGEN, Hilden, Germany), we explored which genes are differentially methylated in the promoter and in the gene body. We found that 75 promoters, specifically methylated in the placenta, are involved in blood cell proliferation and immune cell migration and adhesion, as expected (
Table 1A). Differently, we found that promoter methylation was lower in the placenta than in the cord blood upstream of 450 genes that belong to pathways mainly involved in cancer (
2A). Differently, we found that promoter methylation was lower in the placenta than in the cord blood upstream of 450 genes that belong to pathways mainly involved in cancer (
Table 1B and
2B and
).
Table 12.
| A | |
|---|---|
| Diseases or Functions Annotation | p-Value |
| Leukocyte migration | 1.52 × 10⁻¹⁶ |
| Cell movement of lymphocytes | 5.05 × 10⁻¹⁴ |
| Cell movement of mononuclear leukocytes | 6.30 × 10⁻¹⁴ |
| Quantity of leukocytes | 7.50 × 10⁻¹⁴ |
| Lymphocyte migration | 9.59 × 10⁻¹⁴ |
| Quantity of lymphatic system cells | 1.97 × 10⁻¹³ |
| Quantity of lymphocytes | 5.29 × 10⁻¹³ |
| Cell movement of leukocytes | 6.80 × 10⁻¹³ |
| Proliferation of blood cells | 1.21 × 10⁻¹² |
| Proliferation of immune cells | 1.62 × 10⁻¹² |
| B | |
| Diseases or Functions Annotation | p-Value |
| Cutaneous melanoma | 1.52 × 10⁻¹² |
| Skin tumor | 5.94 × 10⁻¹² |
| Melanoma | 1.01 × 10⁻¹¹ |
| Skin cancer | 1.20 × 10⁻¹¹ |
| Malignant neuroendocrine neoplasm | 2.45 × 10⁻⁷ |
| Small cell lung carcinoma | 3.07 × 10⁻⁷ |
| Olfactory response | 3.73 × 10⁻⁷ |
| Neuroendocrine tumor | 4.48 × 10⁻⁷ |
| Extrapancreatic neuroendocrine tumor | 5.84 × 10⁻⁷ |
| Blue round small cell tumor | 7.16 × 10⁻⁶ |
(A) Functions identified from gene promoters methylated in the placenta but not in cord blood. (B) Functions identified from gene promoters methylated in cord blood but not in the placenta.
Considering the results for gene body methylation of the 1000 most differentially methylated loci in placenta, we identified 53 genes specifically methylated in the placenta, 12 of which also displayed hypermethylation at their promoters in the same tissue. We found that they are mainly involved in blood cell-specific biological functions such as lymphocyte and leukocyte proliferation and migration. Among the 1000 genes, 404 were specifically methylated in cord blood, and 111 of them displayed hypomethylation in both the promoter and gene body in the placenta. The most represented pathways of the 404 genes are involved in several cancers, especially skin tumors and neuroendocrine cancers (
B and
).
Considering the possible methylation differences in the birth weight groups, we used the RnBeads Differential Methylation module and investigated the differences in methylation among placental tissues. We did not find significant differences between SGA and LGA placentae, which could be explained by the small sample size as shown in
and
.
Finally, we focused our attention on
IGF2
and
H19
imprinted genes and master regulators of placental and fetal growth
. They were not among the top 1000 differentially methylated loci not in the promoters, or in the other investigated regions.
5. Discussion
The key role of the placenta in supporting pregnancy and promoting fetal growth is made possible by the capacity of this organ to modify its epigenetics during pregnancy in response to external factors.
This study explores the methylation signatures in the fetal and placental genome in uncomplicated full-term pregnancies with healthy newborns classified in three ranges of birth weight percentiles (SGA, AGA and LGA). As expected, we found that the maternal pregestational body mass index and placenta weight were strongly different in SGA, AGA and LGA groups.
LINE-1 methylation analysis of the entire population (154 pregnancies) showed hypomethylation in placenta compared with both cord and maternal blood, confirming previous evidence
. Importantly, the LINE-1 methylation ranges in fetal and maternal blood were very similar to each other and independent from birth weight categories, suggesting that LINE-1 methylation deviations are possible in the placenta but not in other tissues (excluding cancers), which probably maintains a closer methylation pattern and, therefore, a stronger stability in these repetitive sequences throughout life.
Less clear is a possible relationship of LINE-1 methylation and birth weight because of previous contradictory data
, which are probably due, at least in part, to the non-homogeneous selection of cases. Herein, we found that LINE-1 methylation was significantly lower in the placentae of SGA babies compared with those of both AGA and LGA newborns. Given that, the hypomethylation of RE-derived promoters contributed to the placental-specific expression of genes or gene isoforms important for placental functions and development
[37]
. A more pronounced hypomethylation in the placentae of SGA infants could force the expression of these genes to support fetal growth. Alternatively, it is possible that LINE-1 hypomethylation could inhibit correct fetal growth in early development although no data are available in the literature to support this hypothesis.
To explore the placental methylome compared with cord blood in normal pregnancies and to define the main gene pathways of differentially methylated loci, we used a combined omics approach of methylation microarray and targeted sequencing by NGS.
The exploratory analysis clearly showed a significant difference between placenta and cord blood epigenetic profiles, a result not completely unexpected since the two tissues are substantially different. Another important result emerged from this analysis: a significant difference in the epigenetic variability between the two tissues. In particular, cord blood methylation profiles were very similar and therefore clustered, whereas the placental cases were variable and widespread. These findings show the plasticity of the placenta in relation to the uniqueness of each pregnancy. From our study, there emerged a unique methylation profile in each placenta compared to the cord blood, which could represent the sum of adjustments that the placenta makes throughout the course of the pregnancy to preserve the epigenetic homeostasis of the fetus, thus contributing to the delivery of a healthy baby. On the other hand, it is known that the placenta is more prone to sustain genetic alterations. For example, mosaic trisomies confined in the placenta are much more tolerated than in the fetus
. Similarly, placental plasticity was also evidenced in mice, even though the placentae in the two species display remarkable morphological variations. Decato et al.
[40]
conducted a study of placental DNA methylation landscape in multiple mouse strains and showed evidence of a dynamic methylation program associated with a highly heterogeneous and deregulated global landscape, which was also related with the developmental timepoints.
Methylation sequencing showed a global hypomethylation of placenta compared to cord blood, thus confirming our results on LINE-1 and those previously reported
. This hypomethylation is not restricted to a certain class of repeated elements but seems to be a feature of the entire placental genome (gene promoters, gene bodies, CpG islands and tilings).
The differential methylation analysis confirmed that DNA methylation profiles of cord blood and placenta are different both at site and region levels. This is clearly shown in the volcano plots. Interestingly, both the array and sequencing experiments achieved comparable results.
By restricting the analysis to the 1000 most variable sites between the two tissues, we could appreciate their opposite methylation patterns, thus highlighting the strong epigenetic differences of embryonic and extraembryonic compartments. We investigated the biological functions associated with these differentially methylated loci, by performing ontology pathway analysis on promoters and gene bodies. In particular, we found that promoters and gene bodies that are hypermethylated in the placenta and hypomethylated in cord blood are associated with blood cell specific functions such as proliferation and migration of immune cells, as would be expected for this tissue. However, promoters and gene bodies that are hypomethylated only in the placenta belong to six pathways involved in cancer and two related to ventricular myocytes.
In addition, we verified whether the methylation levels of
IGF2-
and
H19
-imprinted genes, the master loci of fetal and placental growth, were variables among samples. There were no differences either between cord blood and placenta or among the samples, thus reinforcing the concept that genomic imprinting, once established, remains stable
[41]
.
In order to obtain relevant results we included only normal full-term pregnancies and found methylation NGS results in line with the EPIC array findings, despite the low number of cases. These analyses also highlighted significant overlapping differences between cord blood and the placenta at the most differentially methylated genome-wide sites. However, a point of weakness of our study is related to the small group size of neonates stratified for the birthweight analyzed with omics approaches; therefore, we could not find specific methylation-profiling related to birth weight. Nevertheless, a LINE-1 investigation carried out on the entire population revealed a peculiar hypomethylation associated with SGA phenotype.
As with the other authors
[16]
, we showed that the placenta is characterized by regions displaying intermediate methylation scores likely due to PMDs, which are specific components of the placental genome. This can explain the hypomethylation that characterizes the placenta, the only normal tissue with PMDs. Only cancers share this peculiarity, and it has been hypothesized that PMDs may activate placental-specific programming in cancer cells
[16]
. The placental villi, similarly to those found in a cancer, are indeed able to migrate, invade, and remodel the maternal decidua. Moreover, as reported by Lorincz and Schubeler
[42]
, the concept of similarity between epigenetic placental and cancer landscapes is particularly interesting: both adopt similar methylation adaptations to achieve analogous behaviours (e.g., rapid growth, vascular remodeling, and cell invasion). These common behaviors may explain why activated pathways are shared between these tissues. Accordingly, our results showed that the most relevant Functions Annotation of pathways active in placenta were related to different types of cancer including skin and neuroendocrine tumors.
Taken together, our findings confirmed the global hypomethylation of placental DNA including LINE-1, promoters, CpG islands, gene body, and tilings. They also showed that specifically activated pathways in the placenta are those involved in cancer. The placental heterogeneity of the methylation levels characterizing each pregnancy could explain its broader plasticity compared to the fetal compartment.
References
- Bateson, P.; Barker, D.; Clutton-Brock, T.; Deb, D.; D’Udine, B.; Foley, R.A.; Gluckman, P.D.; Godfrey, K.M.; Kirkwood, T.B.L.; Lahr, M.M.; et al. Developmental plasticity and human health. Nature 2004, 430, 419–421.
- Turco, M.Y.; Moffett, A. Development of the human placenta. Development 2019, 146, dev163428.
- Miozzo, M.; Grati, F.; Bulfamante, G.; Rossella, F.; Cribiù, M.; Radaelli, T.; Cassani, B.; Persico, T.; Cetin, I.; Pardi, G.; et al. Post-zygotic origin of complete maternal chromosome 7 Isodisomy and consequent loss of placental PEG1/MEST expression. Placenta 2001, 22, 813–821.
- Grati, F.R. Chromosomal mosaicism in human feto-placental development: Implications for prenatal diagnosis. J. Clin. Med. 2014, 3, 809–837.
- Miozzo, M.; Simoni, G. The role of imprinted genes in fetal growth. Biol. Neonate 2002, 81, 217–228.
- Perez-Garcia, V.; Fineberg, E.; Wilson, R.; Murray, A.; Mazzeo, C.I.; Tudor, C.; Sienerth, A.; White, J.K.; Tuck, E.; Ryder, E.J.; et al. Placentation defects are highly prevalent in embryonic lethal mouse mutants. Nature 2018, 555, 463–468.
- Barker, D. The Developmental origins of adult disease. J. Am. Coll. Nutr. 2004, 23, 588S–595S.
- Weber, M.; Hellmann, I.; Stadler, M.B.; Ramos, L.; Pääbo, S.; Rebhan, M.; Schübeler, D. Distribution, silencing potential and evolutionary impact of promoter DNA methylation in the human genome. Nat. Genet. 2007, 39, 457–466.
- Berger, S.L.; Kouzarides, T.; Shiekhattar, R.; Shilatifard, A. An operational definition of epigenetics. Genes Dev. 2009, 23, 781–783.
- Morgan, H.D.; Santos, F.; Green, K.; Dean, W.; Reik, W. Epigenetic reprogramming in mammals. Hum. Mol. Genet. 2005, 14, R47–R58.
- Rahnama, F.; Shafiei, F.; Gluckman, P.D.; Mitchell, M.D.; Lobie, P.E. Epigenetic Regulation of human trophoblastic cell migration and invasion. Endocrinology 2006, 147, 5275–5283.
- Serman, L.; Vlahović, M.; Sijan, M.; Bulić-Jakus, F.; Serman, A.; Sincić, N.; Matijević, R.; Jurić-Lekić, G.; Katusić, A. The impact of 5-azacytidine on placental weight, glycoprotein pattern and pro-liferating cell nuclear antigen expression in rat placenta. Placenta 2007, 28, 803–811.
- Milano-Foster, J.; Ray, S.; Home, P.; Ganguly, A.; Bhattacharya, B.; Bajpai, S.; Pal, A.; Mason, C.W.; Paul, S. Regulation of human trophoblast syncytialization by histone demethylase LSD1. J. Biol. Chem. 2019, 294, 17301–17313.
- Robinson, W.P.; Price, E.M. The human placental methylome. Cold Spring Harb. Perspect. Med. 2015, 5, a023044.
- Novakovic, B.; Wong, N.C.; Sibson, M.; Ng, H.-K.; Morley, R.; Manuelpillai, U.; Down, T.; Rakyan, V.K.; Beck, S.; Hiendleder, S.; et al. DNA Methylation-mediated Down-regulation of DNA Methyltransferase-1 (DNMT1) is coincident with, but not essential for, global hypomethylation in human placenta. J. Biol. Chem. 2010, 285, 9583–9593.
- Schroeder, D.I.; Blair, J.D.; Lott, P.; Yu, H.O.; Hong, D.; Crary, F.; Ashwood, P.; Walker, C.; Korf, I.; Robinson, W.P.; et al. The human placenta methylome. Proc. Natl. Acad. Sci. USA 2013, 110, 6037–6042.
- Reiss, D.; Zhang, Y.; Mager, D.L. Widely variable endogenous retroviral methylation levels in human placenta. Nucleic Acids Res. 2007, 35, 4743–4754.
- Price, E.M.; Cotton, A.M.; Peñaherrera, M.S.; McFadden, D.E.; Kobor, M.S.; Robinson, W.P. Different measures of “genome-wide” DNA methylation exhibit unique properties in placental and somatic tissues. Epigenetics 2012, 7, 652–663.
- Chatterjee, A.; Macaulay, E.C.; Rodger, E.J.; Stockwell, P.A.; Parry, M.F.; Roberts, H.E.; Slatter, T.L.; Hung, N.A.; Devenish, C.J.; Morison, I.M. Placental hypomethylation is more pronounced in genomic loci devoid of retroelements. G3 Genes Genomes Genet. 2016, 6, 1911–1921.
- Novakovic, B.; Yuen, R.K.; Gordon, L.; Penaherrera, M.S.; Sharkey, A.; Moffett, A.; Craig, J.M.; Robinson, W.P.; Saffery, R. Evidence for widespread changes in promoter methylation profile in human placenta in response to increasing gestational age and environmental/stochastic factors. BMC Genom. 2011, 12, 529.
- Del Gobbo, G.F.; Konwar, C.; Robinson, W.P. The significance of the placental genome and methylome in fetal and maternal health. Qual. Life Res. 2019, 139, 1183–1196.
- Barker, D.; Thornburg, K. Placental programming of chronic diseases, cancer and lifespan: A review. Placenta 2013, 34, 841–845.
- Simpkin, A.J.; Suderman, M.; Gaunt, T.R.; Lyttleton, O.; McArdle, W.L.; Ring, S.M.; Tilling, K.; Smith, G.D.; Relton, C.L. Longitudinal analysis of DNA methylation associated with birth weight and gestational age. Hum. Mol. Genet. 2015, 24, 3752–3763.
- Agha, G.; Hajj, H.; Rifas-Shiman, S.L.; Just, A.C.; Hivert, M.F.; Burris, H.H.; Lin, X.; Litonjua, A.A.; Oken, E.; DeMeo, D.L.; et al. Birth weight-for-gestational age is associated with DNA methylation at birth and in childhood. Clin. Epigenetics 2016, 8, 1–12.
- Dwi Putra, S.E.; Reichetzeder, C.; Hasan, A.A.; Slowinski, T.; Chu, C.; Krämer, B.K.; Kleuser, B.; Hocher, B. Being born large for gestational age is associated with increased global placental DNA methylation. Sci. Rep. 2020, 10, 927.
- Filiberto, A.C.; Maccani, M.A.; Koestler, D.C.; Wilhelm-Benartzi, C.; Avissar-Whiting, M.; Banister, C.E.; Gagne, L.A.; Marsit, C.J. Birthweight is associated with DNA promoter methylation of the glucocorticoid receptor in human placenta. Epigenetics 2011, 6, 566–572.
- Ferreira, J.C.; Choufani, S.; Grafodatskaya, D.; Butcher, D.T.; Zhao, C.; Chitayat, D.; Shuman, C.; Kingdom, J.; Keating, S.; Weksberg, R. WNT2promoter methylation in human placenta is associated with low birthweight percentile in the neonate. Epigenetics 2011, 6, 440–449.
- Turan, N.; Ghalwash, M.F.; Katari, S.; Coutifaris, C.; Obradovic, Z.; Sapienza, C. DNA methylation differences at growth related genes correlate with birth weight: A molecular signature linked to developmental origins of adult disease? BMC Med. Genom. 2012, 5, 1–21.
- Leeuwerke, M.; Eilander, M.S.; Pruis, M.G.; Lendvai, Á.; Erwich, J.J.; Scherjon, S.A.; Plösch, T.; Eijsink, J.J. DNA methylation and expression patterns of selected genes in first-trimester placental tissue from pregnancies with small-for-gestational-age infants at birth. Biol. Reprod. 2016, 94, 37.
- Banister, C.E.; Koestler, D.C.; Maccani, M.A.; Padbury, J.F.; Houseman, E.A.; Marsit, C.J. Infant growth restriction is associated with distinct patterns of DNA methylation in human placentas. Epigenetics 2011, 6, 920–927.
- Chen, P.Y.; Chu, A.; Liao, W.W.; Rubbi, L.; Janzen, C.; Hsu, F.M.; Thamotharan, S.; Ganguly, A.; Lam, L.; Montoya, D.; et al. Prenatal growth patterns and birthweight are associated with differential DNA Methylation and gene expression of cardiometabolic risk genes in human placentas: A discovery-based approach. Reprod. Sci. 2018, 25, 523–539.
- Bourque, D.K.; Avila, L.; Peñaherrera, M.; von Dadelszen, P.; Robinson, W.P. Decreased placental methylation at the H19/IGF2 imprinting control region is associated with normotensive intrauterine growth restriction but not preeclampsia. Placenta 2010, 31, 197–202.
- Michels, K.B.; Harris, H.R.; Barault, L. Birthweight, maternal weight trajectories and global DNA methylation of LINE-1 repetitive elements. PLoS ONE 2011, 6, e25254.
- O’Callaghan, J.L.; Clifton, V.L.; Prentis, P.; Ewing, A.; Miller, Y.D.; Pelzer, E.S. Modulation of placental gene expression in small-for-gestational-age infants. Genes 2020, 11, 80.
- Tabano, S.; Colapietro, P.; Cetin, I.; Grati, F.R.; Zanutto, S.; Mandò, C.; Antonazzo, P.; Pileri, P.; Rossella, F.; Larizza, L.; et al. Epigenetic modulation of the IGF2/H19 imprinted domain in human embryonic and extra-embryonic compartments and its possible role in fetal growth re-striction. Epigenetics 2010, 5, 313–324.
- Rovina, D.; La Vecchia, M.; Cortesi, A.; Fontana, L.; Pesant, M.; Maitz, S.; Tabano, S.; Bodega, B.; Miozzo, M.; Sirchia, S.M. Profound alterations of the chromatin architecture at chromosome 11p15.5 in cells from Beckwith-Wiedemann and Silver-Russell syndromes patients. Sci. Rep. 2020, 10, 1–19.
- Macaulay, E.C.; Weeks, R.J.; Andrews, S.; Morison, I.M. Hypomethylation of functional retrotransposon-derived genes in the human placenta. Mamm. Genome 2011, 22, 722–735.
- Simoni, G.; Sirchia, S.M. Confined placental mosaicism. Prenat. Diagn. 1994, 14, 1185–1189.
- Taylor, T.H.; Gitlin, S.A.; Patrick, J.L.; Crain, J.L.; Wilson, J.M.; Griffin, D.K. The origin, mechanisms, incidence and clinical consequences of chromosomal mosaicism in humans. Hum. Reprod. Updat. 2014, 20, 571–581.
- Decato, B.E.; Lopez-Tello, J.; Sferruzzi-Perri, A.N.; Smith, A.D.; Dean, M.D. DNA Methylation divergence and tissue specialization in the developing mouse placenta. Mol. Biol. Evol. 2017, 34, 1702–1712.
- Paganini, L.; Carlessi, N.; Fontana, L.; Silipigni, R.; Motta, S.; Fiori, S.; Guerneri, S.; Lalatta, F.; Cereda, A.; Sirchia, S.M.; et al. Beckwith–Wiedemann syndrome prenatal diagnosis by methylation analysis in chorionic villi. Epigenetics 2015, 10, 643–649.
- Lorincz, M.C.; Schübeler, D. Evidence for converging DNA methylation pathways in placenta and cancer. Dev. Cell 2017, 43, 257–258.