The daily tasks that the human being develops in any context are complex and dynamic. The variables that are part of a study object can be simplified in concepts that are linked to the problem. In this context, the Fuzzy Cognitive Maps (FCMs) make it easier to synthesize the information related to the problem. This study seeks to identify the variables that not influence the return of agricultural graduates to the rural sector. For this, FCMs tool and hierarchical cluster were applied. Interviews were held with academic experts in the field of rural development and managers of agricultural planning. Eighteen categorized variables were identified in the study, of which five were strategies for agricultural development. These were: (1) state policies for rural development, (2) quality academic training, (3) training in innovation and entrepreneurship, (4) national research and university extension programs, and (5) associative cooperativism. The identification of these variables helps state authorities and universities to design strategies that promote the participation of agricultural graduates in the rural production sector.
- fuzzy cognitive maps
- agricultural graduates
- quality academic training
- state policies
- rural development
- Ecuador
1. Introduction
1.1. Categorized Variables
1. Results
1.1. Categorized Variables
The categorized variables, which the analysis of information obtained in the study was based on, as well as the repetition of each variable established in the interview for each research group, are detailed in
The categorized variables, which the analysis of information obtained in the study was based on, as well as the repetition of each variable established in the interview for each research group, are detailed in Table ble 1.
.
Table 1. Categorized variables and frequency established in the interviews split by group
The four most frequent variables reflect the most frequently mentioned themes (variables) in both research groups and are related to: “State policies for rural development” (academia/state/rural sector) and “Quality academic training” (academia/state). It is clear that both research groups agree on the importance of these themes, which involve academia, the state and the rural sector; however, they do not agree on the exact level of importance, which suggests that the groups have different priorities.
1.2. Fuzzy Cognitive Map Indices (FCM) – Individual and by research group
The individual and group FCM indices are shown in
Table 1. Categorized variables and frequency established in the interviews split by group
|
Categorized Variables |
Frequency |
|
|
(ULs) |
(APMs) |
|
|
State policies for rural development |
34 |
40 |
|
Quality academic training |
29 |
43 |
|
Innovation and entrepreneurship training |
25 |
31 |
|
Risk in the farming sector |
20 |
12 |
|
Associative cooperativism |
18 |
20 |
|
Find employment |
16 |
14 |
|
National research and university extension program |
15 |
16 |
|
Curriculum redesign |
13 |
0 |
|
Credit |
9 |
15 |
|
Business and commercial development |
0 |
17 |
|
Commercialization |
5 |
10 |
|
State subsidies |
11 |
7 |
|
Strategic, tactical and operational planning |
6 |
4 |
|
Basic services |
5 |
8 |
|
Appropriate technology for the rural sector |
0 |
8 |
|
Practical training |
0 |
7 |
|
Legislated pre-professional practical training |
6 |
0 |
|
Diversification of activities |
0 |
7 |
Categorized Variables |
Frequency | |||
|
(ULs) |
(APMs) |
||
|
State policies for rural development |
34 |
40 |
|
|
Quality academic training |
29 |
43 |
|
|
Innovation and entrepreneurship training |
25 |
31 |
|
|
Risk in the farming sector |
20 |
12 |
|
|
Associative cooperativism |
18 |
20 |
|
|
Find employment |
16 |
14 |
|
|
National research and university extension program |
15 |
16 |
|
|
Curriculum redesign |
13 |
0 |
|
|
Credit |
9 |
15 |
|
|
Business and commercial development |
0 |
17 |
|
|
Commercialization |
5 |
10 |
|
|
State subsidies |
11 |
7 |
|
|
Strategic, tactical and operational planning |
6 |
4 |
|
|
Basic services |
5 |
8 |
|
|
Appropriate technology for the rural sector |
0 |
8 |
|
|
Practical training |
0 |
7 |
|
|
Legislated pre-professional practical training |
6 |
0 |
|
|
Diversification of activities |
0 |
7 |
|
ULs = University lecturers; APMs = Agricultural Planning Managers
ULs = University lecturers; APMs = Agricultural Planning Managers
The four most frequent variables reflect the most frequently mentioned themes (variables) in both research groups and are related to: “State policies for rural development” (academia/state/rural sector) and “Quality academic training” (academia/state). It is clear that both research groups agree on the importance of these themes, which involve academia, the state and the rural sector; however, they do not agree on the exact level of importance, which suggests that the groups have different priorities.
1.2. Fuzzy Cognitive Map Indices (FCM) – Individual and by research group
The individual and group FCM indices are shown in Table 2 .
. The calculation of the variance between the two research groups provided a Fisher value of 0.743 (p = 0.538). This means that the two research groups (ULs and APMs) do not show statistically significant differences between the categorized variables indices.
Table 2. FCM indices by research group (ULs & APMs)
Appropriate technology for the rural sector |
- |
receiver |
receiver |
1.3. Centrality values for the research groups’ (ULs & APMs) Fuzzy Cognitive Maps
The 18 categorized variables are reflected in the radial diagram in
FCM indices by research group (ULs & APMs)
|
Index |
FCM average values X±SD |
Values grouped in FCM |
|||
|
ULs |
APMs |
ULs |
APMs |
ULs - APMs |
|
|
Number of maps |
15 |
23 |
1 |
1 |
1 |
|
Number of variables (N) |
6.40 ± 1.12 |
6.30 ± 1.72 |
14 |
16 |
18 |
|
Number of connections (C) |
11.13 ± 3.94 |
9.83 ± 4.13 |
68 |
76 |
108 |
|
Connections by component (C/N) |
1.72 ± 0.43 |
1.52 ± 0.34 |
4.86 |
4.75 |
6 |
|
Number of transmitter variables (T) |
1.33 ± 0.49 |
1.35 ± 0.49 |
1 |
1 |
1 |
|
Number of receiver variables (R) |
2.20 ± 0.77 |
1.91 ± 0.79 |
3 |
2 |
2 |
|
Number of ordinary variables |
2.87 ± 1.19 |
3.04 ± 1.33 |
10 |
13 |
15 |
|
Level of complexity (R/T) |
1.77 ± 0.75 |
1.52 ± 0.73 |
3 |
1 |
2 |
|
Density |
0.33 ± 0.10 |
0.31 ± 0.11 |
0.35 |
0.32 |
0.33 |
X=Median; SD=Standagurd deviation; ULs=University Lecturers; APMs=Agricultural Planning Managers; ULs – APMs=Community group
The transmitter variable “National research and university extension program” (academia/state) and the receiver variable “Commercialization” (rural sector) that are shown in Table 3, are common in both of the research groups and the community group (both research groups), which shows the priority of these variables.
Table 3. Transmitter, receiver and ordinary variables for the FCMs in the two research groups and community group.
|
Categorized variables |
Research groups |
Community Group |
|
|
(ULs) |
(APMs) |
||
|
State policies for rural development |
ordinary |
ordinary |
ordinary |
|
Basic services |
receiver |
ordinary |
ordinary |
|
Commercialization |
receiver |
receiver |
receiver |
|
Practical training |
- |
ordinary |
ordinary |
|
Associative cooperativism |
ordinary |
ordinary |
ordinary |
|
Strategic, tactical and operational planning |
ordinary |
ordinary |
ordinary |
|
State subsidies |
ordinary |
ordinary |
ordinary |
|
Business and commercial development |
- |
ordinary |
ordinary |
|
Diversification of activities |
- |
ordinary |
ordinary |
|
Quality academic training |
ordinary |
ordinary |
ordinary |
|
Risk in the farming sector |
ordinary |
ordinary |
ordinary |
|
Credit |
receiver |
ordinary |
ordinary |
|
Curriculum redesign |
ordinary |
- |
ordinary |
|
Find employment |
ordinary |
ordinary |
ordinary |
|
Innovation and entrepreneurship training |
ordinary |
ordinary |
ordinary |
|
Legislated pre-professional practical training |
ordinary |
- |
ordinary |
|
National research and university extension program |
driver |
driver |
driver |
|
Appropriate technology for the rural sector |
- |
receiver |
receiver |
Index |
FCM average values |
X±SD |
Values grouped in FCM |
ULs |
APMs |
ULs |
APMs |
ULs - APMs |
|
|
Number of maps |
15 |
23 |
1 |
1 |
1 |
|
Number of variables (N) |
6.40 ± 1.12 |
6.30 ± 1.72 |
14 |
16 |
18 |
|
Number of connections (C) |
11.13 ± 3.94 |
9.83 ± 4.13 |
68 |
76 |
108 |
|
Connections by component (C/N) |
1.72 ± 0.43 |
1.52 ± 0.34 |
4.86 |
4.75 |
6 |
|
Number of transmitter variables (T) |
1.33 ± 0.49 |
1.35 ± 0.49 |
1 |
1 |
1 |
|
Number of receiver variables (R) |
2.20 ± 0.77 |
1.91 ± 0.79 |
3 |
2 |
2 |
|
Number of ordinary variables |
2.87 ± 1.19 |
3.04 ± 1.33 |
10 |
13 |
15 |
|
Level of complexity (R/T) |
1.77 ± 0.75 |
1.52 ± 0.73 |
3 |
1 |
2 |
|
Density |
0.33 ± 0.10 |
0.31 ± 0.11 |
0.35 |
0.32 |
0.33 |
X=Median; SD=Standard deviation; ULs=University Lecturers; APMs=Agricultural Planning Managers; ULs – APMs=Community group
The transmitter variable “National research and university extension program” (academia/state) and the receiver variable “Commercialization” (rural sector) that are shown in
The calculation of the variance between the two research groups provided a Fisher value of 0.7ble 43 (p = 0.538). This means that the two research groups (ULs and APMs) do not show statistically significant differences between the categorized variables indices.
Table 2.
, are common in both of the research groups and the community group (both research groups), which shows the priority of these variables.
Table 3. Transmitter, receiver and ordinary variables for the FCMs in the two research groups and community group.
Categorized variables |
Research groups |
Community Group |
(ULs) | |||
|
(APMs) |
|||
|
State policies for rural development |
ordinary |
ordinary |
ordinary |
|
Basic services |
receiver |
ordinary |
ordinary |
|
Commercialization |
receiver |
receiver |
receiver |
|
Practical training |
- |
ordinary |
ordinary |
|
Associative cooperativism |
ordinary |
ordinary |
ordinary |
|
Strategic, tactical and operational planning |
ordinary |
ordinary |
ordinary |
|
State subsidies |
ordinary |
ordinary |
ordinary |
|
Business and commercial development |
- |
ordinary |
ordinary |
|
Diversification of activities |
- |
ordinary |
ordinary |
|
Quality academic training |
ordinary |
ordinary |
ordinary |
|
Risk in the farming sector |
ordinary |
ordinary |
ordinary |
|
Credit |
receiver |
ordinary |
ordinary |
|
Curriculum redesign |
ordinary |
- |
ordinary |
|
Find employment |
ordinary |
ordinary |
ordinary |
|
Innovation and entrepreneurship training |
ordinary |
ordinary |
ordinary |
|
Legislated pre-professional practical training |
ordinary |
- |
ordinary |
|
National research and university extension program |
driver |
driver |
driver |
1.3. Centrality values for the research groups’ (ULs & APMs) Fuzzy Cognitive Maps
The 18 categorized variables are reflected in the radial diagram in Figure 1. The ULs and
. The ULs and APMs research groups were in agreement on 14 of the variables, of which five had values higher than 1.00 (1.00-2.62) and nine variables had values lower than 1.00 (0.23-0.98). (ver
APMs research groups were in agreement on 14 of the variables, of which five had values higher than 1.00 (1.00-2.62) and nine variables had values lower than 1.00 (0.23-0.98). The five variables with the highest scores were: 1) “State policies for rural development” (academia/state/rural sector), 2) “Quality academic training” (academia/state), 3) “Innovation and entrepreneurship training” (academia), 4) “National research and university endixtension program” (academia/state), and 5) “Associative cooperativism” (rural sector). Although the two groups (ULs and APMs) agreed on the importance of these variables (areas), they did not agree on the priority of each of these.
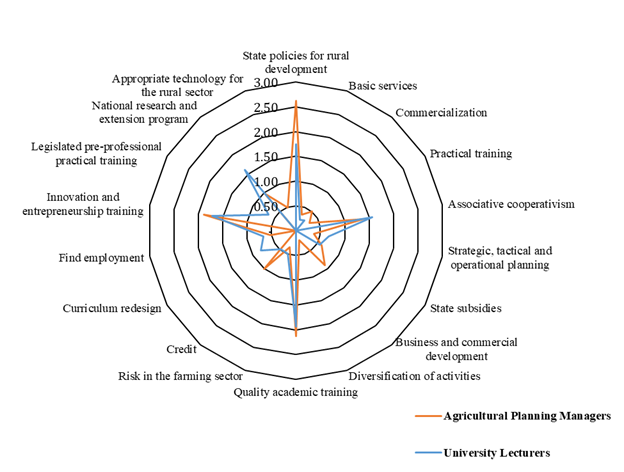
Figure 1. Centrality values for the University Lecturers and
) The five variables with the highest scores were: 1) “State policies for rural development” (academia/state/rural sector), 2) “Quality academic training” (academia/state), 3) “Innovation and entrepreneurship training” (academia), 4) “National research and university extension program” (academia/state), and 5) “Associative cooperativism” (rural sector). Although the two groups (ULs and APMs) agreed on the importance of these variables (areas), they did not agree on the priority of each of these.
Figure 1. Centrality values for the University Lecturers and Agricultural Planning Managers research groups, represented in a radial diagram
1.4. Aggregated community FCM map for the 18 categorized variables for the two research groups
The centrality values for the categorized variables in the community group (ULs and APMs together) that are shown in
Agricultural Planning Managers research groups, represented in a radial diagram
1.4. Aggregated communitypendix FCM map for the 18 categorized variables for the two research groups
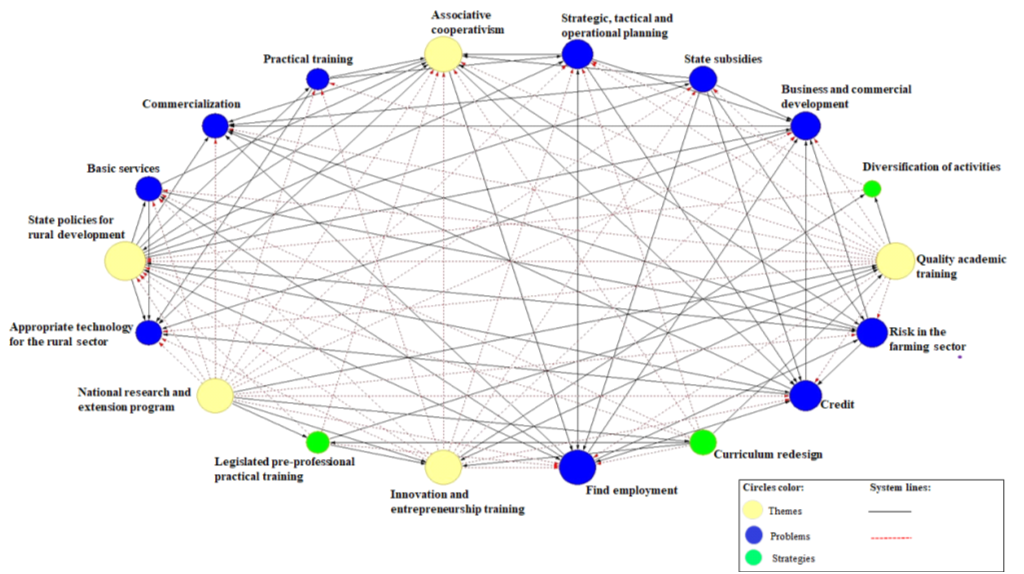
The centrality values for the categorized variables in the community group (ULs and APMs together) that are reflected by the five largest circles shown in Figure 2. The positive and negative connections between variables are represented by the lines.
are reflected by the five largest circles shown in
Figure 2. Aggregated community
. The positive and negative connections between variables are represented by the lines.
Figure 2. Aggregated community FCM map for the two research groups (ULs and APMs combined)
1.5. Hierarchical Cluster with centrality values for the community FCM
The centrality values of the aggregated FCM classified the 18 Categorized Variables in two clusters, as shown in the dendogram in
FCM map for the two research groups (ULs and APMs combined)
1.5. Hierarchical Cluster with centrality values for the community FCM
The centrality values of the aggregated FCM classified the 18 Categorized Variables in two clusters, as shown in the dendogram in Figure re 3. Cluster 1 groups the five variables that are most similar and relevant, classified as “Strategies for rural development”. Whilst cluster 2 groups the remaining 13 variables, classifying them as “Academia and rural problems”. Taking into the account the centrality of the variables represented in the dendogram, highly significant differences were found between the two clusters, with a value of p = 4.03e-08.
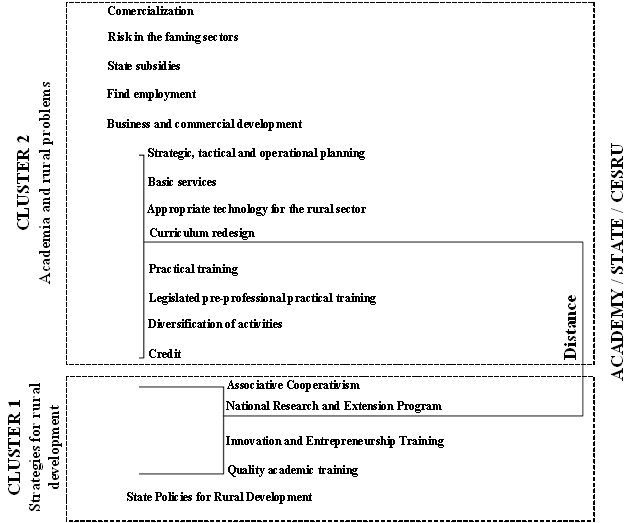
Figure 3. Dendrogram of the 18 categorized variables that represent the centrality values of the group that was interviewed (ULs and APMs)
2. Discussion
The two research groups (ULs and APMs) and the community group (38 interviewees) are in agreement on the importance and priority of the transmitter variable “National research and university extension program” –NRUEP (academia/state) and the receiver variable “Commercialization”. This means that if academia and the state were to implement the NRUEP, they would be able to improve commercialization in the Ecuadorian agricultural sector, which in turn would drive agricultural graduates to return to the rural production sector. In effect, Kumar and Kumar
. Cluster 1 groups the five variables that are most similar and relevant, classified as “Strategies for rural development”. Whilst cluster 2 groups the remaining 13 variables, classifying them as “Academia and rural problems”. Taking into the account the centrality of the variables represented in the dendogram, highly significant differences were found between the two clusters, with a value of p= 4.03e-08.
Figure 3. Dendrogram of the 18 categorized variables that represent the centrality values of the group that was interviewed (ULs and APMs)
2. Discussion
The two research groups (ULs and APMs) and the community group (38 interviewees) are in agreement on the importance and priority of the transmitter variable “National research and university extension program” –NRUEP (academia/state) and the receiver variable “Commercialization”. This means that if academia and the state were to implement the NRUEP, they would be able to improve commercialization in the Ecuadorian agricultural sector, which in turn would drive agricultural graduates to return to the rural production sector. In effect, Kumar and Kumar
[1]
, determine the importance of integrating research with the needs of the production sector, so that it can be part of the solution for the problems facing the agricultural sector; these being, reduction in productivity, lack of employment opportunities and depletion of natural resources
. Furthermore, Quarouch et al.
[4]
, Estévez
[5]
and Hidalgo et al.
[6]
, determine that the rural production sector provides excellent opportunities for academia, the state, private companies, cooperation, organizations of producers and the population to work together to diversify rural activities and generate non-agricultural employment in these areas. For example, in Latin American countries such as Uruguay, the innovation policy has been strengthened, creating a new institutionality with the ability to influence the allocation of public funds. The interaction between actors is carried out through national science, technology and innovation plans, based on common objectives
[7]
. The results that have been obtained show the involvement of the state in allocating resources, and positive results have been achieved with scientific and research activities, as well as in companies. This has helped to perfect the political decision making process in this area, stimulating conversations and debates on innovation. Therefore, coordinated, collaborative and cooperative relationships between universities and rural sectors are an essential part of the University Extension process, and will be of mutual benefit to all. Morales et al.
[8]
state that modern universities should integrate and connect University Extension programs with research and teaching, and these three functions are important for achieving excellence in academic training. We should ask ourselves, how does the interaction between actors support the production sector? In response to this, Chiriboga
[9]
, states that well-planned and joint projects can achieve successful results in terms of training, services and information aimed at small and medium producers.
Furthermore, taking into account the importance of the FCM variables’ centrality values for decision making, the ULs and APMs research groups’ perceptions do not completely coincide with the five most important variables (State Policies for Rural Development - SPRD, Quality Academic Training - QAT, Innovation and Entrepreneurship Training - IET, National Research and University Extension Program – NRUEP, and Associative Cooperativism – AC). The “credit” variable stated by the APMs groups which replaces the NRUEP variable, shows that academia and the state meet their responsibilities, although it is not perceived as being joined-up work. When considering the opinions of the overall group that was interviewed, with regards to agricultural graduates not returning to where they came from, it is determined that SPRD and QAT are strategies in which the state and academia can play a role by implementing research and university extension programs, to train competent agricultural professionals with innovation and entrepreneurship skills, thus driving associative work in rural areas. In contrast, the APM group believe that credit should be part of SPRD. Amongst other things, this will help to: a) avoid that small agricultural producers become involved in commercial processes that make them depend on ‘chulqueros’ (loan sharks), and fall into spiraling debt that makes them poor, and b) encourage young people to see the agricultural sector as an investment opportunity and source of employment. This is a criteria that is also shared by Bednaríková et al.
[3]
. Similarly, Calabrò and Vieri
[10]
, determine that the creation of sectoral and intersectoral state policies is an integral part of an official rural development strategy for building, supporting and strengthening the agricultural sector, as well as all the areas and employment activities linked to the rural sector.
The agro-industry and agribusiness models that are developed in Ecuador in this era of globalization and debt crisis are persevering with the strengthening of production sectors that supports exports and agro-industry
[11]
. Similarly, the rural environment has been invaded by mining and flower-growing businesses, who are disrupting sustainable production in the rural environment. As a result, academia should debate these topics in order not to give into market demands and target support at creating policies that help small and medium producers. Fullerton
[12]
, states that it is important for universities to be involved with rural communities so that they can improve and guarantee academic training with practical experiences and knowledge of the area, thus driving innovation and entrepreneurship in the rural sector. Similarly, Mojarradi and Karamidehkordi
[13]
, state that contemplating theoretical training with experience and knowledge of the context, will encourage graduates to return to the rural sector, as they will be responsible for the production of food in the near future.
The average centrality value of 1.77 of 5 grouped variables which correspond to Strategies for Rural Development – SFRD, implies that institutions with agricultural development capabilities should start working together to support rural development and achieve common objectives. The average centrality value of 0.41 of 13 variables grouped as Academia and Rural Problems – ARP, does not necessarily imply that these are less important than those grouped as SFRD. However, the highly significant difference (p= 4.03e-08) between the two groups of variables (SFRD and ARP), highlights the need to prioritize the implementation of SFRD, with policies directed at the rural sector and quality academic training in order to meet the needs of the rural production sector. Machado & Salgado
[14]
therefore state that academic work to support the design of policies in terms of effects and impacts, has already been analyzed as a case study. Ramírez & García
[15]
, highlight how joint University-Company-State projects help achieve management, entrepreneurship and project innovation initiatives by working together. However, Lacki
[16], states that if the support and intervention for the development of the rural production sector is left to the sole responsibility of the state, rural products would be immobilized and dependent on external help, without trying to help themselves, combine their collective knowledge and work together. Practical work should help to understand the realities facing an area, so that students are capable of establishing dialogues with the population, with actors from the production system, with business owners, enabling them to come up with their own proposals which are aligned to the reality of the different territories.
, states that if the support and intervention for the development of the rural production sector is left to the sole responsibility of the state, rural products would be immobilized and dependent on external help, without trying to help themselves, combine their collective knowledge and work together. Practical work should help to understand the realities facing an area, so that students are capable of establishing dialogues with the population, with actors from the production system, with business owners, enabling them to come up with their own proposals which are aligned to the reality of the different territories.
References
- Kumar, A.; Kumar, V.A. Pedagogy in Higher Education of Agriculture. Procedia Soc. Behav. Sci. 2014, 152, 89–93.
- Rérat, P. Migration and post-university transition. Why do university graduates not return to their rural home region? Geogr. Helv. 2016, 71, 271–282.
- Bednaríková, Z.; Bavorová, M.; Ponkina, E.V. Migration motivation of agriculturally educated rural youth: The case of Russian Siberia. J. Rural Stud. 2016, 45, 99–111.
- Quarouch, H.; Kuper, M.; Lejars, C. Putting the language of institutions to good use: Farming careers of young rural unemployed university graduates in Morocco’s Saiss region. Cah. Agric. 2015, 24, 349–356.
- Estévez, A. Jóvenes Rurales en Ecuador Grupos de Diálogo Rural, Una Estrategia de Incidencia; Rimisp: Santiago de Chile, Chile, 2017; Volume 224.
- Hidalgo, F.; Lacroix, P.; Román, P. Comercialización y Soberanía Alimentaria, 1st ed.; Agronomes Veterinaires sans Frontière: Quito, Ecuador, 2013; p. 146.
- Rivas, G.; Rovira, S. Nuevas Instituciones Para la Innovación Prácticas y Experiencias en América Latina; CEPAL: Santiago de Chile, Chile, 2014.
- Morales, M.E.; Mira, G.E.; Arias, M.A. Enfoques y Retos de la Función de Extensión Universitaria Como Mecanismo de Integración; Universidad, Empresa, Estado: Bogotá, Colombia, 2010.
- Chiriboga, M. Pequeñas Economías: Reflexiones Sobre la Agricultura Familiar Campesina; Organización de las Naciones Unidas para la Alimentación y la Agricultura: Quito, Ecuador, 2015.
- Calabrò, G.; Vieri, S. Political actions oriented to territorial development: The multifunctional role of agriculture. Amfiteatru Econ. 2015, 17, 1346–1358.
- Quevedo, T. Agroindustria y Concentración de la Propiedad de la Tierra. Elementos para su definición y Caracterización en el Ecuador; Observatorio del Cambio Rural-Instituto de Estudios Ecuatorianos: Quito, Ecuador, 2013.
- Fullerton, C. University-Community Partnerships as a Pathway to Rural Development: Benefits of an Ontario Land Use Planning Project. J. Rural Community Dev. 2015, 10, 56–71.
- Mojarradi, G.; Karamidehkordi, E. Factors influencing practical training quality in Iranian agricultural higher education. J. High. Educ. Policy Manag. 2016, 38, 183–195.
- Machado, A.; Salgado, C. Academia, Actores Sociales y Políticas en el Sector Rural; Universidad Nacional de Colombia, Facultad de Investigaciones para el Desarr: Bogotá, Colombia, 2006; p. 201.
- Ramírez, M.d.P.; García, M. La Alianza Universidad-Empresa-Estado: Una estrategia para promover innovación. Rev. Esc. De Adm. De Neg. 2010, 112–133.
- Lacki, P. Diagnosticos equivocados y soluciones demagógicas están "paralizando" las iniciativas de los productores rurales. Rev. Mvz Córdoba 2005, 10, 507–510.