- mitochondrial genes
- cytochrome b
- 12S rRNA gene
- Anabantoidei
- growth hormone
- reproduction
1. Introduction
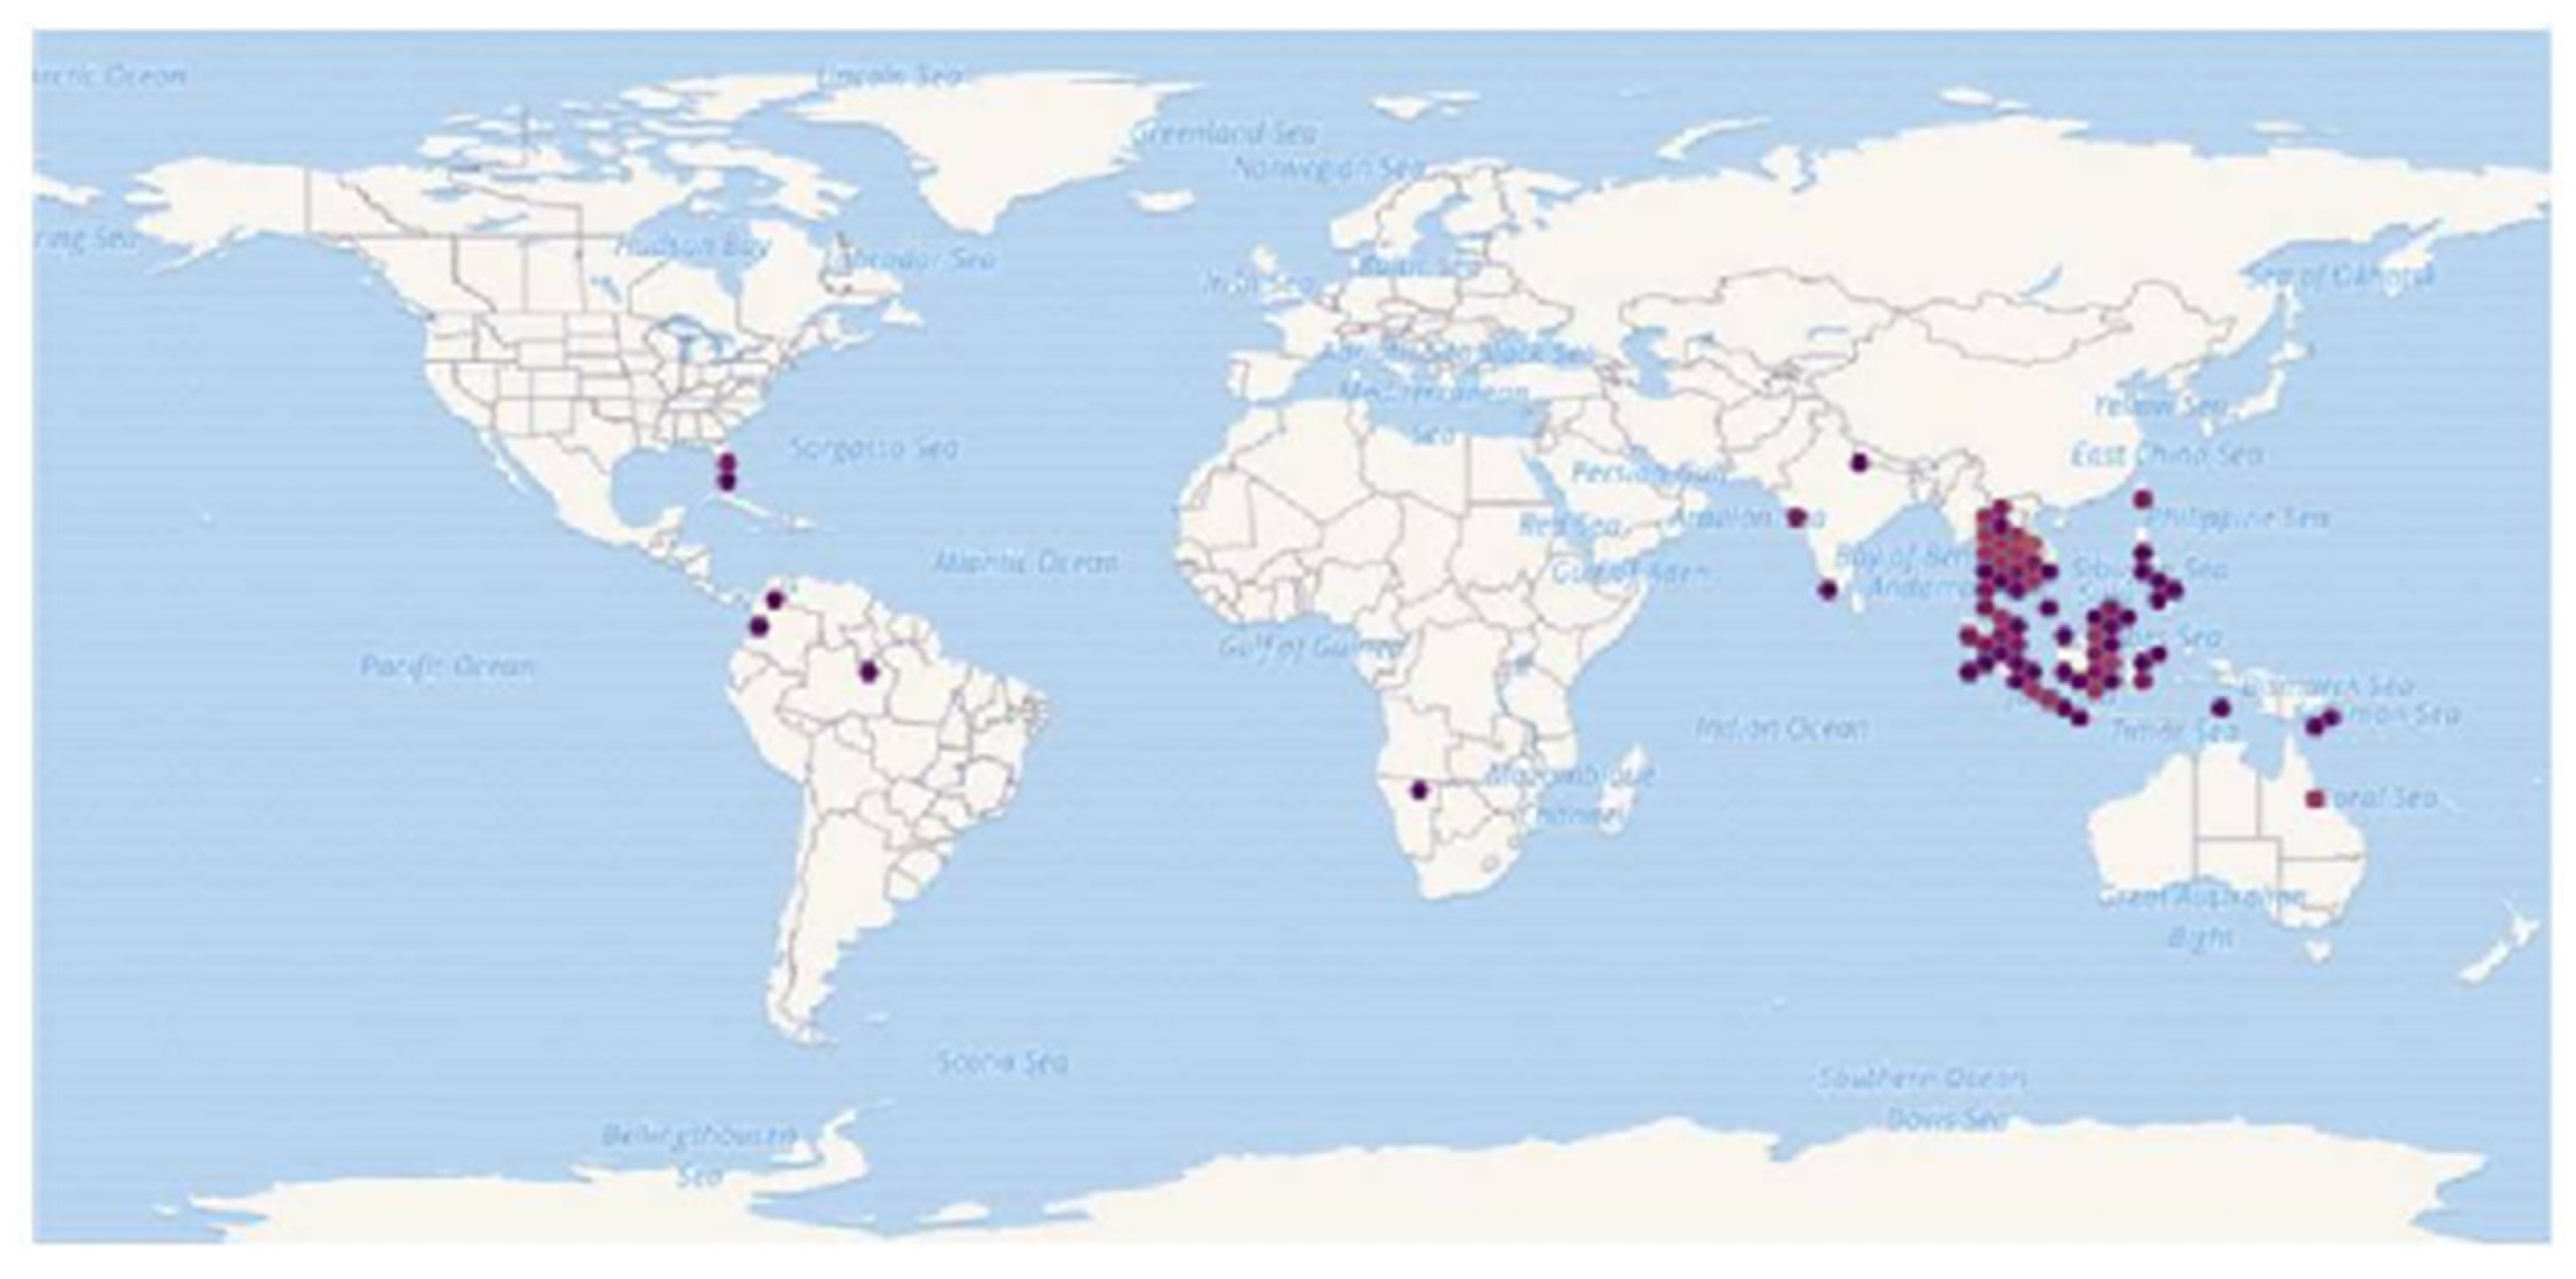
Genetic variability between the organisms refers to sequence differences between their genomes, part of which is reflected in the sequence of protein-coding genes. This variation in DNA sequence can be used as a marker to distinguish between organisms, including fishes, at all systemic levels [1][2][3][4][5][6][7][8]. Compared to the much-studied genetic markers in some fish species of economic value, little research has been done with the group of labyrinth fishes. Anabantoid fishes are geographically distributed in central Africa, India, and southern Asia [9] (Figure 1). In their natural habitat, they adapt to an unpredictable environment in which water-dissolved oxygen concentration varies throughout the year and can reach very low concentration [10]. The 16 known genera of anabantoid fishes contain about 80 species (FishBase, Nelson et al. Fishes of the World [10]). However, the systematic characters of the labyrinth fishes have not been agreed upon and many synonyms are used. According to Vierke [10], taxonomists classify the labyrinth fishes into four families: Anabantidae (genera Sandelia, Ctenopoma, Anabans), Belontiidae (genera Trichopsis, Trichogaster, Sphaerichthys, Pseudosphromenus, Parosphromenus, Malpulutta, Helostoma, Ctenops, Colisa, Betta, Belontia), Osphronemidae (genus Osphronemus), and Helostomatidae (genus Helostoma).

Figure 1. Known global distribution of Trichogaster trichopterus. Locations are in Australia, Papua- New Guinea, Indonesia, Malaysia, the Philippines, Taiwan, Vietnam, Cambodia, Laos, Thailand, Myanmar, India, Namibia, Colombia, Brazil, and the United States. Map from the GBIF Secretariat [11].
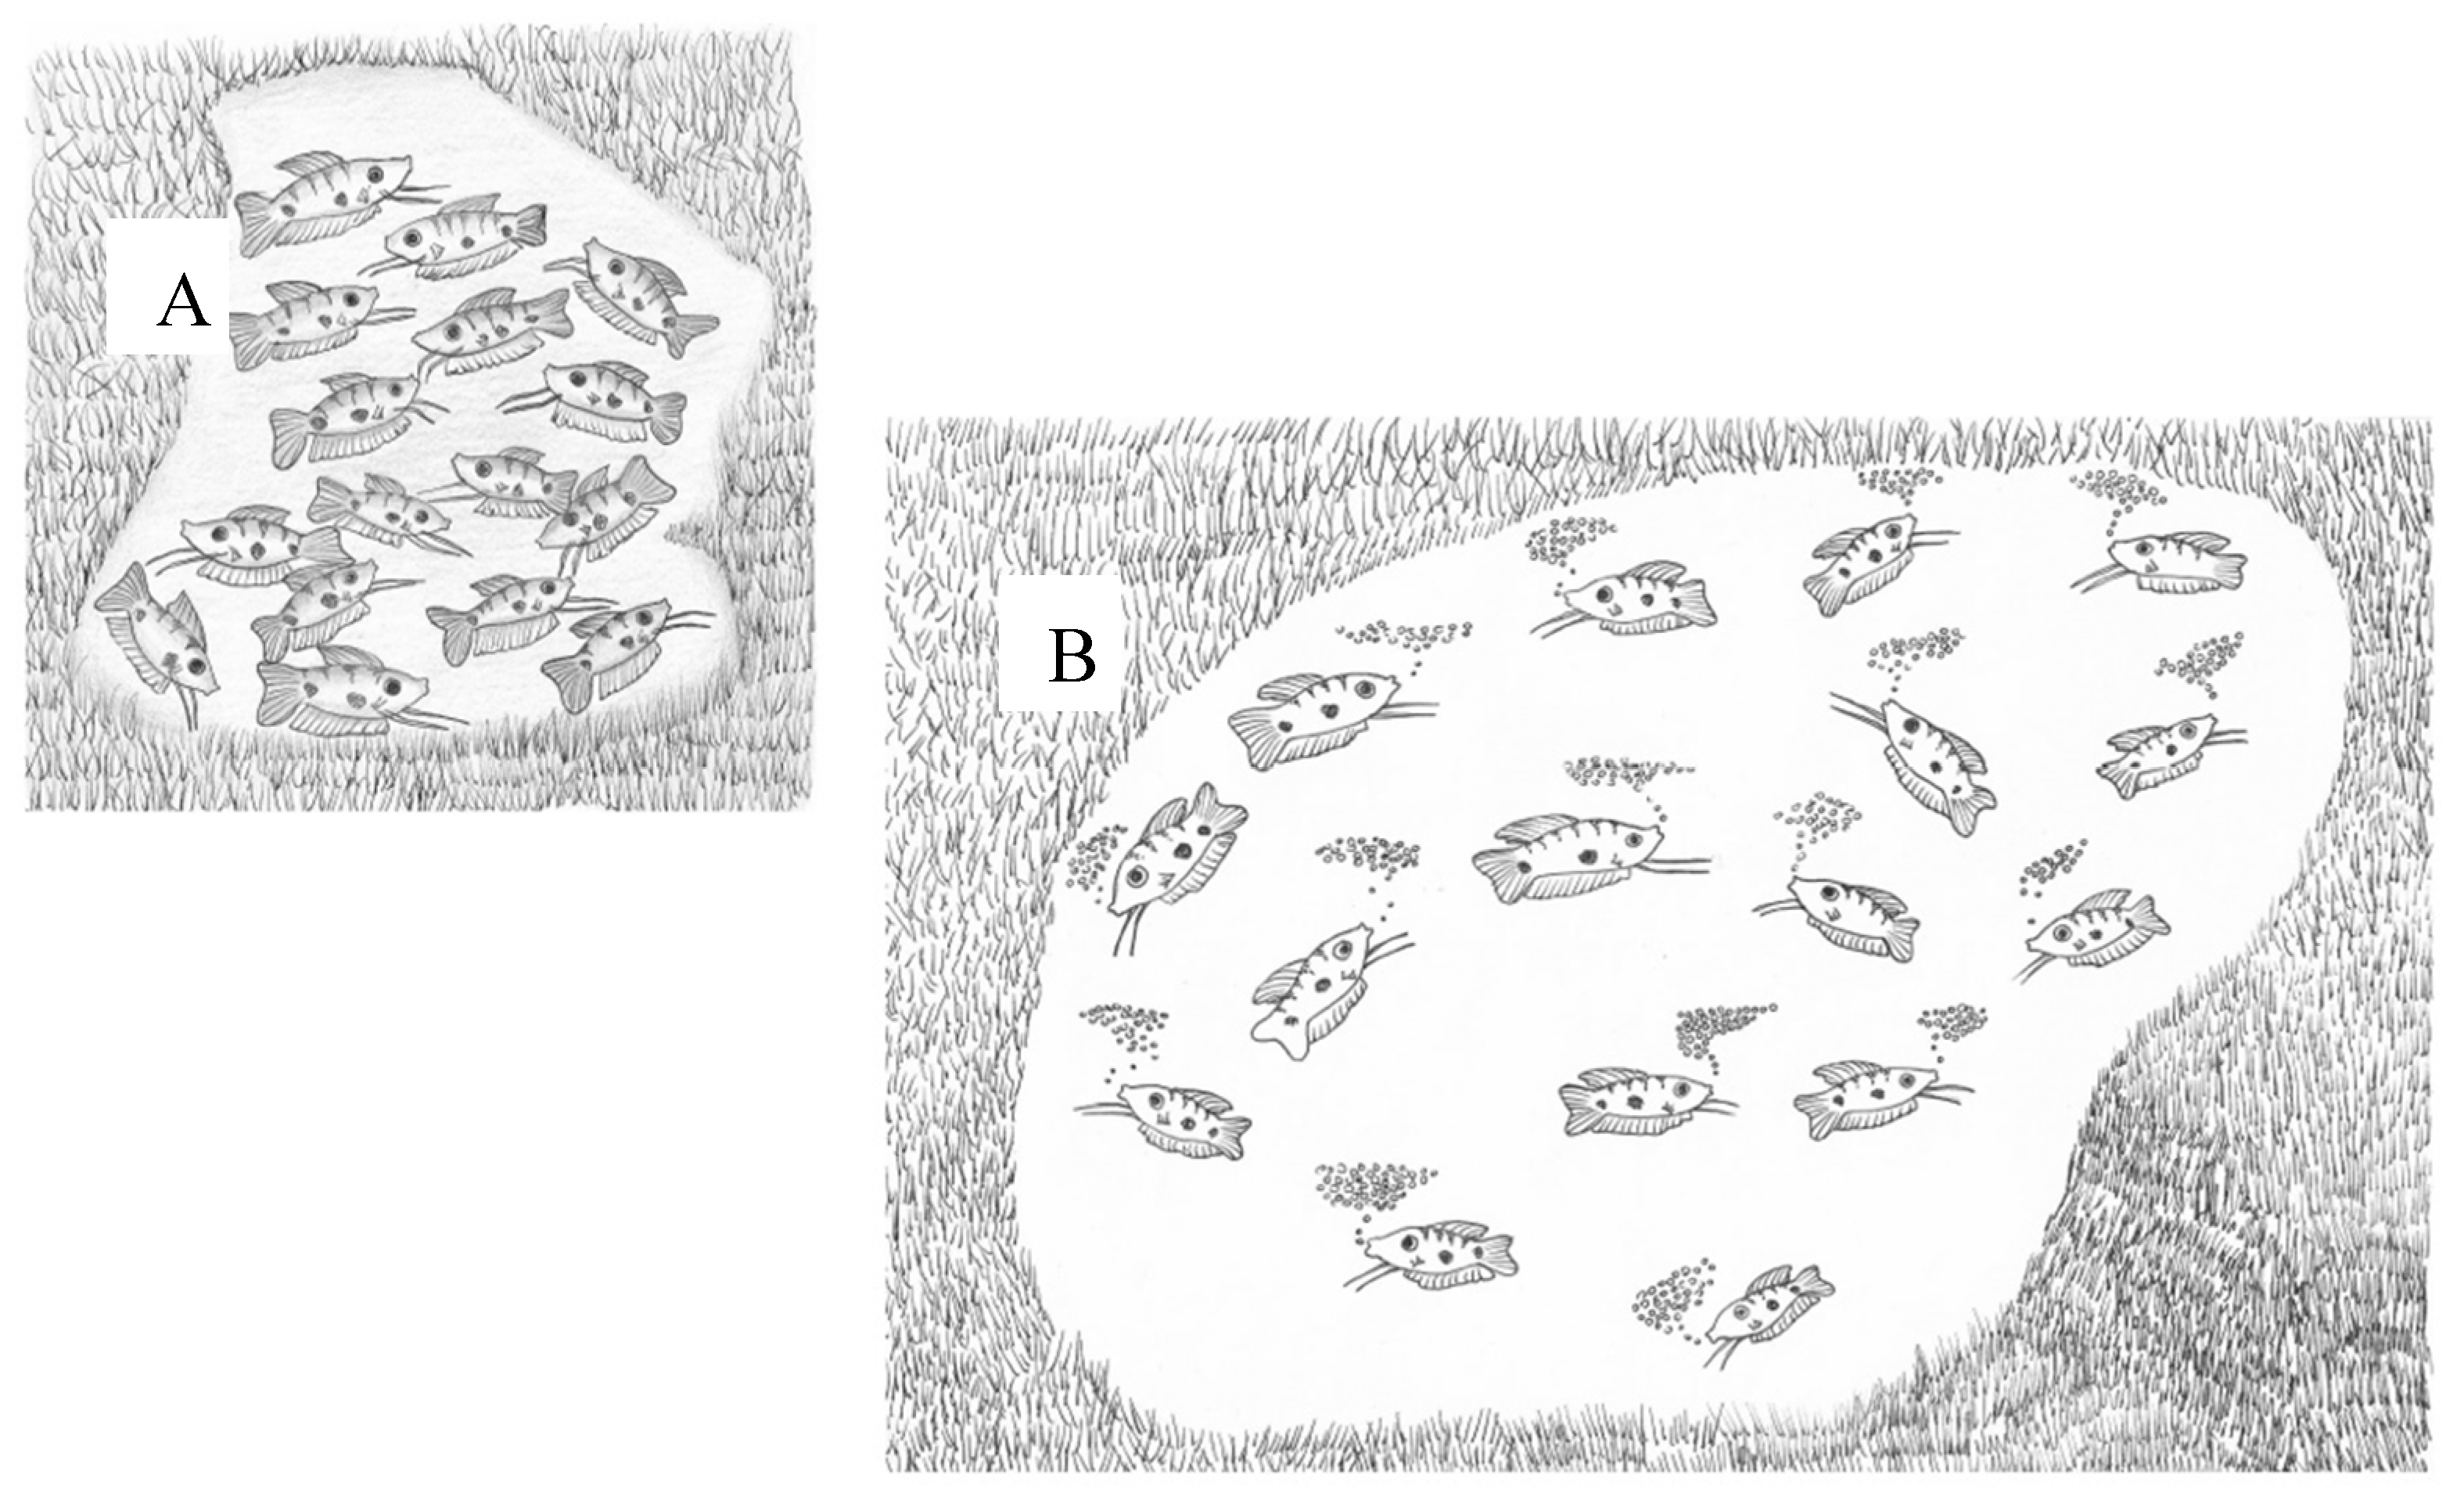
Labyrinth fishes have two different stages in their life cycle: (i) before labyrinth organ development, from eggs to juveniles, when oxygen is absorbed over the entire surface by diffusion; and (ii) after labyrinth development, when the organ becomes important for breathing [10]. The adaptation to the development of eggs and fry in water with low oxygen concentration involves laying eggs in a bubble nest which supplies oxygen to the eggs and larvae [10]. In natural habitats, when there is a low density of mature males, they become territorial by building a bubble nest and protecting it from other males (Figure 2) [12][13].

Figure 2. A scheme of two habitats, with high (A) and low (B) densities of males. At high density, the male does not build a nest. At low density, the male builds a nest and sexual behavior is initiated [10][13][14].
After courting and fertilization, the female swims under the bubble nest and spawns eggs into it. The male guards the nest with the eggs. If an egg falls out, the male returns it to the nest. The male also protects the young fish, immediately after hatching (Figure 3).

Figure 3. Sexual behavior of male blue gourami during the reproductive cycle. (1) The male builds a nest. (2) and (3) The male courts the female under the nest. (4) Fertilization takes place and the fertilized eggs float up and stick to the bubble nest. (5) The male guards the eggs in the nest. (6) The male further protects the fry immediately after hatching while they swim in the nest area [10][13].
Ornamental fish populations in their native habitats, mainly in tropical areas, have declined due to overfishing for their sale on the tropical fish market. Fish of the suborder Anabantoidei are important in the ornamental fish industry and have long been produced in aquaculture [10]. The introduction of T. trichopterus in Florida is considered to have failed, according to US Fish and Wildlife Service, June 2019 [11].
2. Markers of Genetic Variation in Blue Gourami (Trichogaster trichopterus) as a Model for Labyrinth Fish
Genes involved in various growth and reproductive processes may serve as markers of genetic variation between labyrinth fishes of the suborder Anabantoidei and other fish species and groups (Summary, Table 3). The various molecular markers in blue gourami are mitochondrial or nuclear DNA sequences, but not microsatellites or single-nucleotide polymorphisms. In the present review, most of the genetic markers were associated with growth (PACAP, GH and PRL) and reproduction (GnRH1, GnRH2, GnRH3, LH, and FSH). Only two mitochondrial genes (cytochrome b and 12S) were studied. Isozyme markers also have been studied in labyrinth fishes [5]. Thus, one can compare genomic markers with mitochondrial ones. The similarity of cytochrome b sequence between labyrinth and other fish species was between 86% and 46%, and of the 12S rRNA gene, between 91% and 40%. Sequence similarities between the blue gourami and other fish species for the hormone-encoding genes seemed to be lower than for the mitochondrial genes (Table 1). Among the genes involved in controlling growth and reproduction, those with the highest sequence similarity between species were those from the HPS axis. The findings based on DNA sequence comparison presented in this review are in agreement with many other studies [1][2][3][4][5][6][7][8][15][16]. All of the tested genes in blue gourami had high similarity to their counterparts in other fishes in the order Perciformes, to which the blue gourami belongs [10], and some of them can be useful as genetic markers in other classes of fish.
Table 1. Degree of nucleotide sequence similarity (%) of blue gourami (Trichogaster trichopterus) to different species [2][17][18][19][20][21].
| Cytochrome b | Mitochondrial RNA 12S Gene |
Growth Hormone |
Prolactin | PACAP | GnRH1 | GnRH2 | GnRH3 |
|---|---|---|---|---|---|---|---|
| Trichopterus trichopterus (gold) 100% | Trichogaster trichopterus (gold) 100% | Lates calcarifer 84% |
Perca flavescens 79% |
Oreochromis mossambicus 94% |
Thunnus thynnus 74.3% |
Epinephelus bruneus 78.5% |
Dicentrar chus labrax 77.4% |
| Colisa lalia 86.6% |
Trichogaster leeri 91.4% |
Seriola dumerili 84% |
Dicentrarchus labrax 79% |
Gadus morhua 97.4% |
Epinephelu sruneus 72.3% |
Verasper variegatus 74.9% |
Pagrus major 70.2% |
| Trichogaster leerii 86.0% |
Colisa lalia 88.4% |
Sparus aurata 83% |
Sparus aurata 77% |
Takifugu rubripes 97.4% |
Verasper variegatus 70.5% |
Paralichthys olivaceus 73.4% |
Cynoscion nebulosus 58.1% |
| Trichogaster labiosus 85.6% |
Betta betta 82.6% |
Acanthopagrus butcheri 82% |
Paralichthys olivaceus 77% |
Haplocho misburtoni 97.4% |
Oreochromis niloticus 68.2% |
Thunnus thynnus 72.8% |
Rachycentron canadum 57.7% |
| Macropodus opercularis 81.6% |
Colisa chuna 41.4% |
Oreochromis niloticus 79% |
Onchorhynechus mykiss 66% |
Epinephelu soioides 97.4% |
Morone saxatilis 62.6% |
Morone saxatilis 72.2% |
Micropog onias undulates 57.5% |
| Cyprinus carpio 77.9% |
Trichogaster pectoralis 40.5% |
Morone saxatilis 79% |
Coregonus autumnalis 66% |
Fundulus heteroclitus 60.8% |
Odontesthes bonariensis 65.2% |
Sciaenops ocellatus 57.5% |
|
| Betta betta 58.9% |
Cternopoma setherici 41.1% |
Caranx delicatissimus 74% |
Salmo salar 66% |
Mugil cephalus 59% |
Mugil cephalus 65% |
||
| Salmo salar 76.9% |
Macropodus opercularis 41.1% |
Oncorhynchus tshawytscha 69% |
Heteropneustes fossilis 62% |
Coregonus clupeaformis 54.2% |
Fundulus heteroclitus 61.8% |
||
| Trichogaster fasciatus 46.2% |
Osphronemus goramy 40.5% |
Salmon salar 68% |
Ictalurus punctatus 62% |
Odontesthes bonariensis 22.6% |
Coregonus clupeaformis 59.6% |
||
| Pangasius pangasius 64% |
Hypophthalmi chthys molitrix 62% |
||||||
| Pangasinodon gigas 64% |
Danio rerio 61% |
||||||
| Cyprinus carpio 64% |
Cyprinus carpio 61% |
||||||
| Carassius auratus 63% |
Anguilla japonica 59% |
For example, the cytochrome b sequence was used to study genetic variation of the genus Capoeta and specifically the species C. damascina [16][22]. C. damascina is one of the most common freshwater fish species found in a wide range of isolated water bodies throughout the Levant, Mesopotamia, Turkey, and Iran. Prior to these studies, C. damascina was not a well-defined species. Likewise, the COI gene is widely used in assessing genetic variation in both geographical distribution and aquaculture contexts [23][24]. This gene is suitable for the separation of different species belonging to the genus Trichogaster, but not of the order Anabantiformes.
References
- Maqsood, H.M.; Ahmad, S.M. Advances in molecular markers and their applications in aquaculture and fisheries. Genet. Aquat. Organ. 2017, 1, 27–41.
- Degani, G. Mitochondrial DNA sequence analysis in Anabantoidei fish. Adv. Biol. Chem. 2013, 3, 347–355.
- Okumus, F.; Ciftci, Y. Fish population genetics and molecular markers II molecular markers and their applications in fisheries and aquaculture. Turk. J. Fishe. 2020, 51–79.
- Degani, G.; Alon, A.; Hajouj, A.; Meerson, A. Vitellogenesis in the blue gourami (Trichogaster trichopterus) is accompanied by changes in the brain transcriptome. Fishes 2019, 4, 54.
- Degani, G.; Veit, M. Electrophoretic variations of isozyme systems in the muscle and liver of Anabantidae fish. Isr. J. Aquacul. 1990, 42, 67–76.
- Chauhan, T.; Rajiv, K. Molecular markers and their applications in fisheries and aquaculture Advan. Biosc. Biotechn. 2010, 1, 281–291.
- Degani, G.; Jackson, K.; Yom-Din, S.; Goldberg, D. cDNA cloning and mRNA expression of growth hormone in Belontiidae (Anabantoidei suborder) fish. Isr. J. Aquacul. 2006, 58, 124–136.
- Degani, G.; Hurvitz, A.; Eliraz, Y.; Meerson, A. Sex-related gonadal gene expression differences in the Russian sturgeon (Acipenser gueldenstaedtii) grown in stable aquaculture conditions. Anim. Reprod. Sci. 2019, 199, 75–85.
- Forselius, S. Studies of anabantid fishes. Parts I, II, III. Zoologiska Bidrag Fran Uppsala 1975, 32, 597.
- Vierke, J. Betta Gouramis and Other Anabantoid labyrinth Fishes of the World; T.F.H. Publication: Neptune, NJ, USA, 1988; pp. 1–102.
- Froese, R.; Pauly, D. Trichopodus trichopterus (Pallas, 1770). FishBase 2019. Trichogaster labiosus distribution U.S. Fish and Wildlife Service. Available online: (accessed on 29 February 2021).
- Degani, G. The effect of temperature, light, fish size and container size on breeding of Trichogaster Trichopterus Isr. J. Aquacul. 1989, 41, 67–73.
- Degani, G.; Ziv, Z. Male blue gourami (Trichogaster trichopterus) nest-building behavior is affected.by other males and females. Open J. Anim. Sci. 2016, 6, 195–201.
- Degani, G. The effect of sexual behavior on oocyte development and steroid changes in Trichogaster Trichopterus. Copeia 1993, 4, 1091–1096.
- Degani, G.; Yom-Din, S.; Hurvitz, A. Transcription of insulin-like growth factor receptor in russian sturgeon (Acipenser Gueldenstaedtii) ovary during oogenesis. Univers. J. Agric. Res. 2017, 5, 119–124.
- Degani, G. DNA Variation of Capoeta damascina (Valenciennes, 1842) in three rivers in northern Israel. J. Biophys. Chem. 2014, 5, 107–117.
- Levy, G.; Gothilf, Y.; Degani, G. Brain gonadotropin releasing hormone3 expression variation during oogenesis and sexual behavior and its effect on pituitary hormonal expression in the blue gourami. Com. Biochem. Physio. Part A 2009, 154, 241–248.
- Yom Din, S.; Hurvitz, A.; Goldberg, D.; Jackson, K.; Levavi-Sivan, B.; Degani, G. Cloning of Russian sturgeon (Acipenser gueldenstaedtii) growth hormone and insulin-like growth factor 1 and their expression in male and female fish during the first period of growth. J. Endocrinol. Investig. 2008, 31, 201–210.
- Levy, G.; Goldberg, D.; Jackson, K.; Degani, G. Association between pituitary adenylate cyclase activating polypeptide and reproduction in the blue gourami. Gen. Comp. Endo. 2010, 166, 83–93.
- Goldberg, D.; Jackson, K.; Yom-Din, S.; Degani, G. Growth hormone of Trichogaster trichopterus: cDNA cloning, sequencing and analysis of mRNA expression during oogenesis. J. Aqua. Trop. 2004, 19, 215–229.
- Degani, G.; Yom-Din, S.; Goldberg, D.; Jackson, K. cDNA cloning of blue gourami (Trichogaster trichopterus) prolactin and its expression during the gonadal cycles of males and females. J. Endocrinol. Investig. 2010, 33, 7–12.
- Levin, B.A.; Freyhof, J.; Lajbner, Z.; Perea, S.; Abdoli, A.; Gaffaroglu, M.; Ozulug, M.; Rubenyan, H.R.; Salnikov, V.B. and Doadrio, I. Phylogenetic relationships of the algae scraping cyprinid genus Capoeta (Teleostei Cyprinidae). Mol. Phylogenetics Evol. 2012, 62, 542–549.
- Syaifudin, M.; Jubaedah, D.; Yonarta, D.; Hastuti, Z. DNA barcoding of snakeskin gourami Trichogaster pectoralis and blue gourami Trichogaster trichopterus based on cythocrome c oxidase subunit I (COI) gene. Earth. Enviro. Sci. 2019, 348, 012031.
- Ratnasingham, S.; Hebert, P.D. Bold: The Barcode of Life Data System (). Mol. Ecol. Notes. 2007, 7, 355–364.
