Head–Neck Cancer (HNC) has a relevant impact on the oncology patient population and for this reason, the present review is dedicated to this type of neoplastic disease. In particular, a collection of methods aimed at tumor delineation is presented, because this is a fundamental task to perform efficient radiotherapy.
- head–neck cancer (HNC)
- head and neck squamous cell carcinoma (HNSCC)
- nasopharyngeal cancer (NPC)
1. Introduction
Head and Neck Squamous Cell Carcinoma (HNSCC) or Head and Neck Carcinoma (HNC) is one of the most common malignancies by incidence worldwide and includes cancers of the upper aerodigestive tract (oral cavity, oropharynx, hypopharynx and larynx and so on) [1,2,3][1][2][3]. The onset of the disease could be due to various factors: hpv infection [4], genetic inheritance, ingestion or inhalation of harmful substances both voluntarily (tobacco and alcohol [5]) and involuntarily, in case of exposure to toxic substances dispersed in the environment [6]. Patients affected by inoperable HNC must be treated with radiotherapy (RT), so the delineation of tumors and metastatic limph nodes is a fundamental task of RT planning and it must be performed on radiological images, usually Positron Emission Tomography (PET) and Computerized Tomography (CT) scans. PET scan is a non-invasive radiological examination regarding functional imaging, which reveals metabolic changes of the tissues providing in vivo important measurements about cancer’s biological evolution. Such an examination can be performed only after administering a radiotracer to the patient. A typical PET radiotracer used in the evaluation process of HNC is the glucose analog 18F-fluoro-2-deoxy-D-glucose (FDG), which is a weak radioactive substance. High metabolic rate tissue, like cancer, increases its FDG uptake, which is revealed by detectors. The detection of a high concentration of FDG reveals primary cancers and metastases appearing as “hot spots” surrounded by “cold” non-pathological tissue in a PET image. As a consequence, PET images are preferred to CT scans for their high-contrast between cancers and the rest of the tissues, but they exhibit a low spatial resolution. CT scan is a common medical imaging procedure combining a number of X-ray measurements performed at different angles. The resulting image is a cross-sectional view (slice) of a volume revealing the morphology of the internal organs: a bright pixel represents a high-density volume element, whereas a dark pixel is associated with a low-density one, so an appropriate contrast medium must be used to visualize particular parts of the human body. Despite a high spatial resolution, the contrast of such images is low for the HNC. For this reason, often the methods make use of multi-modal data (usually PET-CT) to compensate for the respective lack of image features (spatial resolution for PET, low contrast for CT). Often these images are merged to create a new image that is used for tumor delineation. Recently, Magnetic Resonance (MR) scans have been considered for the HNC. MR Imaging (MRI) makes use of an intense magnetic field and electromagnetic waves to obtain detailed images of the organs and tissues of the human body. Like a CT scan, it provides a cross-sectional view of the human body and can produce images with different contrast among the tissues in the function of the type of electromagnetic waves (T1-weighted, T2-weighted and so on). Even if it exhibits a good spatial resolution and the contrast among tissues is better than CT, it is not sufficient to distinguish the neoplastic tissue from the surrounding one, so also in this case MR is used in combination with PET [7,8][7][8]. The usefulness of using PET and MRI combined together in the evaluation of head and neck cancers is also investigated in the study of Kogaczewska et al. [9]. In the end, the delineation of tumors is a task making use of multi-modality imaging but, when it is manually performed, it incurs several problems: it is time-consuming, labour-intensive and prone to inter- and intra-observer variations [10,11][10][11]. In Figure 1 the comparison among PET, CT and MR images are shown. As a consequence, the manual inconsistency affects the result of a hand-made segmentation and for the same reason the gold standard is affected by the same issues, because it is often obtained by manual segmentation.

Figure 1. Head–Neck cancer, transverse plane. The arrows indicate the lesions. Left: (A) Positron Emission Tomography (PET) (B) Computerized Tomography (CT) [12]. Right: (A) PET (B) T1-weighted Magnetic Resonance Imaging (MRI) [13].
2. Convolutional Neural Network CNN
Convolutional Neural Networks are a specific case of feed-forward neural networks. They are made of neurons with learnable weights and biases, just like classic neural networks. The CNNs take images as input, assigning importance to various aspects in the image and differentiating one from the other. A CNN can successfully capture the spatial and temporal dependencies in an image by applying relevant filters which are adjusted during the training phase to understand the features of the image better. The Convolution Operation aims to extract the high-level features from the input image, the low-level features are generally extracted in the first layers, whereas the last layers extract higher level features.
3. Pooling Layer
Another important concept is the pooling layer, which produces a summary statistic of its input in order to reduce the spatial dimension of the feature map. The max-pooling reports the maximal values in each rectangular neighborhood of each point (i,j), the average pooling reports the average values.
4. Optimizers
All the methods based on deep learning use an optimization algorithm. It changes the neural network parameters in order to reduce the loss function and providing the most accurate results possible. The most used optimizers are the Stochastic Gradient Descent (SGD) and the Adaptive Moment Estimation (Adam) [14]. The SGD algorithm is an approximation of Gradient Descent (GD), since it substitutes the exact value of the gradient in the cost function with an estimated value obtained by evaluating the gradient only on a subset of the addends. For this reason, it is less computationally expensive than the GD algorithm. The Adam optimizer is an extension of the SGD that has recently seen broader adoption for deep learning applications. While SGD, in the standard implementation, maintains a single learning rate for all weight updates and it does not change during the training, Adam computes different learning rates for different parameters, it uses estimations of the first and second moments of the gradient to adapt the learning rate for each weight of the neural network. The n-th momentum of a random variable is defined as the expected value of that variable to the power of n. Specifically, Adam computes an exponential moving average of the gradient and the squared gradient, and the parameters and
control the decay rates of these moving averages.
5. Dice Similarity Coefficient (DSC)
In order to evaluate the accuracy of each method, they are compared using the same metric, which is the Dice Similarity Coefficient (DSC). In particular, this coefficient is applied to Boolean data, using the definition of true positive (TP), false positive (FP) and false negative (FN) and it can be written as
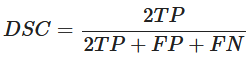
It represents the Harmonic Mean of Precision and Recall. It means that the DSC directly depends on both precision and recall. The DSC penalizes models in which the accuracy hangs mainly on one of the metrics between precision and recall. For this reason, DSC is generally the most used metric for describing the performance of a model.
References
- Fitzmaurice, C.; Allen, C.; Barber, R.M.; Barregard, L.; Bhutta, Z.A.; Brenner, H.; Dicker, D.J.; Chimed-Orchir, O.; Dandona, R.; Dandona, L.; et al. Global, Regional, and National Cancer Incidence, Mortality, Years of Life Lost, Years Lived with Disability, and Disability-Adjusted Life-years for 32 Cancer Groups, 1990 to 2015. JAMA Oncol. 2017, 3, 524.
- Bray, F.; Ferlay, J.; Soerjomataram, I.; Siegel, R.L.; Torre, L.A.; Jemal, A. Global cancer statistics 2018: GLOBOCAN estimates of incidence and mortality worldwide for 36 cancers in 185 countries. CA Cancer J. Clin. 2018, 68, 394–424.
- Global Burden of Disease Cancer Collaboration. Global, Regional, and National Cancer Incidence, Mortality, Years of Life Lost, Years Lived With Disability, and Disability-Adjusted Life-Years for 29 Cancer Groups, 1990 to 2016: A Systematic Analysis for the Global Burden of Disease Study. JAMA Oncol. 2018, 4, 1553–1568.
- Bisht, M.; Bist, S. Human papilloma virus: A new risk factor in a subset of head and neck cancers. J. Cancer Res. Ther. 2011, 7, 251.
- Do, K.A.; Johnson, M.M.; Doherty, D.A.; Lee, J.J.; Wu, X.F.; Dong, Q.; Hong, W.K.; Khuri, F.R.; Fu, K.K.; Spitz, M.R. Second primary tumors in patients with upper aerodigestive tract cancers: Joint effects of smoking and alcohol (United States). Cancer Causes Control 2003, 14, 131–138.
- Galbiatti, A.L.S.; Padovani-Junior, J.A.; Maníglia, J.V.; Rodrigues, C.D.S.; Érika Cristina, P.; Goloni-Bertollo, E.M. Head and neck cancer: Causes, prevention and treatment. Braz. J. Otorhinolaryngol. 2013, 79, 239–247.
- Loeffelbein, D.J.; Souvatzoglou, M.; Wankerl, V.; Martinez-Möller, A.; Dinges, J.; Schwaiger, M.; Beer, A.J. PET-MRI Fusion in Head-and-Neck Oncology: Current Status and Implications for Hybrid PET/MRI. J. Oral Maxillofac. Surg. 2012, 70, 473–483.
- Becker, M.; Zaidi, H. Imaging in head and neck squamous cell carcinoma: The potential role of PET/MRI. Br. J. Radiol. 2014, 87, 20130677.
- Samolyk-Kogaczewska, N.; Sierko, E.; Dziemiańczyk-Pakieła, D.; Nowaszewska, K.B.; Lukasik, M.; Reszec, J. Usefulness of Hybrid PET/MRI in Clinical Evaluation of Head and Neck Cancer Patients. Cancers 2020, 12, 511.
- Riegel, A.C.; Berson, A.M.; Destian, S.; Ng, T.; Tena, L.B.; Mitnick, R.J.; Wong, P.S. Variability of gross tumor volume delineation in head-and-neck cancer using CT and PET/CT fusion. Int. J. Radiat. Oncol. Biol. Phys. 2006, 65, 726–732.
- Gudi, S.; Ghosh-Laskar, S.; Agarwal, J.P.; Chaudhari, S.; Rangarajan, V.; Paul, S.N.; Upreti, R.; Murthy, V.; Budrukkar, A.; Gupta, T. Interobserver Variability in the Delineation of Gross Tumour Volume and Specified Organs-at-risk During IMRT for Head and Neck Cancers and the Impact of FDG-PET/CT on Such Variability at the Primary Site. J. Med. Imaging Radiat. Sci. 2017, 48, 184–192.
- Ong, S.C.; Schöder, H.; Lee, N.Y.; Patel, S.G.; Carlson, D.; Fury, M.; Pfister, D.G.; Shah, J.P.; Larson, S.M.; Kraus, D.H. Clinical Utility of 18F-FDG PET/CT in Assessing the Neck After Concurrent Chemoradiotherapy for Locoregional Advanced Head and Neck Cancer. J. Nucl. Med. 2008, 49, 532–540.
- Ng, S.H.; Yen, T.C.; Liao, C.T.; Chang, J.T.C.; Chan, S.C.; Ko, S.F.; Wang, H.M.; Wong, H.F. 18F-FDG PET and CT/MRI in Oral Cavity Squamous Cell Carcinoma: A Prospective Study of 124 Patients with Histologic Correlation. J. Nucl. Med. 2005, 46, 1136–1143.
- Kingma, D.P.; Ba, J. Adam: A Method for Stochastic Optimization. arXiv 2017, arXiv:1412.6980.