Electron Paramagnetic Resonance, EPR is resonance absorption of microwave quanta by electron spins placed in a swept external magnetic field B at a definite value of magnetic field. Other used names are Electron Magnetic Resonance, EMR and Electron Spin Resonance, ESR.
- paramagnetic ion
- electron paramagnetic resonance
- electron nuclear double resonance
1. Idea
An electron is characterized by electric charge,
-e
, mass,
m
, vectors of the momentum,
p
, and the magnetic momentum,
μ
that is related to the vector of the electron spin
S
:
μ
=-
gμBS
, where μ
B
is the elementary magnetic moment, and the coefficient
g
is called
g
-factor or a factor of spectroscopic splitting.
Being placed in the external magnetic field
B
, the magnetic moment has a precession with the Larmor angular frequency
ω=gμBB
. The higher is B, the higher is ω (Fig 1). The projection of the magnetic moment vector on the direction of the magnetic field
B
is constant and equal to -1/2 of the length of the vector. The energy
E
of its interaction with the magnetic field
is equal to -μB=gμBSB=-gμBB/2.
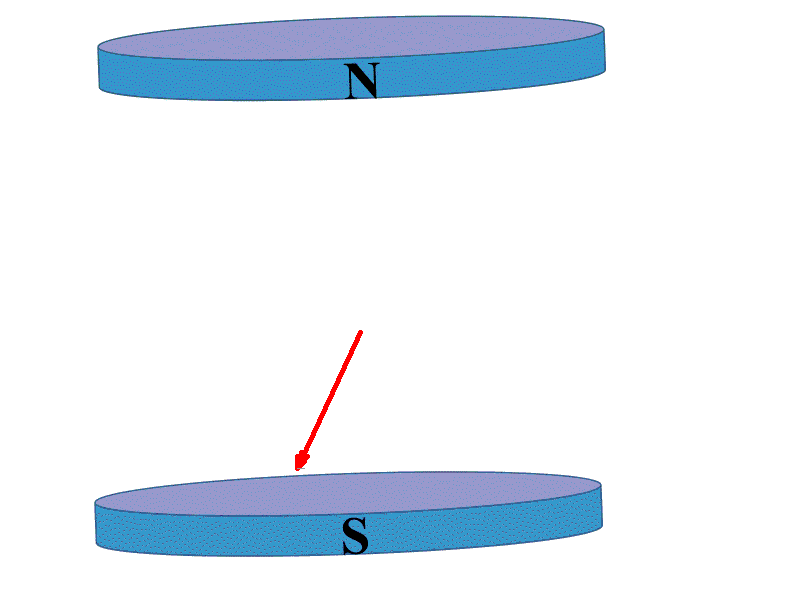
Figure 1.
Precession of the electron magnetic moment in the swept magnetic field.
For easily available magnetic fields about 0.3÷1 Tesla, the corresponding linear frequency
ν
=
ω
/2
π
is about 9÷35 GHz (microwave region of electromagnetic wave spectrum).
If the precessing magnetic moment is irradiated with electromagnetic waves with the frequency ω
1
, there is a magnetic field
Bres
at which ω ≈ ω
1
. An interaction with the magnetic component of electromagnetic wave
B1
leads to the change of precession behavior of the magnetic moment (Fig. 2). When
B
approaches
Bres
the detector registers a sharp increase of electromagnetic wave absorption, i.e. a resonance.
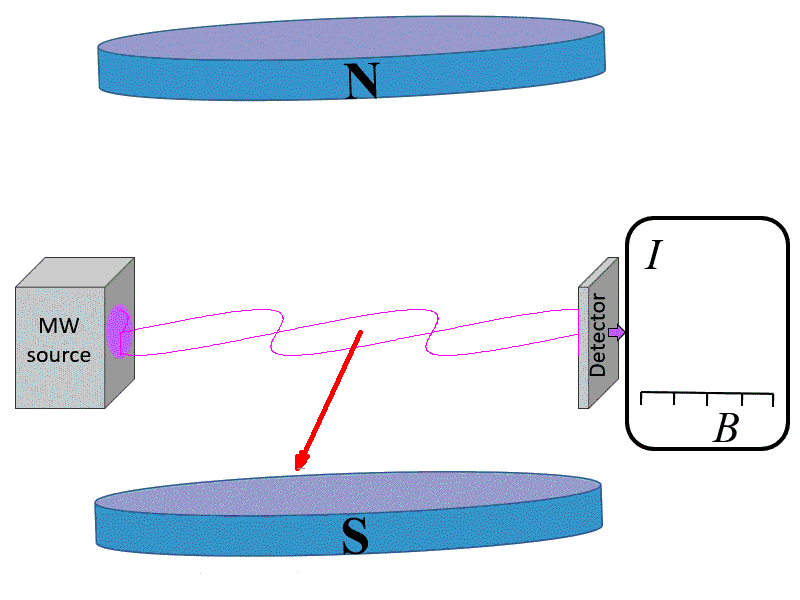
Figure 2.
Resonance absorption of electromagnetic waves at some value of the swept magnetic field
Bres
.
The resonance corresponds to a transition of the magnetic moment from the precession with its projection directed down (the state with lowest energy or ground spin state,
E-1/2
=-
gμBB
/2) to the precession with the projection directed up (the state with highest energy or excited spin state,
E1/2
=
gμBB
/2).
To make the picture of EPR a little more realistic, let’s consider a system of 10
6
÷10
16
spins and introduce populations of the states
P-1/2
and
P1/2
. If the ensemble is in a thermodynamic equilibrium with the surrounding bath kept at temperature
T
, then the states are populated according to the Boltzmann distribution rule
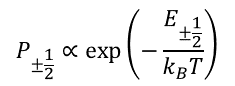
(1)
where
kB
is Boltzmann constant. An interaction of a spin with the bath (collisions with surrounding atoms or molecules in gases and liquids, lattice vibrations in solids) causes random
up or down flips of the spin. When the magnetic field changes, this interaction restores the equilibrium populations of energy states of the spin systems (relaxation process, Fig. 3).
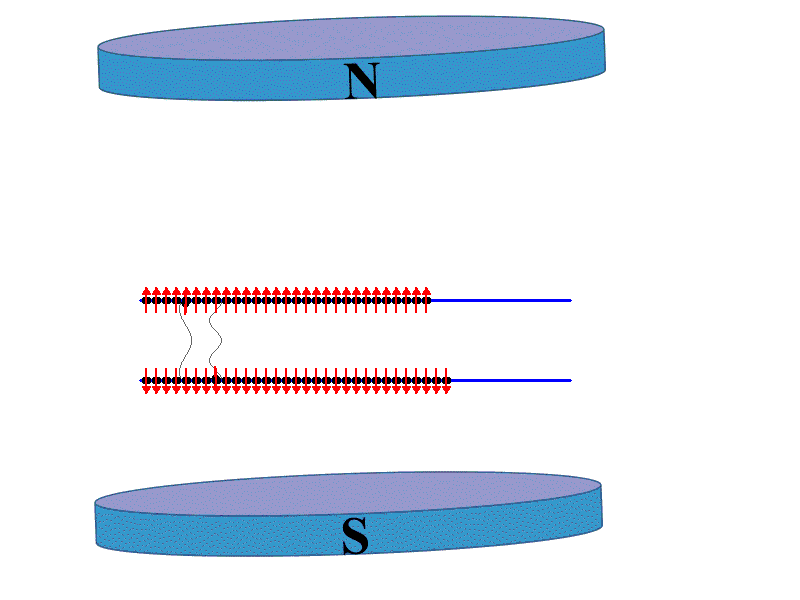
Figure 3.
Relaxation processes that establish Boltzmann populations of the two energy states.
Therefore, the detected
resonance signal called a line is a result of a competition of resonance absorption that tends to equalize (or even invert) populations of the energy states and random relaxation processes (Fig. 4).
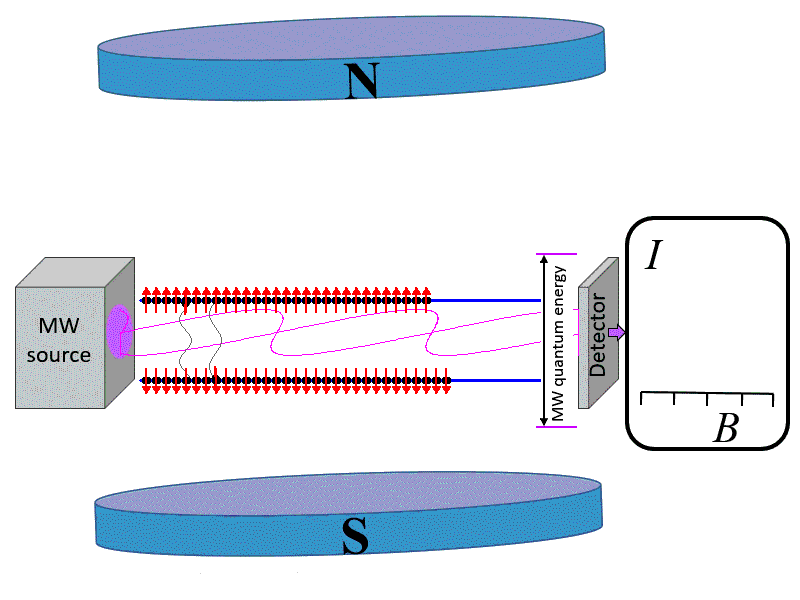
Figure 4.
Competition of the resonance absorption and relaxation.
To decrease the ‘signal to noise’ ratio, a small additional magnetic field modulated with frequency about 10÷100 kHz is usually added, and the detector registers a synchronized signal with the same modulation frequency that looks as the first derivative of the absorption
[1]
,
[2]
. If a high quality resonance cavity is used for EPR measurements, the signal can be enhanced several thousand times.
The described above representation of EPR is visual, but oversimplified one. The Bohr magneton
μB
=
eħ/2mc
, where
e
is the elementary charge,
ħ
is the Planck constant (
ħ=h
/2
π
),
m
is the electron mass, and
c
is the speed of light. T
he μB=0 If ħ=0 or c=∞: magnetism does not exist in non-relativistic classical mechanics. Simplified description does not work for more complicated systems of many electron atoms and ions interacting with nuclei. Therefore, relativistic quantum mechanics is required for detailed description of EPR.
2. Spin-Hamiltonian
Properties of electrons of an atom or ion in magnetic fields can be described with the help of a Hamiltonian operator, which depend on space coordinates and spins and includes interactions of electrons with surrounding electric fields of molecules or crystals, spin-orbital and spin-spin interactions. The Hamiltonian must reflect the symmetry of the described spin system. As splitting of an electronic state in magnetic fields is determined only by spin coordinates, the total Hamiltonian can be averaged over coordinate parts of the state wave functions,
giving the so-called spin-Hamiltonian consisting
of spin operators with some coefficients. Precise values of these coefficients can be evaluated by labor-consuming calculations of 2-4 orders of perturbation theory used matrix elements of orbital moment operators and intervals between energy states. The procedure was developed many decades ago and helped to lay background for the use of spin-Hamiltonian.
At present, the problem of the description of EPR spectra splits up in two tasks:
- A phenomenological spin-Hamiltonian is constructed from operators of axial vectors of spins and magnetic field solely on the basis of symmetry considerations – time reversal, space rotations and reflections. The coefficients at the operators are considered as parameters, which are determined from comparison of observed resonance fields with those predicted on the base of the spin-Hamiltonian.
- Evaluation of the spin-Hamiltonian parameters from the first principles.
Gases or liquids are invariant to any space rotations and reflection. Therefore, all expressions in the spin-Hamiltonian must be isotropic scalars and invariant to time reversal. Splitting of energy states in magnetic field (Zeeman splitting) can be described by
H
=
gμBBS
, (2)
where
S
is the operator of the electron spin (three matrices for
Sx
,
Sy
, and
Sz
), and
g
-factor is a scalar parameter. The spin-Hamiltonian is a matrix of 2
S
+1 rank. In the case of one electron with spin quantum number
S
=1/2 the energy states can be obtained from a solution of a master equation for the 2×2 spin-Hamiltonian matrix. The energies of the states are characterized by quantum numbers
M=
±1/2:
EM
=
gμBBM
. A probability of a stimulated transition between these energy states is calculated using matrix elements of the operator
H1(t)=gμBB1(t)S, (3)
where B1(t) is the magnetic component of the microwave electromagnetic field. The maximal probability (and correspondingly, EPR signal intensity) occurs if B1ꓕB.
From the condition of resonance
EM
-
EM-1
=
gμBB=hν1,
(4)
it follows that
Bres
=
hν1/gμB
. (5)
The expression allows to find the g-factor by measurements of
Bres
and
ν1
.
If an electron interacts with one nucleus with nuclear spin
I
=1/2 (like in the case of hydrogen atom, H
0
), the spin-Hamiltonian is
H
=
gμBBS-gnμnBI+aSI
. (6)
Here
I
is the operator of the nuclear spin,
gn
is the nuclear
g
-factor (
gn
factors for all nuclei are already tabulated),
μn
=
eħ/2mpc
is the nuclear magneton,
mp
is the proton mass, and
a
is a characteristic of the interaction of electron and nuclear spins called the hyperfine constant that is proportional to electron density on the nucleus. The matrix of the spin-Hamiltonian (6) has the rank (2
S
+1)×(2
I
+1)=4, and for
S
=
I
=1/2 its four energy states are characterized by two quantum numbers:
M
=±1/2 and
m
=±1/2. For high magnetic fields
EMm
≈
gμBBM-gnμnBm+aMm.
(7)
The operator
H1(t)
causes transitions between energy states with different electron quantum numbers, but with the same nuclear quantum number
m
, i.e. selection rules for observed resonance transitions are Δ
M
=±1, Δ
m
=0. Therefore, there are two transitions and two resonance lines in the observed spectrum (Fig. 5). This allows to determine both
g
and
a
parameters.
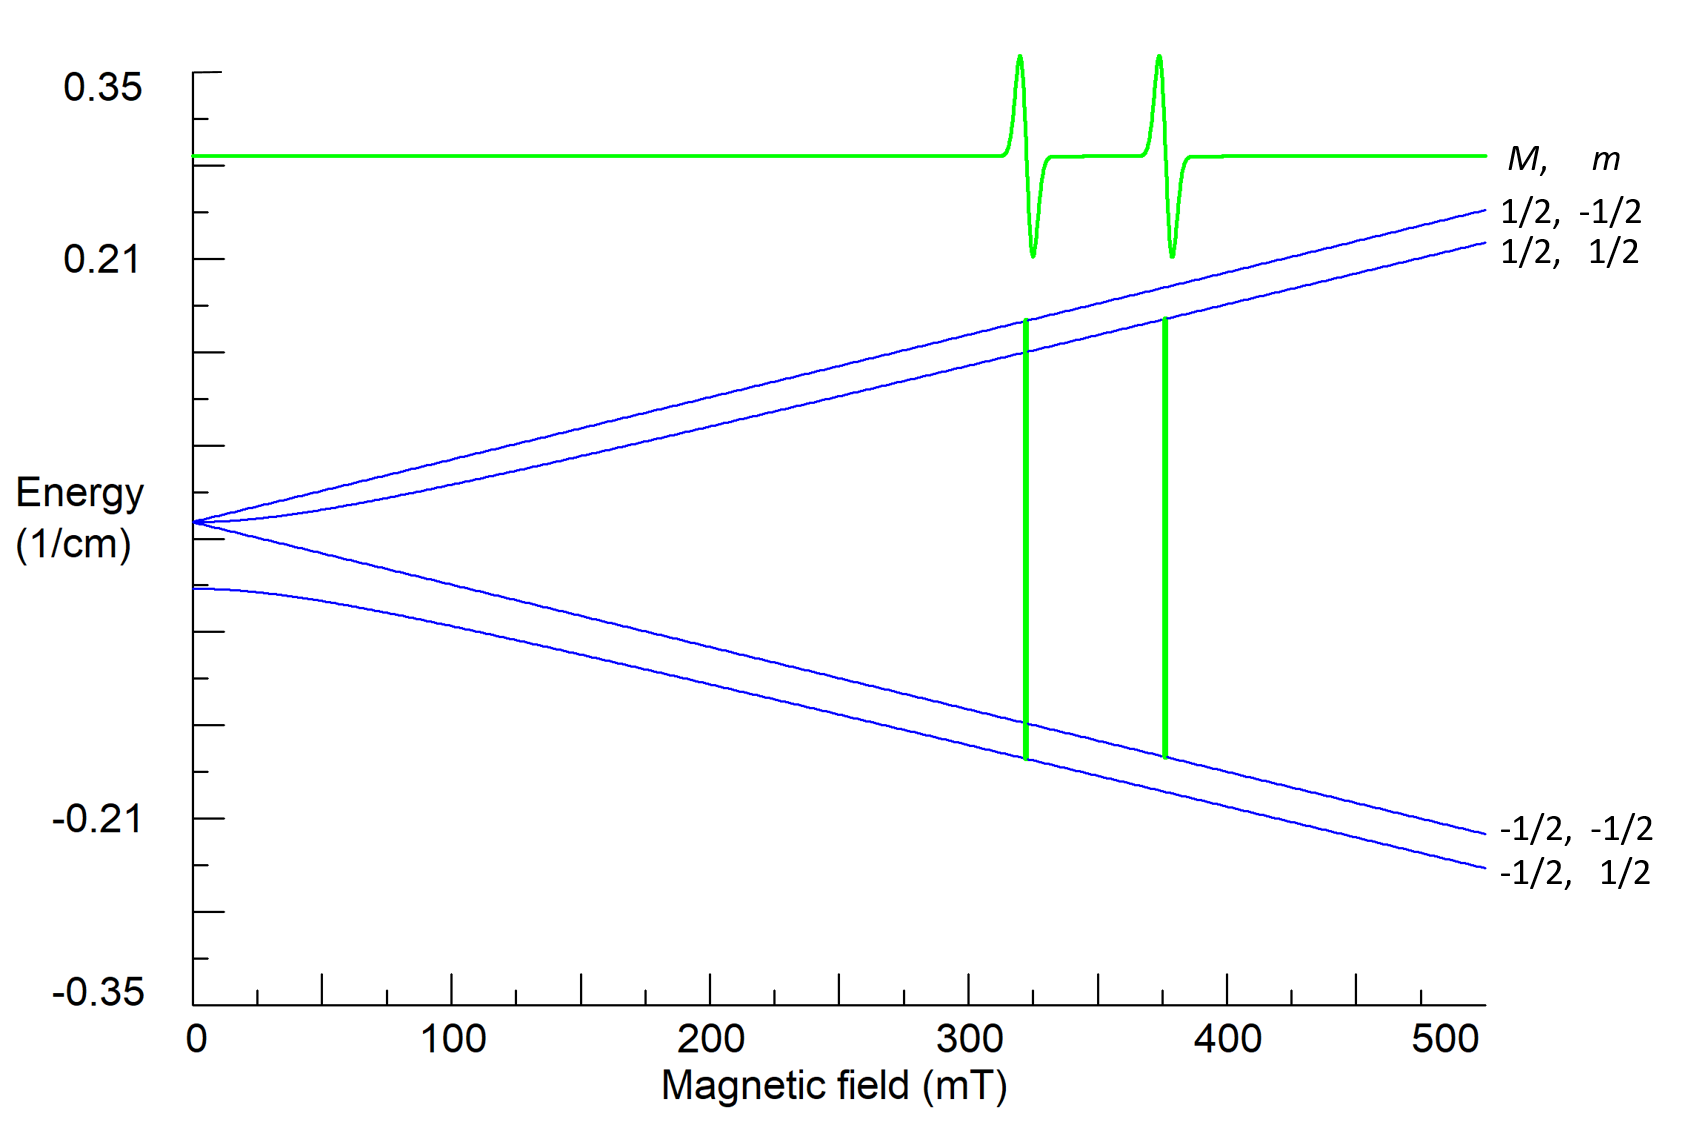
Figure 5.
Calculated energy states, quantum numbers and resonance transitions for a system with
S
=
I
=1/2;
g
=2.00,
a
=0.05 cm
-1
,
ν1
=9.5 GHz.
3. EPR of molecules and paramagnetic defects in crystals
The hyperfine interaction of unpaired electron with a nucleus of a neighbor ion becomes anisotropic due to a contribution of dipole-dipole interaction of magnetic moments of the electron and the nucleus, and can be characterized by a Cartesian tensor of the second rank
A
. If surrounding of the electron has symmetry lower than spherical or cubic one, the g-factor also becomes a symmetric second rank tensor
g
. In general case,
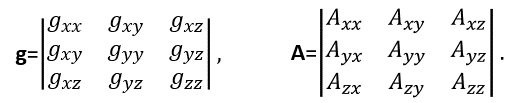
(8)
The anisotropy leads to observed dependencies of resonance fields and transition probabilities on the orientation of magnetic fields
B
and
B1
relative to principal axes of the tensors. The orientation of
B
with respect to crystallographic axes can be described by polar
θ
and azimuthal
φ
angles. Measurements and analysis of the dependence of EPR spectra under rotation of studied crystal samples in applied magnetic fields around three orthogonal
x
,
y
,
z
axes (road map of angular dependencies) allow to find all components of anisotropic tensors. Six components of a symmetric tensor can be represented as three principal values of the tensors and three angles for orientations of their principal axes with respect to crystallographic or molecular axes (Euler angles).
For an electron spin interacting with several different nuclei the spin-Hamiltonian is
![]() (9)
(9)
Here
N
is the number of surrounding nuclei. The additional interactions cause additional splitting of energy states and an appearance of complicated hyperfine structure of resonance lines (see Fig. 6 as an example).
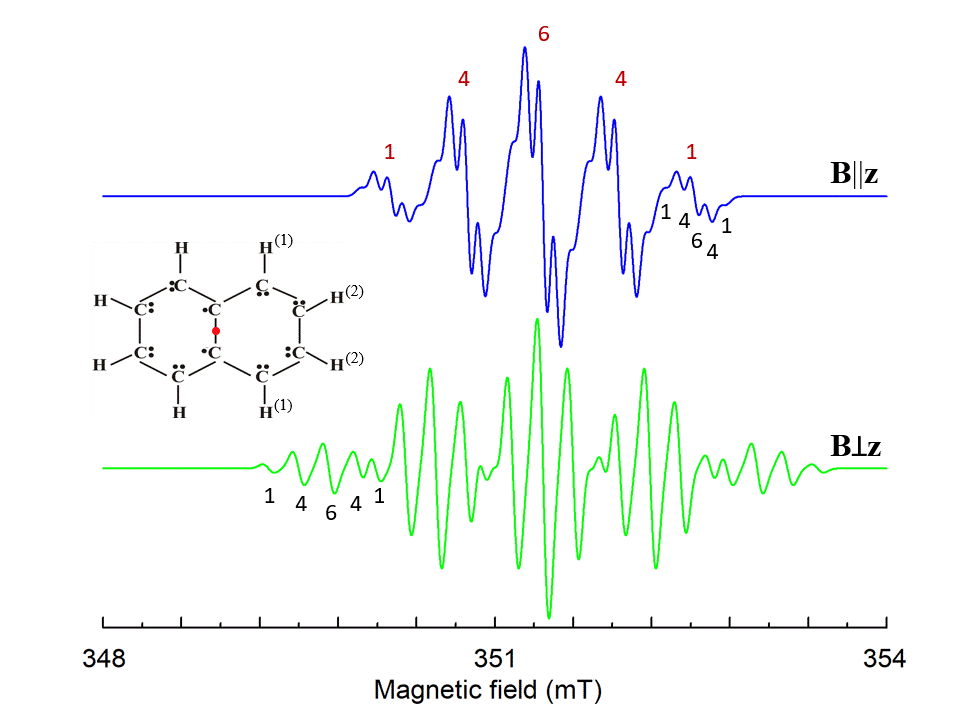
Figure 6.
Simulated EPR spectrum of naphthalene cation radical for magnetic field
B
||
z
and
B
ꓕ
z
,
z
is perpendicular to the molecule plane. Hyperfine structures from four identical H
(1)
and four H
(2)
ions with
I
=1/2 are marked by red and black numbers, correspondingly.
S
=1/2, g=2.0029, A
||(1)
=-0.58, A
ꓕ(1)
=-0.82, A
||(2)
=-0.1, A
ꓕ(2)
=-0.23 (in mT)
[3]
,
ν1
=9.85 GHz.
The shape of the individual line is Gaussian with a line width 0.085 mT.
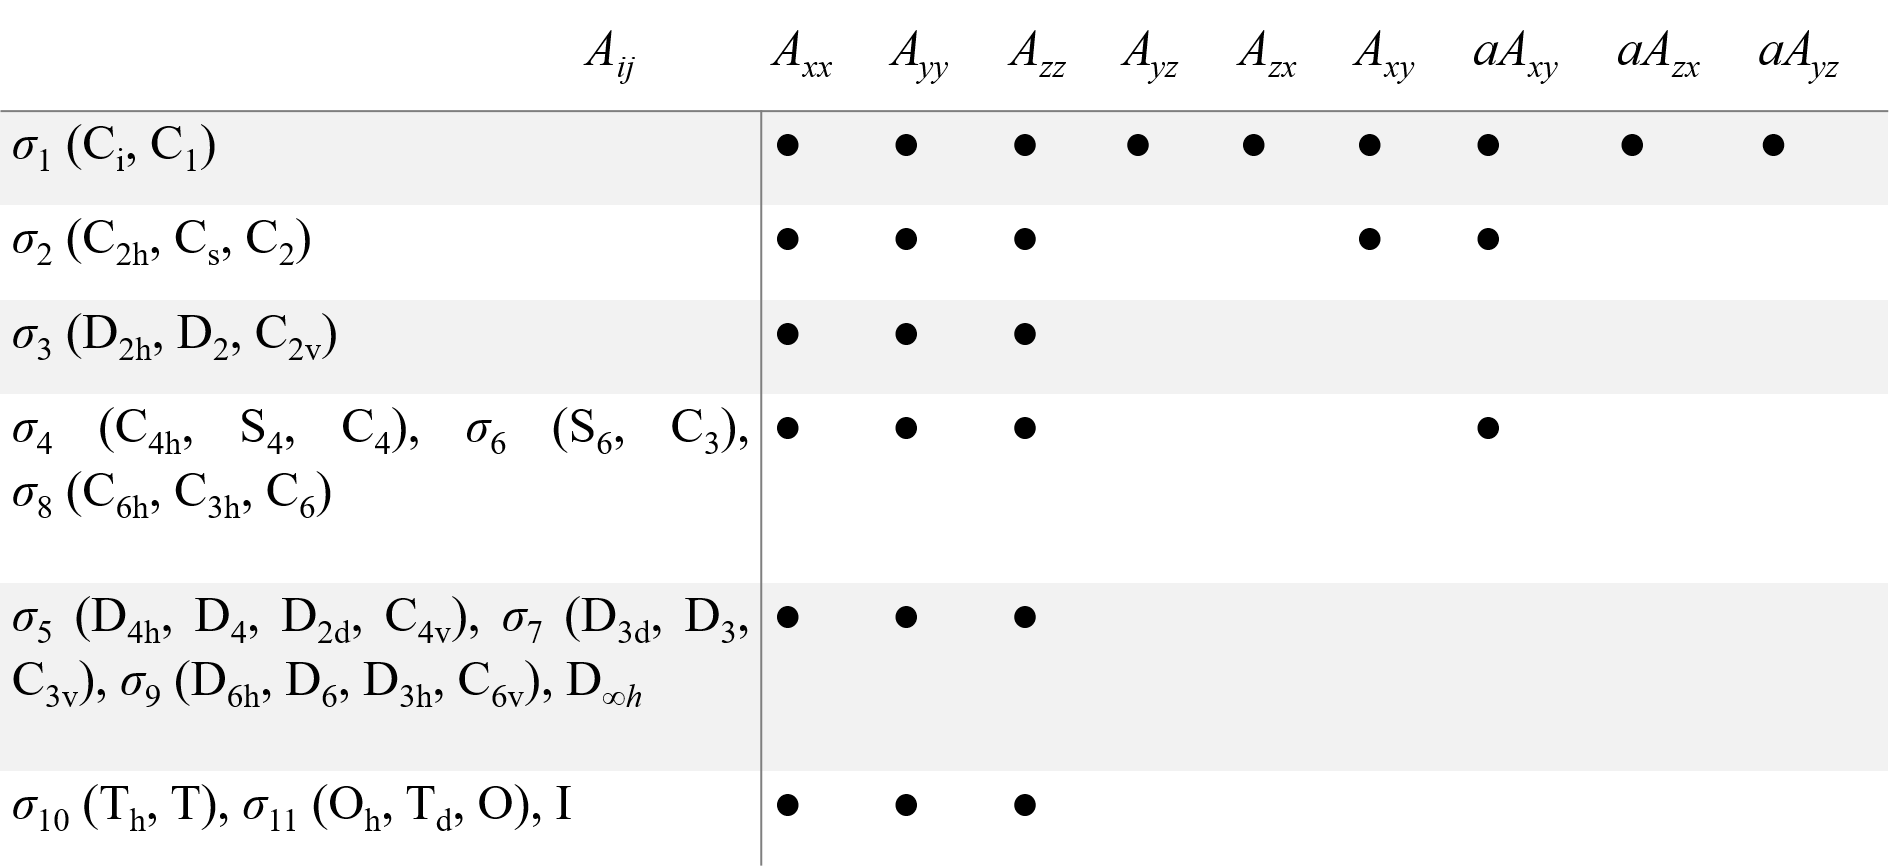
A structure consisting of a paramagnetic defect (ion/atom/molecules/trapped electron) and its surroundings can be called a ‘center’. As the center has one fixed point, its symmetry transformations form a point symmetry group (the center PSG). Only the operators or combinations of the operators which are invariant to all transformations of the center PSG must be present in the spin-Hamiltonian. The symmetry considerations significantly reduce the number of fitting parameters for the description of the EPR spectra. As magnetic field
B
and spin
S
are axial vectors, there are only 11 different spin-Hamiltonians distinguishable by EPR, which corresponds to 11 Laue classes σ
i
for 32 possible PSG for crystals. Table 1 presents components of
g
and
A
tensors, which give proper spin-Hamiltonians for the 32 PSG, as well as for the icosahedral PSG, I, and the group of linear molecules and axial centers D
∞h
.
Table 1.
Non-zero components (●) of second rank tensor for all point symmetry groups. Equal components are joined by a double line. The
aAij
are antisymmetric components of
A
tensor.
For many-electron atoms/ions, the Zeeman splitting of their ground state is determined by their total spin. If
S
>1/2, the interactions of electrons of the ions with orbital moments and surrounding electrons cause splitting of spin states even at
B
=0 (zero-field splitting, ZFS) that are described by high-spin terms in the spin-Hamiltonian proportional to
SS
(for S>1/2),
S4
(S>3/2) and
S6
(S>5/2), as well as high-spin Zeeman terms
BS3
(S>1),
BS5
(S>1), and
BS7
(S>3). Instead of bulky Cartesian operators, the irreducible tensors are used for the high-spin terms. For instance,
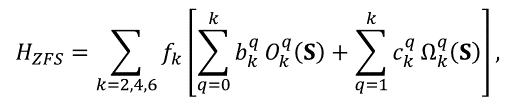
(10)
where O
kq
and Ω
kq
are combinations of Stevens operators,
f2
=1/3.
f4
=1/60, and
f6
=1/1260,
bkq
and
ckq
are ZFS parameters
[4]
,
[5]
,
[6]
. Similar irreducible operators are introduced for high-spin Zeeman terms
BSn
and hyperfine interaction operators
SnIm
. Allowed values of
k
and
q
for all point group symmetry are given in Table 2.
Table 2.
Allowed operators in spin Hamiltonian for 11 Laue classes σ
i
.
Here c and s correspond to operators, which are transformed as cos(
qφ
) and sin(
qφ
) (to O
kq
and Ω
kq
operators in the case of
HZFS
). For the σ
1
class, there are also cs operators with
kq
equal to 21, 41, 61, and 65. The operators joined by a line form a single combination. For D
∞h
the spin-Hamiltonian includes terms with
q
=0 only. For the icosahedral PSG, a combination of the operators with indices 60 and 65 and operators with
kq
equal to 00 are allowed.
For
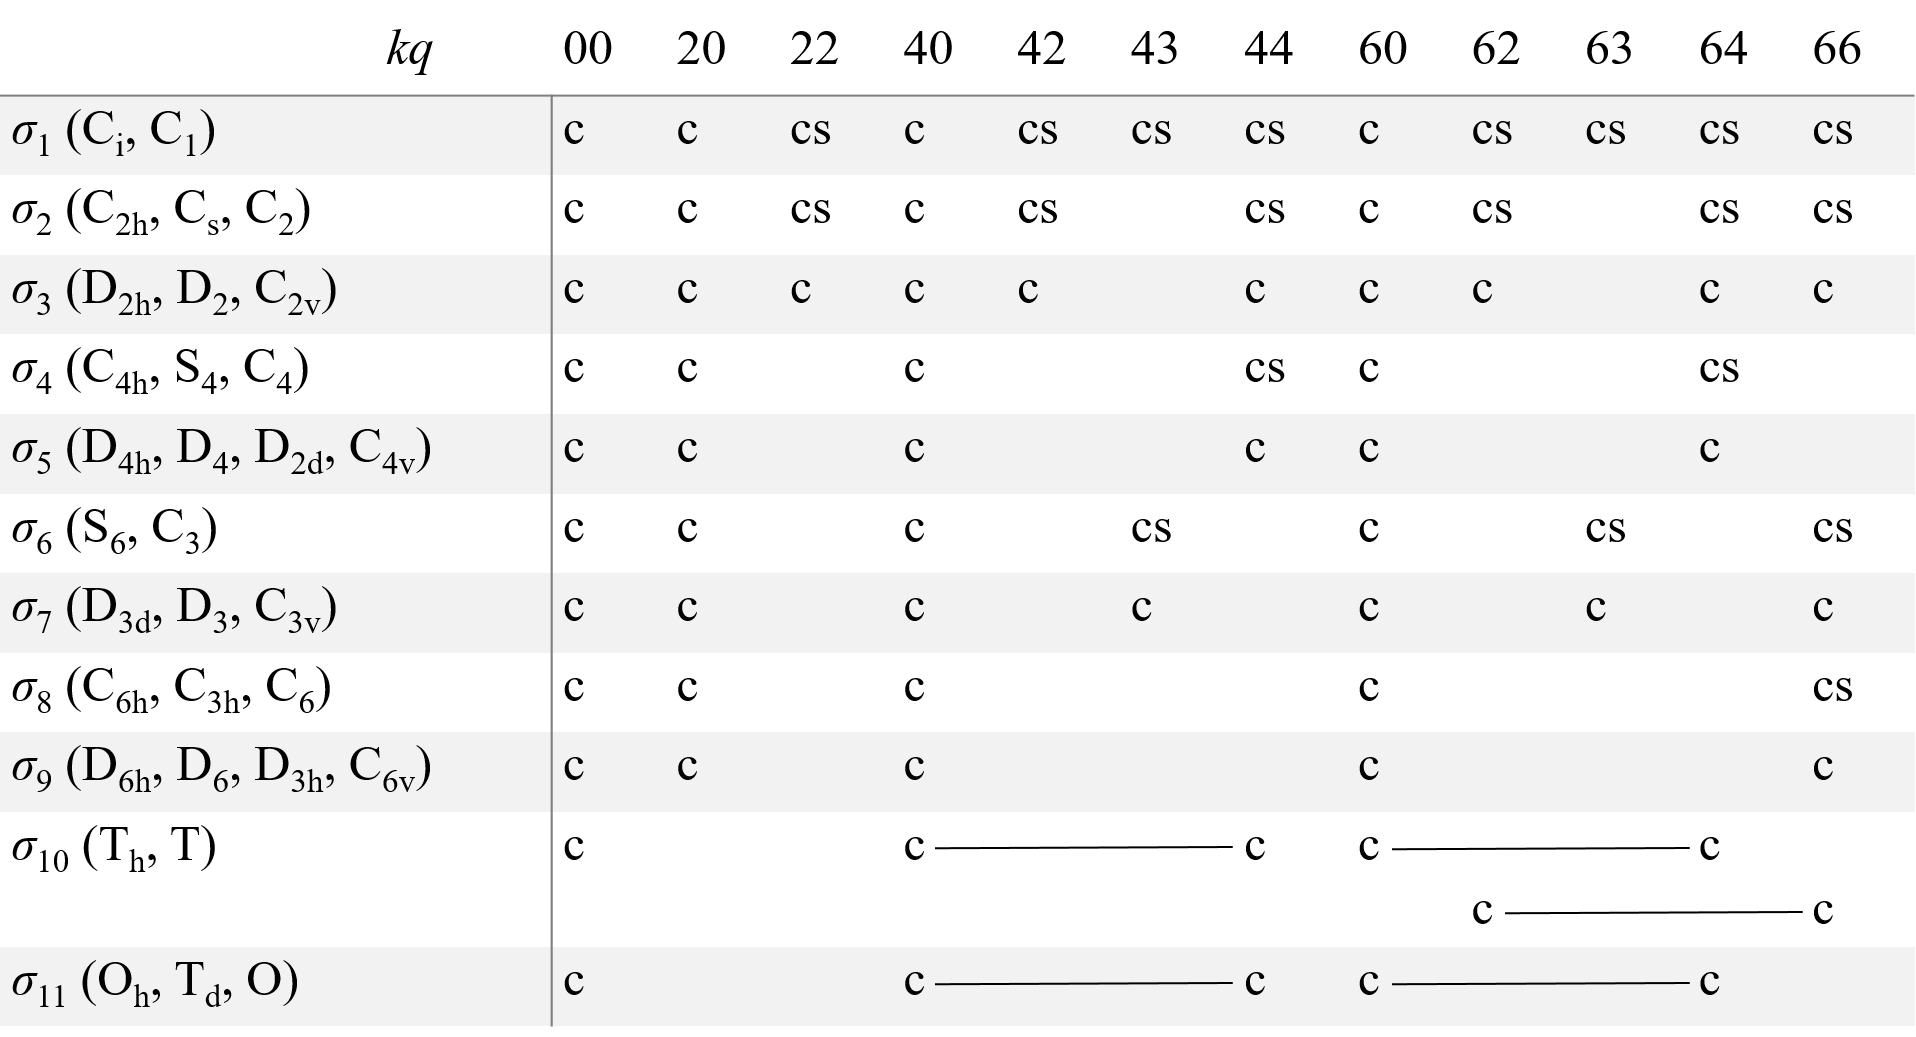
high-spin ions the EPR spectra and their angular dependencies can be rather complicated, especially if the energy of ZFS is comparable with the Zeeman energy (Fig. 7 and 8).
Figure7.
Energy states and EPR spectrum for nearly axial center of Fe
3+
ion in lithium tantalate at orientation
B
||
z
-axis.
S
=5/2, g=2.02,
b20
=0.312,
b40
=-0.0054,
b43
=0.13, (in cm
-1
),
ν1
=35 GHz. Vertical green sticks indicate allowed transitions with Δ
M
=±1, whereas red sticks represent low intensity transitions (often called forbidden transitions), which appear due to small non-axial perturbations of the ZFS (b
22
≈0.02 cm
-1
) caused by non-stoichiometric defects in the crystal.
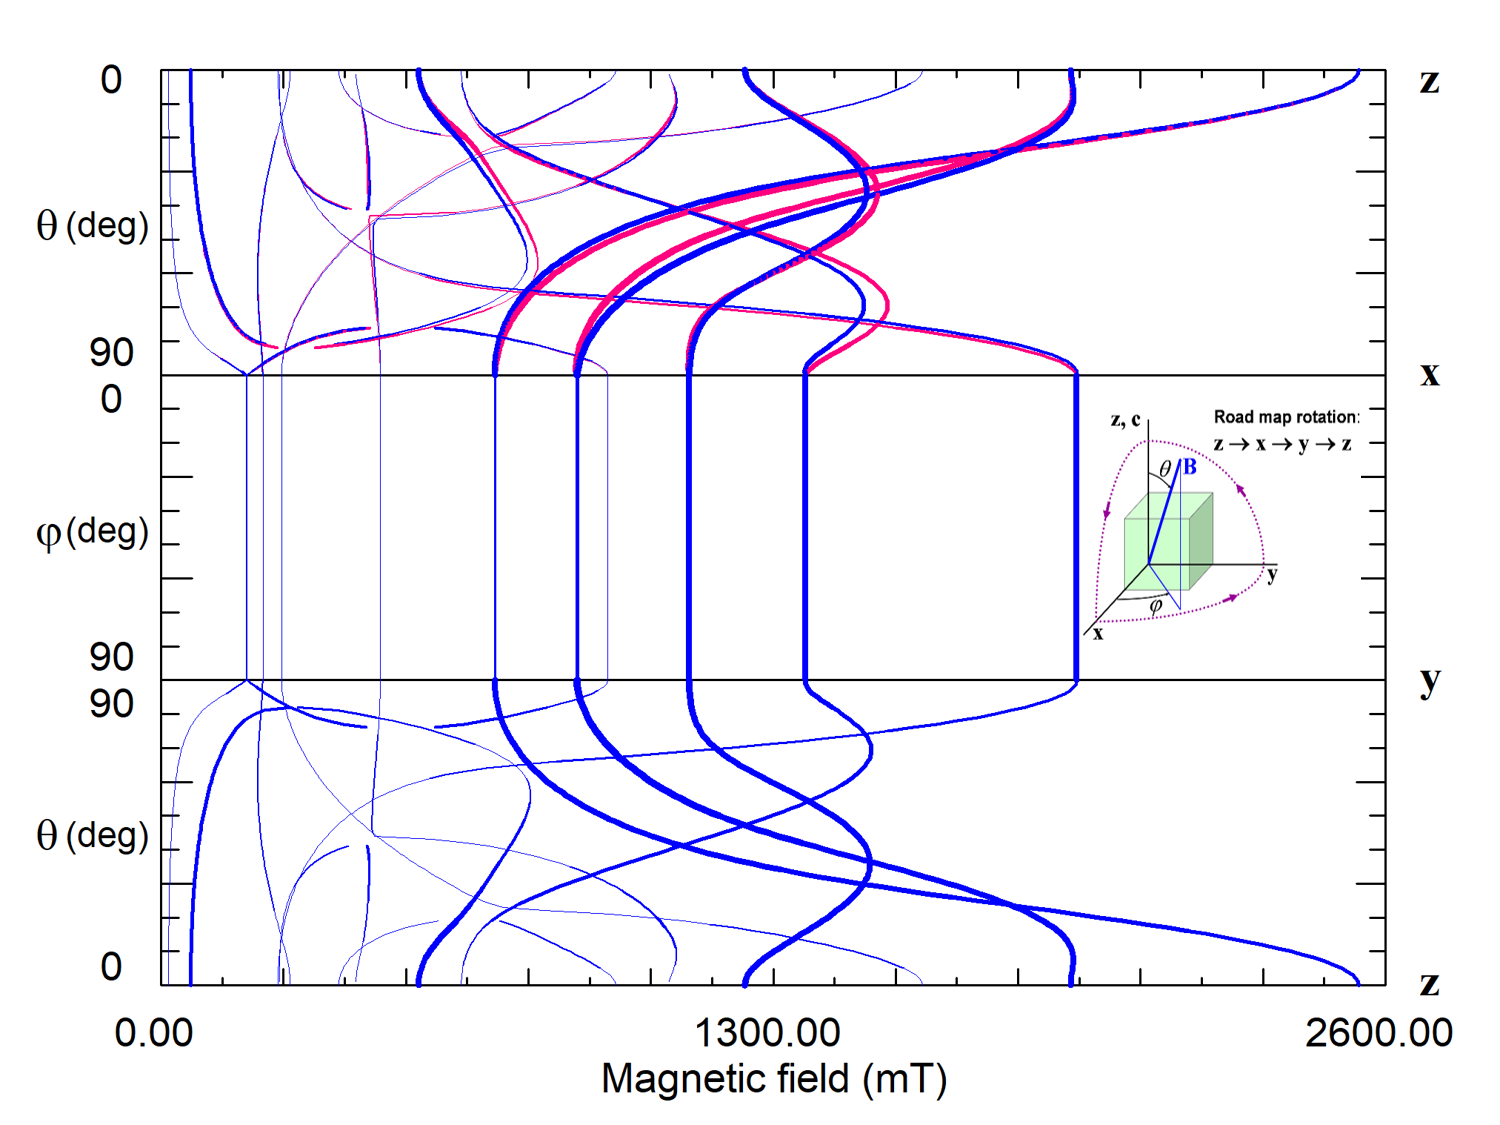
Figure 8. Road map dependence of EPR spectra of magnetically non-equivalent Fe3+ centers 1 (blue curves) and 2 (red curves) in lithium tantalate. Thicknesses of the curves reflect intensities of predicted transitions. The crystal has C3v6 PSG that permits centers with the center PSG C3 and C1. The lack of angular dependence of line positions and intensities under rotation of the magnetic field around the z-axis (xy plane) means that the Fe3+ ion is located in a crystallographic site with axial symmetry C3. The glide mirror plane zy transforms centers of the type 1 into type 2. Curves of both centers coincide in xy and zy planes but split in the zx plane.
Since magnetic resonance is insensitive to lattice translations, the 230 space symmetry groups belong to 32 crystal point symmetry groups. The center PSG of a center in a crystal must be a subgroup of the crystal PSG. If the center PSG is identical to the crystal PSG, there is a single center that produces the EPR spectrum. Otherwise, there are several electrically equivalent, but magnetically non-equivalent centers which are transformed one to others by symmetry operations of the crystal PSG, and all these centers contribute to a common EPR spectrum. For instance, in a crystal of C
3v
= 3m PSG, there can be six magnetically non-equivalent centers with the center PSG C
1
, three centers with PSG C
s
, two centers with PSG C
3
, or one with PSG C
3v
.
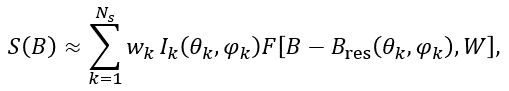
4. Powder EPR
Powder samples consist of a large number of small randomly oriented crystallites. Therefore, their EPR spectrum is a sum of many spectra. Simulation of a powder sample spectrum supposes an integration of the magnetic resonance spectrum, calculated at the definite orientation of magnetic field
B
relative to (nano)crystal coordinate axes, over a unit hemisphere of possible orientations of the axial vector
B
. For a single EPR transition the powder spectrum can be approximated as follows:
(11)
where
Ik
is the spectral intensity at the orientation
θk
,
φk
and
F
[
B
-
Bres
(
θk
,
φk
),
W
] is the lineshape absorption function of line width
W
,
Ns
is the number of used directions for the magnetic field (points on a sphere). The weighting factors
wk
are used to correct non-homogeneity of point distributions on a sphere for some partitions.
Comparing calculated
S
(
B
) with measured spectrum, it is possible to find principal values of
g
and
A tensors, but not orientations of their principal axes (Figure 9).
tensors, but not orientations of their principal axes (Fig. 9).
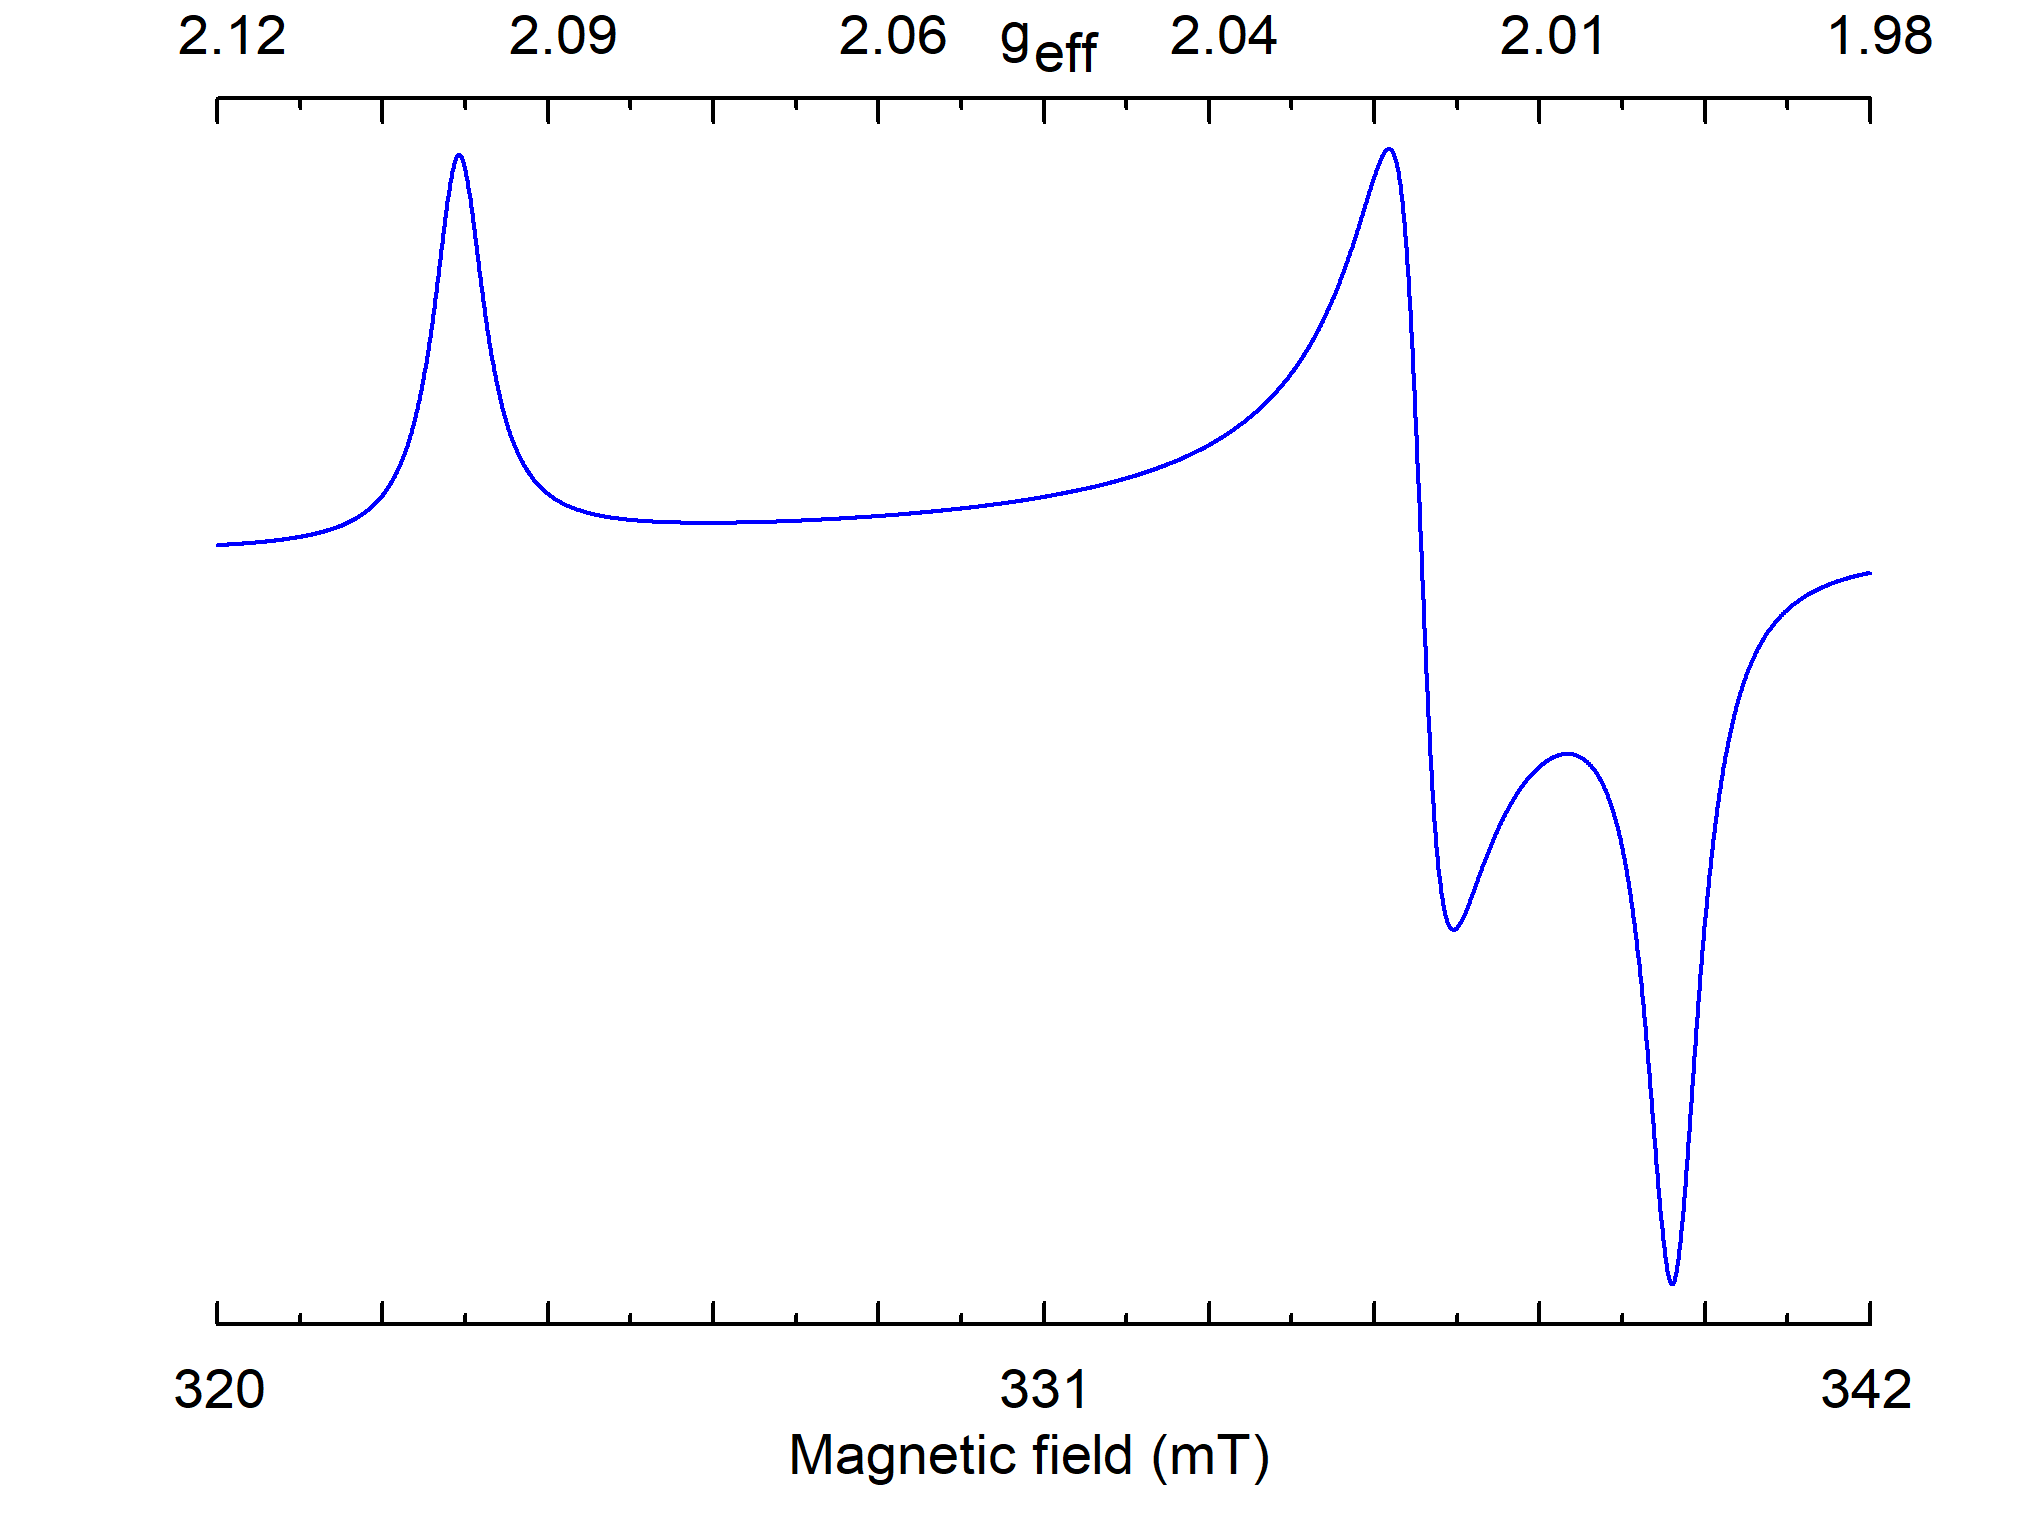
Figure 9
. Simulated powder EPR spectrum for a center with
S
=1/2,
gxx
=2.00,
gyy
=2.01,
gzz
=2.1, and
ν1
=9.5 GHz. The line of individual crystallite has a Lorentzian shape with
W
=0.5 mT.
5. Paramagnetic atoms, ions and defects
Any atom/ion with an odd number of electrons (like H
0
, Li
0
, Na
0
, N
0
, B
2+
,.) is paramagnetic. Atoms/ions with even numbers of electrons can also be paramagnetic or can be recharged to a paramagnetic state. Transition ions and rare-earth elements with partially filled shells can have several paramagnetic charge states. A broken covalent bond in organic molecules (radicals) or in covalent crystals (C, Si, SiC, Ge,.) has an unpaired electron and is paramagnetic.
A few examples of other paramagnetic systems: shallow donors and acceptors in semiconductors like Si and Ge, electrons or holes trapped by vacancies of anions or cations in ionic crystals (color centers in alkali halide crystals), paramagnetic defects created by X-ray, γ or neutron irradiation (recharges and knock out ions), radicals in tooth enamel, conduction electrons and holes, O
2
molecules, X
2-
molecular ions in alkali-halide and alkaline earth crystals (where X is F,Cl, Br, I), impurity ions in crystals like nitrogen in diamond, transition and rare-earth ions in laser host materials, triplet states, etc.
6. What is possible to obtain with the help of EPR
Due to high sensitivity, high resolution equipment and very well developed theory, all spectral characteristics (line intensities, shapes, widths, positions, fine and hyperfine structures) can be used to obtain qualitative and quantitative data.
Measurements of absolute or relative intensities of EPR signals allows to determine: spin concentration in biological samples and products of chemical reactions, radiation dose of inorganic samples and living organisms (using bones and tooth enamel), amount of free radicals in foods, beverage, and industrial materials, age of archeological artifact, etc.
Values of resonance magnetic fields give g-factors, parameters of ZFS, hyperfine and exchange interactions.
The Lorentzian line shape
 (12)
(12)
is usually observed in centers with fast relaxation or molecular motions.
The Gaussian line shape
 (13)
(13)
is a sign of inhomogeneous broadening due to intrinsic and extrinsic defects in crystals or due to unresolved hyperfine structures.
Line width
W
can be used for quantitative characterization of relaxation times, molecular motions, unresolved hyperfine structures, inhomogeneous broadening, distances between interacting electron spins.
For a paramagnetic defect the EPR is capable of determining: constituent elements and charges, spin state, PSG of occupied lattice site, nearest surrounding, and location of required charge compensator, i.e. a detailed structure of the defect on the atomic level.
7. Equipment
A variety of scientific, industrial and educational tasks demands various equipment for their solution. The simplest bench top spectrometers, which use compact permanent magnets and microwave frequencies 1÷10 GHz, are suitable for dosimetry, food analysis, life science, and education. Spectrometers with electromagnets for magnetic fields 0÷2.5 T and resonance cavities for 1÷75 GHz are successfully applied for many research problems in physics, chemistry, geology, and mineralogy (Fig. 10). Higher magnetic fields are required to resolve radicals with overlapping lines due to close values of g-factors. Superconducting magnets with fields about 3÷12 T together with sources of 100÷300 GHz photons are used for biology, biochemistry, biophysics and medical research. Advanced spectrometers are equipped with cryogenics and heaters for investigations in a broad range of temperatures from 1.2 to 1000 K. Modern spectrometers are partly or fully computerized. This significantly simplifies and accelerates measurements, facilitates spectrum treatment and interpretation allowing to obtain desirable results in days and weeks instead of months and years for old equipment.
Figure 10. Main parts of multipurpose EPR spectrometer.
8. Derivative techniques
Successful applications of the EPR technique have lead to development of several derivative techniques: pulsed EPR, electron spin echo envelope modulation (ESEEM) spectroscopy, ferromagnetic resonance, FMR, acoustical paramagnetic resonance, APR, optically detected magnetic resonance, ODMR, electrically detected magnetic resonance, EDMR, electron nuclear double resonance, ENDOR, electron-electron double resonance, ELDOR, and triple resonance EPR spectroscopy.
Successful applications of the EPR technique have lead to development of several derivative techniques: pulsed EPR, electron spin echo envelope modulation (ESEEM) spectroscopy, ferromagnetic resonance, FMR, acoustical paramagnetic resonance, APR, optically detected magnetic resonance, ODMR, electrically detected magnetic resonance, EDMR, electron nuclear double resonance, ENDOR, electron-electron double resonance, ELDOR, and triple resonance EPR spectroscopy.
References
- Eaton, G.R.; Eaton, S.S.; Barr, D.P.; Weber. R.T. . Quantitative EPR; Springer: Wien, New-York, 2010; pp. 1-185.
- Poole, Ch.P.. Electron spin resonance. A Comprehensive Treatise on Experimental Techniques; J. Wiley, Dover Publications, Inc.: Mineola, New York, 1983; pp. 1-780.
- Gerson, F.; Qin,X.-Z.; The radical Cation of Naphthalene. First correct analysis of its fine structure. Chem. Phys. Letters 1988, 153, 546-550.
- Abraham, A.; Bleaney, B.. Electron Paramagnetic Resonance of Transition Ions; Clarendon Press: Oxford, 1970; pp. 1-911.
- Altshuler, S. A.; Kozirev, B. M.. Electron Paramagnetic Resonance in Compounds of Transition Elements; Science, Moscow, 1972: Wiley, New York, 1974; pp. 1-672.
- Czeslaw Rudowicz; Sushil K. Misra; SPIN-HAMILTONIAN FORMALISMS IN ELECTRON MAGNETIC RESONANCE (EMR) AND RELATED SPECTROSCOPIES. Applied Spectroscopy Reviews 2001, 36, 11-63, 10.1081/asr-100103089.