This scoping review aimed to explore the characteristics, strengths, and gaps in research conducted in Brazilian long-term care facilities (LTCFs) for older adults. Electronic searches investigating the residents (≥60 years old), their families, and the LTCF workforce in Brazil were conducted in Medline, EMBASE, LILACS, and Google Scholar, within the timescale of 1999 to 2018, limited to English, Portuguese, or Spanish. The reference lists were hand searched for additional papers. The Mixed Methods Appraisal Tool (MMAT) was used for critical appraisal of evidence. Data were reported descriptively considering the study design, using content analysis: 327 studies were included (n = 159 quantitative non-randomized, n = 82 quantitative descriptive, n = 67 qualitative, n = 11 mixed methods, n = 6 randomized controlled trials, and n = 2 translation of assessment tools). Regardless of the study design, most were conducted in a single LTCF (45.8%), in urban locations (84.3%), and in non-profit settings (38.7%). The randomized trials and descriptive studies presented the lowest methodological quality based on the MMAT. This is the first review to provide an overview of research on LTCFs for older people in Brazil. It illustrates an excess of small-scale, predominantly qualitative papers, many of which are reported in ways that do not allow the quality of the work to be assured.
- older adults
- care homes
- nursing homes
- long-term care
- older people
- scoping review
1. Introduction
[1]
[2]
[8]
-
Describe the type and quality of empirical research conducted in Brazilian LTCFs for those aged over 60 years;
-
Identify the topic areas of published research;
-
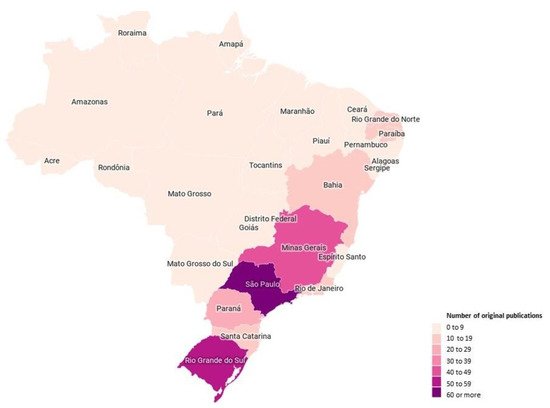
Map the regions in Brazil where this research was conducted;
-
Identify current knowledge gaps.
2. Methods
Eligibility Criteria
-
Were empirical original research published in scientific journals;
-
Investigated LTCF residents (older people aged 60 years and above as per/in line with the Brazilian definition of older people), their families, the LTCF workforce (e.g., healthcare professionals, care staff, and management-level staff), or LTCF organizations.
2. Study Inclusion
3. Results
A total of 512 publications were retrieved. A further 12 articles were identified during the secondary screening of the references. After deleting duplicates, 438 studies were assessed for eligibility. Ninety-nine papers were excluded, yielding 327 studies that were included.
3.1. Study Inclusion
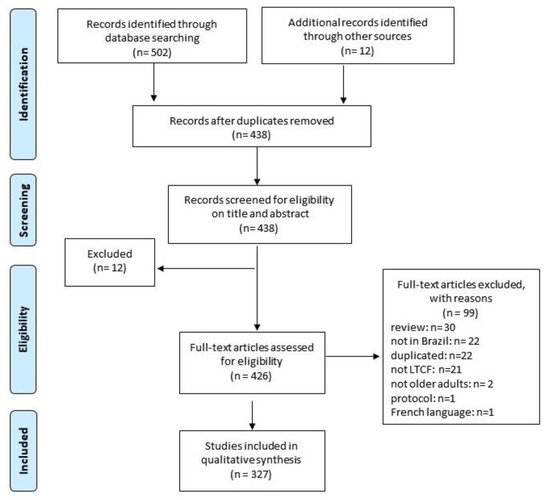
Figure 1.
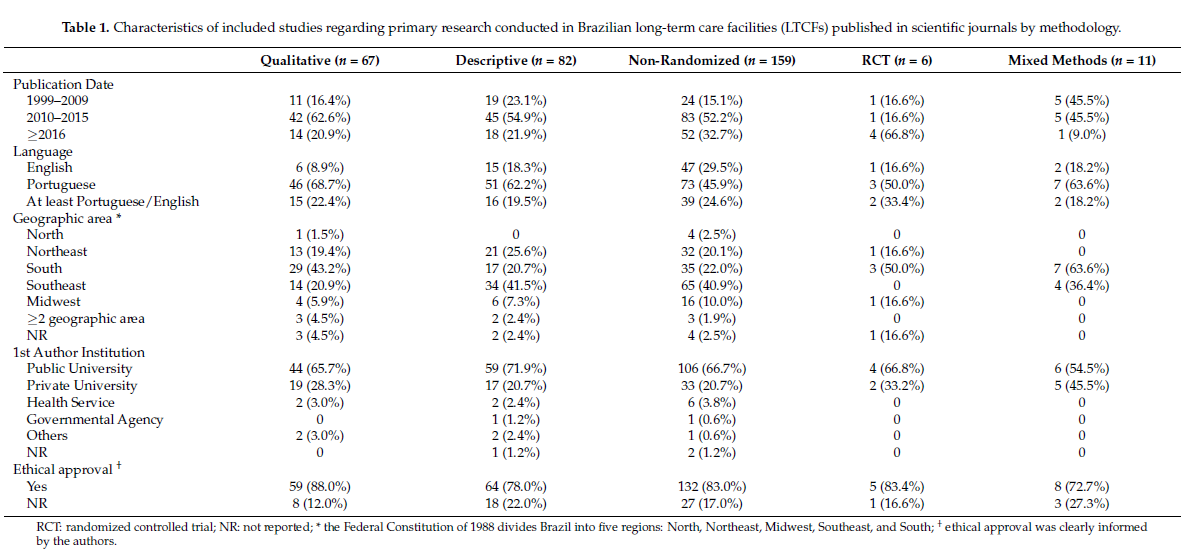
3. Features of Included Studies
3.2. Features of Included Studies
n
n
n
n
n
Table 1.
| Qualitative (n = 67) | Descriptive (n = 82) | Non-Randomized (n = 159) | RCT (n = 6) | Mixed Methods (n = 11) | |
|---|---|---|---|---|---|
| Publication Date |
Figure 2.
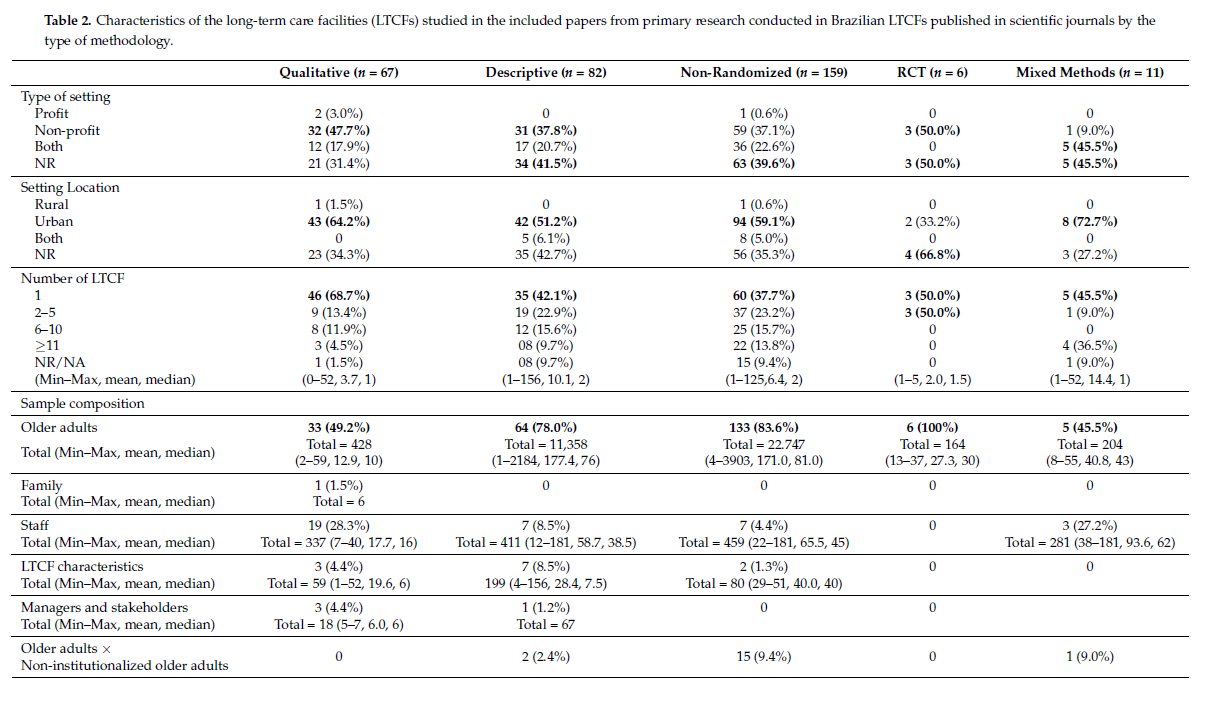
4. Characteristics of Included LTCFs
3.3. Characteristics of Included LTCFs
n
n
n
n
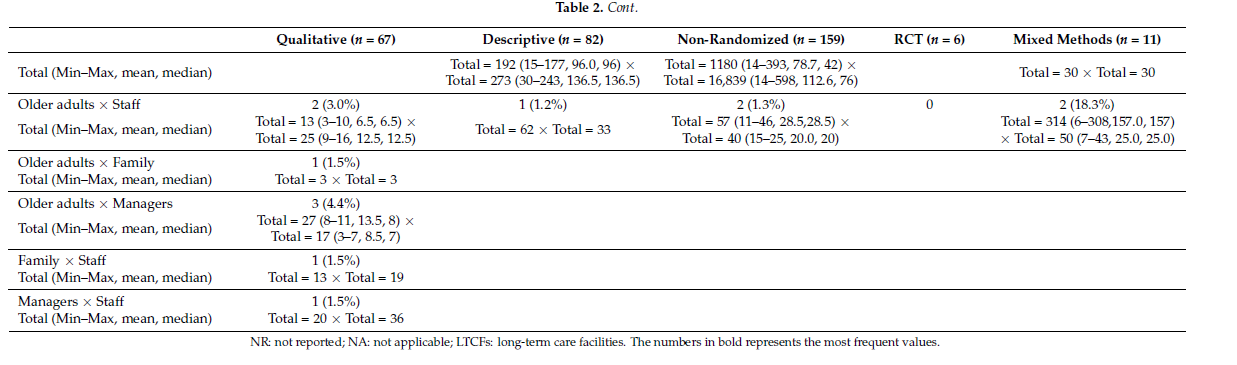
Table 2.
| Qualitative (n = 67) | Descriptive (n = 82) | Non-Randomized (n = 159) | RCT (n = 6) | Mixed Methods (n = 11) |
|---|
| Type of setting | 1999–2009 | 11 (16.4%) | 19 (23.1%) | 24 (15.1%) | 1 (16.6%) | |||||
| Profit | 5 (45.5%) | |||||||||
| 2 (3.0%) |
5. Research Topic Areas
3.4. Research Topic Areas
n
n
n
n
n
n
n
n
n
n
Supplementary Materials (Table S1)
6. Methodological Appraisal
3.5. Methodological Appraisal
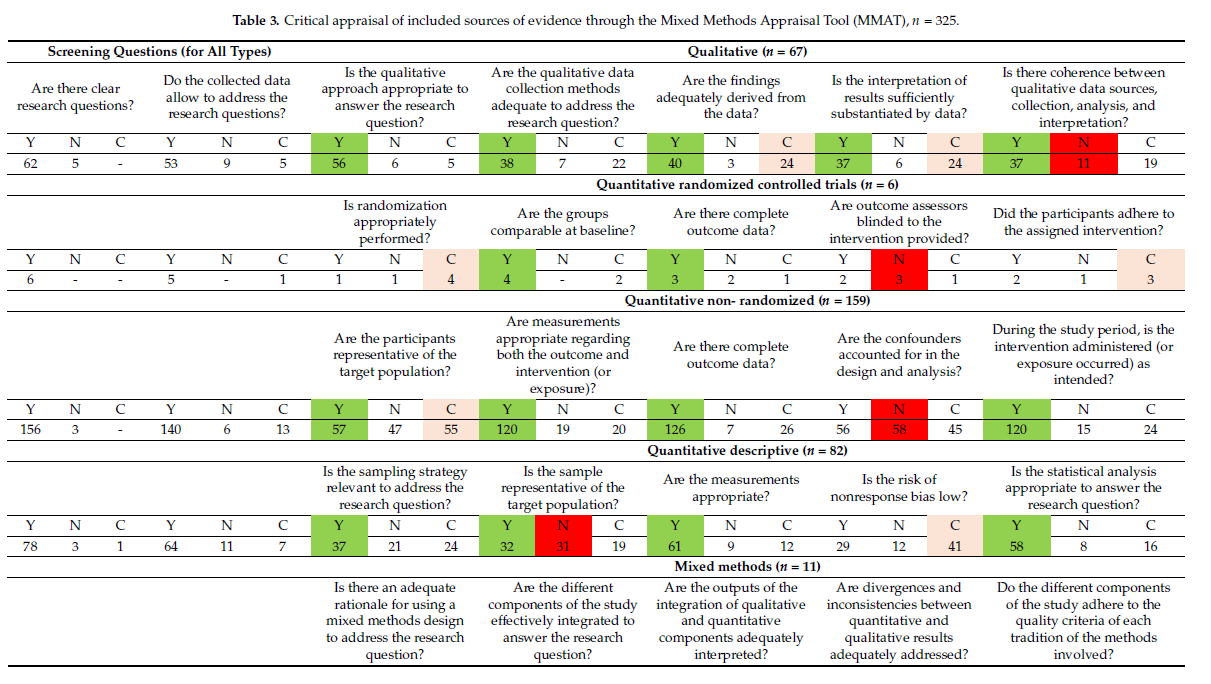
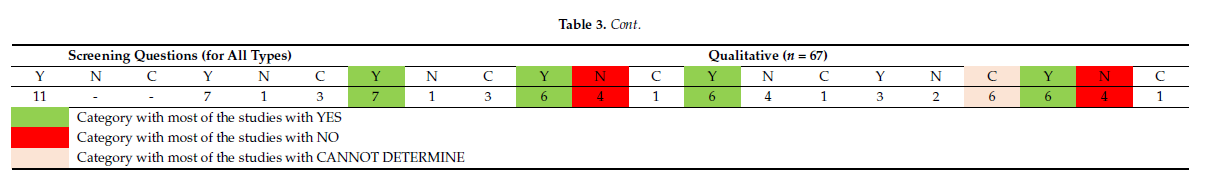
Table 3.
n
| Screening Questions (for All Types) | Qualitative (n = 67) | |||||||||||||||||||||||||||||
|---|---|---|---|---|---|---|---|---|---|---|---|---|---|---|---|---|---|---|---|---|---|---|---|---|---|---|---|---|---|---|
| Are there clear research questions? | Do the collected data allow to address the research questions? | Is the qualitative approach appropriate to answer the research question? | Are the qualitative data collection methods adequate to address the research question? | Are the findings adequately derived from the data? | Is the interpretation of results sufficiently substantiated by data? | Is there coherence between qualitative data sources, collection, analysis, and interpretation? | ||||||||||||||||||||||||
| Y | 0 | N1 (0.6%) | C0 | Y | N | C | Y | N | C | Y | N | C | Y | N | C | Y | 2010–2015 | 42 (62.6%) | 45 (54.9%) | 83 (52.2%) | 1 (16.6%) | 5 (45.5%) | ||||||||
| 0 | ||||||||||||||||||||||||||||||
| N | C | Y | N | C | Non-profit | 32 (47.7%) | 31 (37.8%) | 59 (37.1%) | 3 (50.0%) | |||||||||||||||||||||
| 62 | 5 | -1 (9.0%) | 53 | 9 | 5 | 56 | 6 | ≥2016 | 14 (20.9%) | 18 (21.9%) | 52 (32.7%) | 4 (66.8%) | 1 (9.0%) | |||||||||||||||||
| 5 | 38 | 7 | 22 | Both | 12 (17.9%) | 17 (20.7%) | 36 (22.6%) | 0 | 5 (45.5%) | Language | ||||||||||||||||||||
| 40 | 3 | 24 | 37 | 6 | 24 | 37 | 11 | 19 | ||||||||||||||||||||||
| Quantitative randomized controlled trials (n = 6) | NR | 21 (31.4%) | 34 (41.5%) | 63 (39.6%) | 3 (50.0%) | |||||||||||||||||||||||||
| Is randomization appropriately performed? | Are the groups comparable at baseline? | 5 (45.5%) | Are there complete outcome data? | Are outcome assessors blinded to the intervention provided? | Did the participants adhere to the assigned intervention? | English | 6 (8.9%) | 15 (18.3%) | 47 (29.5%) | |||||||||||||||||||||
| Y | N | C | Y1 (16.6%) | 2 (18.2%) | ||||||||||||||||||||||||||
| Portuguese | 46 (68.7%) | 51 (62.2%) | 73 (45.9%) | 3 (50.0%) | 7 (63.6%) | |||||||||||||||||||||||||
| Setting Location | ||||||||||||||||||||||||||||||
| N | C | Y | N | C | Y | N | C | Y | N | C | Y | N | C | Y | N | C | Rural | 1 (1.5%) | 0 | 1 (0.6%) | 0 | 0 | ||||||||
| 6 | - | - | 5 | - | 1 | 1 | 1 | 4 | 4 | - | 2 | 3 | 2 | 1 | 2 | 3 | 1 | 2 | 1 | 3 | At least Portuguese/English | 15 (22.4%) | 16 (19.5%) | 39 (24.6%) | 2 (33.4%) | 2 (18.2%) | ||||
| Urban | 43 (64.2%) | 42 (51.2%) | 94 (59.1%) | 2 (33.2%) | 8 (72.7%) | |||||||||||||||||||||||||
| Quantitative non- randomized (n = 159) | Geographic area * | |||||||||||||||||||||||||||||
| Both | 0 | 5 (6.1%) | 8 (5.0%) | 0 | ||||||||||||||||||||||||||
| Are the participants representative of the target population? | Are measurements appropriate regarding both the outcome and intervention (or exposure)? | Are there complete outcome data? | 0 | North | 1 (1.5%) | 0 | 4 (2.5%) | 0 | 0 | |||||||||||||||||||||
| Are the confounders accounted for in the design and analysis? | During the study period, is the intervention administered (or exposure occurred) as intended? | NR | 23 (34.3%) | 35 (42.7%) | 56 (35.3%) | 4 (66.8%) | 3 (27.2%) | |||||||||||||||||||||||
| Y | N | C | Y | N | C | Y | N | C | Y | N | C | Y | N | C | Y | N | C | Y | N | C | Northeast | 13 (19.4%) | 21 (25.6%) | 32 (20.1%) | 1 (16.6%) | 0 | ||||
| 156 | 3 | - | 140 | 6 | 13 | 57 | 47 | 55 | 120 | 19 | South | 29 (43.2%) | 17 (20.7%) | 35 (22.0%) | 3 (50.0%) | 7 (63.6%) | ||||||||||||||
| Southeast | 14 (20.9%) | 34 (41.5%) | 65 (40.9%) | 0 | 4 (36.4%) | |||||||||||||||||||||||||
| Midwest | 4 (5.9%) | |||||||||||||||||||||||||||||
| Number of LTCF | ||||||||||||||||||||||||||||||
| 20 | 126 | 7 | 26 | 1 | 46 (68.7%) | 35 (42.1%) | 60 (37.7%) | 3 (50.0%) | 5 (45.5%) | |||||||||||||||||||||
| 2–5 | 9 (13.4%) | 19 (22.9%) | 37 (23.2%) | 3 (50.0%) | 1 (9.0%)6 (7.3%) | 16 (10.0%) | 1 (16.6%) | 0 | ||||||||||||||||||||||
| 6–10 | 8 (11.9%) | 12 (15.6%) | 25 (15.7%) | 0 | 0 | ≥2 geographic area | 3 (4.5%) | 2 (2.4%) | 3 (1.9%) | 0 | 0 | |||||||||||||||||||
| 56 | 58 | 45 | 120 | ≥11 | 3 (4.5%) | 08 (9.7%) | 22 (13.8%) | 0 | 4 (36.5%) | NR | 3 (4.5%) | 2 (2.4%) | 4 (2.5%) | 1 (16.6%) | 0 | |||||||||||||||
| 15 | 24 | NR/NA | 1 (1.5%) | 08 (9.7%) | 15 (9.4%) | 0 | 1st Author Institution | |||||||||||||||||||||||
| Public University | 44 (65.7%) | 59 (71.9%) | 106 (66.7%) | |||||||||||||||||||||||||||
| Quantitative descriptive (n = 82) | ||||||||||||||||||||||||||||||
| Is the sampling strategy relevant to address the research question? | Is the sample representative of the target population? | Are the measurements appropriate? | Is the risk of nonresponse bias low? | 4 (66.8%) | 6 (54.5%) | |||||||||||||||||||||||||
| Is the statistical analysis appropriate to answer the research question? | Private University | 19 (28.3%) | 17 (20.7%) | |||||||||||||||||||||||||||
| Y | N | C | Y | N | C | Y | N | C | Y | N | C33 (20.7%) | 2 (33.2%) | 5 (45.5%) | |||||||||||||||||
| 1 (9.0%) | ||||||||||||||||||||||||||||||
| Y | N | C | Y | (Min–Max, mean, median) | (0–52, 3.7, 1) | (1–156, 10.1, 2) | (1–125,6.4, 2) | (1–5, 2.0, 1.5) | (1–52, 14.4, 1) | |||||||||||||||||||||
| Sample composition | ||||||||||||||||||||||||||||||
| N | C | Y | N | Older adults | 33 (49.2%) | 64 (78.0%) | 133 (83.6%) | 6 (100%) | 5 (45.5%) | Health Service | 2 (3.0%) | 2 (2.4%) | 6 (3.8%) | 0 | 0 | |||||||||||||||
| C | ||||||||||||||||||||||||||||||
| 78 | 3 | 1 | 64 | 11 | 7 | 37 | 21 | 24 | 32 | Total (Min–Max, mean, median) | Total = 428 (2–59, 12.9, 10) |
Total = 11,358 (1–2184, 177.4, 76) |
Total = 22.747 (4–3903, 171.0, 81.0) |
Total = 164 (13–37, 27.3, 30) |
Total = 204 (8–55, 40.8, 43) |
Governmental Agency | 0 | 1 (1.2%) | 1 (0.6%) | 0 | 0 | |||||||||
| Others | ||||||||||||||||||||||||||||||
| Family | 1 (1.5%) | 0 | 0 | 0 | 0 | 2 (3.0%) | 2 (2.4%) | 1 (0.6%) | 0 | |||||||||||||||||||||
| Total (Min–Max, mean, median) | 0 | |||||||||||||||||||||||||||||
| Total = 6 | NR | 0 | 1 (1.2%) | 2 (1.2%) | 0 | 0 | ||||||||||||||||||||||||
| Ethical approval † | ||||||||||||||||||||||||||||||
| Staff | 19 (28.3%) | 7 (8.5%) | 7 (4.4%) | 0 | 3 (27.2%) | |||||||||||||||||||||||||
| 31 | 19 | 61 | 9 | 12 | 29 | 12 | 41 | 58 | 8 | 16 | ||||||||||||||||||||
| Mixed methods (n = 11) | ||||||||||||||||||||||||||||||
| Is there an adequate rationale for using a mixed methods design to address the research question? | Are the different components of the study effectively integrated to answer the research question? | Are the outputs of the integration of qualitative and quantitative components adequately interpreted? | Are divergences and inconsistencies between quantitative and qualitative results adequately addressed? | Do the different components of the study adhere to the quality criteria of each tradition of the methods involved? | ||||||||||||||||||||||||||
| Y | N | C | Y | N | C | Y | N | C | Y | N | C | Y | N | C | Y | N | C | Y | N | C | ||||||||||
| 11 | - | - | 7 | 1 | 3 | 7 | 1 | 3 | 6 | 4 | 1 | 6 | 4 | 1 | 3 | 2 | 6 | 6 | 4 | 1 | ||||||||||
| Category with most of the studies with YES | Total (Min–Max, mean, median) | Total = 337 (7–40, 17.7, 16) | Total = 411 (12–181, 58.7, 38.5) | Total = 459 (22–181, 65.5, 45) | Yes | 59 (88.0%) | 64 (78.0%) | 132 (83.0%) | 5 (83.4%) | 8 (72.7%) | ||||||||||||||||||||
| NR | 8 (12.0%) | 18 (22.0%) | 27 (17.0%) | 1 (16.6%) | 3 (27.3%) | |||||||||||||||||||||||||
n
| Category with most of the studies with NO | |||||||||||||||||||
| Total = 281 (38–181, 93.6, 62) | |||||||||||||||||||
| Category with most of the studies with CANNOT DETERMINE | |||||||||||||||||||
| LTCF characteristics | |||||||||||||||||||
| 3 (4.4%) | |||||||||||||||||||
| 7 (8.5%) | |||||||||||||||||||
| 2 (1.3%) | 0 | 0 | |||||||||||||||||
| Total (Min–Max, mean, median) | Total = 59 (1–52, 19.6, 6) | 199 (4–156, 28.4, 7.5) | Total = 80 (29–51, 40.0, 40) | ||||||||||||||||
| Managers and stakeholders | 3 (4.4%) | 1 (1.2%) | 0 | 0 | |||||||||||||||
| Total (Min–Max, mean, median) | Total = 18 (5–7, 6.0, 6) | Total = 67 | |||||||||||||||||
| Older adults × Non-institutionalized older adults | 0 | 2 (2.4%) | 15 (9.4%) | 0 | 1 (9.0%) | ||||||||||||||
| Total (Min–Max, mean, median) | Total = 192 (15–177, 96.0, 96) × Total = 273 (30–243, 136.5, 136.5) | Total = 1180 (14–393, 78.7, 42) × Total = 16,839 (14–598, 112.6, 76) | Total = 30 × Total = 30 | ||||||||||||||||
| Older adults × Staff | 2 (3.0%) | 1 (1.2%) | 2 (1.3%) | 0 | 2 (18.3%) | ||||||||||||||
| Total (Min–Max, mean, median) | Total = 13 (3–10, 6.5, 6.5) × Total = 25 (9–16, 12.5, 12.5) | Total = 62 × Total = 33 | Total = 57 (11–46, 28.5,28.5) × Total = 40 (15–25, 20.0, 20) | Total = 314 (6–308,157.0, 157) × Total = 50 (7–43, 25.0, 25.0) | |||||||||||||||
| Older adults × Family | 1 (1.5%) | ||||||||||||||||||
| Total (Min–Max, mean, median) | Total = 3 × Total = 3 | ||||||||||||||||||
| Older adults × Managers | 3 (4.4%) | ||||||||||||||||||
| Total (Min–Max, mean, median) | Total = 27 (8–11, 13.5, 8) × Total = 17 (3–7, 8.5, 7) | ||||||||||||||||||
| Family × Staff | 1 (1.5%) | ||||||||||||||||||
| Total (Min–Max, mean, median) | Total = 13 × Total = 19 | ||||||||||||||||||
| Managers × Staff | 1 (1.5%) | ||||||||||||||||||
| Total (Min–Max, mean, median) | Total = 20 × Total = 36 | ||||||||||||||||||
 older adults; care homes; nursing homes; long-term care; older people; scoping review
4. Discussion
5. Conclusions and Implications
Supplementary Materials
Author Contributions
Funding
Institutional Review Board Statement
Informed Consent Statement
Data Availability Statement
Acknowledgments
Conflicts of Interest
References
- World Health Organization. Regional Office for South-East Asia. Ageing and Health. 2019. Available online: https://www.who.int/news-room/fact-sheets/detail/ageing-and-health (accessed on 5 February 2018).
- Pot, A.M.; Briggs, A.M.; Beard, J.R. The Sustainable Development Agenda Needs to Include Long-Term Care. J. Am. Med. Dir. Assoc. 2018, 19, 725–727. [Google Scholar] [CrossRef] [PubMed]
- Beard, J.R.; Officer, A.M.; Cassels, A.K. The World Report on Ageing and Health. GERONT 2016, 56, S163–S166. [Google Scholar] [CrossRef] [PubMed]
- Committee on Population; Division of Behavioral and Social Sciences and Education; National Academies of Sciences, Engineering and Medicine. Future Directions for the Demography of Aging: Proceedings of a Workshop; Hayward, M.D., Majmundar, M.K., Eds.; National Academies Press: Washington, DC, USA, 2018; p. 25064. ISBN 978-0-309-47410-8. [Google Scholar]
- Roquete, F.F.; Batista, C.C.R.F.; Arantes, R.C.; Roquete, F.F.; Batista, C.C.R.F.; Arantes, R.C. Care and Management Demands of Long-Term Care Facilities for the Elderly in Brazil: An Integrative Review (2004–2014). Rev. Bras. Geriatr. Gerontol. 2017, 20, 286–299. [Google Scholar] [CrossRef]
- Camarano, A.A.; Kanso, S. As instituições de longa permanência para idosos no Brasil. Rev. Bras. Estud. Popul. 2010, 27, 232–235. [Google Scholar] [CrossRef]
- Jacinto, A.F.; Achterberg, W.; Wachholz, P.A.; Dening, T.; Harrison Dening, K.; Devi, R.; Oliveira, D.; Everink, I.; Gaiolla, P.A.; Villas Bôas, P.J.F.; et al. Using international collaborations to shape research and innovation into care homes in brazil: A white paper. J. Nurs. Home Res. Sci. 2020, 6, 109–113. [Google Scholar] [CrossRef]
- Wachholz, P.A.; Moreira, V.G.; Oliveira, D.; Watanabe, H.A.W.; Boas, P.J.F.V. Occurrence of infection and mortality by covid-19 in care homes for older people in brazil. In Occurrence of Infection and Mortality by Covid-19 in Care Homes for Older People in Brazil; Botucatu Medical School-São Paulo State University: Botucatu, Brazil, 2020. [Google Scholar] [CrossRef]
- Tolson, D.; Rolland, Y.; Andrieu, S.; Aquino, J.P.; Beard, J.; Benetos, A.; Berrut, G.; Coll-Planas, L.; Dong, B.; Forette, F.; et al. International Association of Gerontology and Geriatrics: A Global Agenda for Clinical Research and Quality of Care in Nursing Homes. J. Am. Med. Dir. Assoc. 2011, 12, 184–189. [Google Scholar] [CrossRef] [PubMed]
- Shepherd, V.; Wood, F.; Hood, K. Establishing a Set of Research Priorities in Care Homes for Older People in the UK: A Modified Delphi Consensus Study with Care Home Staff. Age Ageing 2016, 46, 284–290. [Google Scholar] [CrossRef]
- Wachholz, P.A.; Ricci, N.A.; Hinsliff-Smith, K.; Devi, R.; Shepherd, V.; VillasBoas, P.J.F.; Jacinto, A.F.; Watanabe, H.A.W.; Oliveira, D.; Gordon, A.L. Research on Long-Term Care Homes for Older People in Brazil: Protocol for a Scoping Review. East Midl. Res. Ageing Netw. 2019, 32, 1–16. [Google Scholar]
- Tricco, A.C.; Lillie, E.; Zarin, W.; O’Brien, K.K.; Colquhoun, H.; Levac, D.; Moher, D.; Peters, M.D.J.; Horsley, T.; Weeks, L.; et al. PRISMA Extension for Scoping Reviews (PRISMA-ScR): Checklist and Explanation. Ann. Intern. Med. 2018, 169, 467–473. [Google Scholar] [CrossRef] [PubMed]
- Peters, M.; Godfrey, C.; McInerney, P.; Soares, C.; Khalil, H.; Parker, D. The Joanna Briggs Institute Reviewers’ Manual 2015 Methodology for JBI Scoping Reviews; The Joanna Briggs Institute, Ed.; The Joanna Briggs Institute: Adelaide, Australia, 2015. [Google Scholar]
- Trapé, T.L.; Campos, R.O. The Mental Health Care Model in Brazil: Analyses of the Funding, Governance Processes, and Mechanisms of Assessment. Rev. Saude Publica 2017, 51, 19. [Google Scholar] [CrossRef] [PubMed]
- Pluye, P.; Robert, E.; Cargo, M.; Bartlett, G. Mixed methods appraisal tool (MMAT) version 2018. Regist. Copyr. 2018, 1148552, 10. [Google Scholar]
- Hong, Q.N.; Pluye, P.; Fàbregues, S.; Bartlett, G.; Boardman, F.; Cargo, M.; Dagenais, P.; Gagnon, M.P.; Griffiths, F.; Nicolau, B.; et al. Improving the Content Validity of the Mixed Methods Appraisal Tool: A Modified e-Delphi Study. J. Clin. Epidemiol. 2019, 111, 49–59. [Google Scholar] [CrossRef] [PubMed]
- Hong, Q.N.; Fàbregues, S.; Bartlett, G.; Boardman, F.; Cargo, M.; Dagenais, P.; Gagnon, M.P.; Griffiths, F.; Nicolau, B.; O’Cathain, A.; et al. The Mixed Methods Appraisal Tool (MMAT) Version 2018 for Information Professionals and Researchers. Educ. Inf. 2018, 34, 285–291. [Google Scholar] [CrossRef]
- Erlingsson, C.; Brysiewicz, P. A Hands-on Guide to Doing Content Analysis. Afr. J. Emerg. Med. 2017, 7, 93–99. [Google Scholar] [CrossRef] [PubMed]
- Fu, L.; Sun, Z.; He, L.; Liu, F.; Jing, X. Global Long-Term Care Research: A Scientometric Review. Int. J. Environ. Res. Public Health 2019, 16, 2077. [Google Scholar] [CrossRef] [PubMed]
- Bressan, V.; Cadorin, L.; Bianchi, M.; Barisone, M.; Rossi, S.; Bagnasco, A.; Carnevale, F.; Sasso, L. Research in Italian nursing practice: An extensive review of literature. Prof. Inferm. 2019, 72, 77–88. [Google Scholar] [CrossRef]
- Medeiros, M.; Souza, P.H. The State and Income Inequality in Brazil; Discussion Paper; IPEA-Instituto de Pesquisa Econômica Aplicada: Rio de Janeiro, Brazil, 2015. Available online: http://repositorio.ipea.gov.br/bitstream/11058/5182/1/DiscussionPaper_194.pdf (accessed on 10 September 2020).
- Goodman, C.; Davies, S. ENRICH: A New Innovation to Facilitate Dementia Research in Care Homes. Br. J. Community Nurs. 2012, 17, 277. [Google Scholar] [CrossRef] [PubMed]
- Giacomin, K.C. Frente Nacional de Fortalecimento ás Instituições de Longa Permanência Para Idosos. Available online: https://sbgg.org.br/wp-content/uploads/2020/06/Relato%CC%81rio-final-FN_fichaC.pdf (accessed on 25 October 2020).
References
- World Health Organization. Regional Office for South-East Asia. Ageing and Health. 2019. Available online: (accessed on 5 February 2018).
- Pot, A.M.; Briggs, A.M.; Beard, J.R. The Sustainable Development Agenda Needs to Include Long-Term Care. J. Am. Med. Dir. Assoc. 2018, 19, 725–727.
- Beard, J.R.; Officer, A.M.; Cassels, A.K. The World Report on Ageing and Health. GERONT 2016, 56, S163–S166.
- Committee on Population; Division of Behavioral and Social Sciences and Education; National Academies of Sciences, Engineering and Medicine. Future Directions for the Demography of Aging: Proceedings of a Workshop; Hayward, M.D., Majmundar, M.K., Eds.; National Academies Press: Washington, DC, USA, 2018; p. 25064. ISBN 978-0-309-47410-8.
- Roquete, F.F.; Batista, C.C.R.F.; Arantes, R.C.; Roquete, F.F.; Batista, C.C.R.F.; Arantes, R.C. Care and Management Demands of Long-Term Care Facilities for the Elderly in Brazil: An Integrative Review (2004–2014). Rev. Bras. Geriatr. Gerontol. 2017, 20, 286–299.
- Camarano, A.A.; Kanso, S. As instituições de longa permanência para idosos no Brasil. Rev. Bras. Estud. Popul. 2010, 27, 232–235.
- Jacinto, A.F.; Achterberg, W.; Wachholz, P.A.; Dening, T.; Harrison Dening, K.; Devi, R.; Oliveira, D.; Everink, I.; Gaiolla, P.A.; Villas Bôas, P.J.F.; et al. Using international collaborations to shape research and innovation into care homes in brazil: A white paper. J. Nurs. Home Res. Sci. 2020, 6, 109–113.
- Wachholz, P.A.; Moreira, V.G.; Oliveira, D.; Watanabe, H.A.W.; Boas, P.J.F.V. Occurrence of infection and mortality by covid-19 in care homes for older people in brazil. In Occurrence of Infection and Mortality by Covid-19 in Care Homes for Older People in Brazil; Botucatu Medical School-São Paulo State University: Botucatu, Brazil, 2020.
- Tolson, D.; Rolland, Y.; Andrieu, S.; Aquino, J.P.; Beard, J.; Benetos, A.; Berrut, G.; Coll-Planas, L.; Dong, B.; Forette, F.; et al. International Association of Gerontology and Geriatrics: A Global Agenda for Clinical Research and Quality of Care in Nursing Homes. J. Am. Med. Dir. Assoc. 2011, 12, 184–189.
- Shepherd, V.; Wood, F.; Hood, K. Establishing a Set of Research Priorities in Care Homes for Older People in the UK: A Modified Delphi Consensus Study with Care Home Staff. Age Ageing 2016, 46, 284–290.
- Wachholz, P.A.; Ricci, N.A.; Hinsliff-Smith, K.; Devi, R.; Shepherd, V.; VillasBoas, P.J.F.; Jacinto, A.F.; Watanabe, H.A.W.; Oliveira, D.; Gordon, A.L. Research on Long-Term Care Homes for Older People in Brazil: Protocol for a Scoping Review. East Midl. Res. Ageing Netw. 2019, 32, 1–16.
- Tricco, A.C.; Lillie, E.; Zarin, W.; O’Brien, K.K.; Colquhoun, H.; Levac, D.; Moher, D.; Peters, M.D.J.; Horsley, T.; Weeks, L.; et al. PRISMA Extension for Scoping Reviews (PRISMA-ScR): Checklist and Explanation. Ann. Intern. Med. 2018, 169, 467–473.
- Peters, M.; Godfrey, C.; McInerney, P.; Soares, C.; Khalil, H.; Parker, D. The Joanna Briggs Institute Reviewers’ Manual 2015 Methodology for JBI Scoping Reviews; The Joanna Briggs Institute, Ed.; The Joanna Briggs Institute: Adelaide, Australia, 2015.
- Trapé, T.L.; Campos, R.O. The Mental Health Care Model in Brazil: Analyses of the Funding, Governance Processes, and Mechanisms of Assessment. Rev. Saude Publica 2017, 51, 19.
- Pluye, P.; Robert, E.; Cargo, M.; Bartlett, G. Mixed methods appraisal tool (MMAT) version 2018. Regist. Copyr. 2018, 1148552, 10.
- Hong, Q.N.; Pluye, P.; Fàbregues, S.; Bartlett, G.; Boardman, F.; Cargo, M.; Dagenais, P.; Gagnon, M.P.; Griffiths, F.; Nicolau, B.; et al. Improving the Content Validity of the Mixed Methods Appraisal Tool: A Modified e-Delphi Study. J. Clin. Epidemiol. 2019, 111, 49–59.
- Hong, Q.N.; Fàbregues, S.; Bartlett, G.; Boardman, F.; Cargo, M.; Dagenais, P.; Gagnon, M.P.; Griffiths, F.; Nicolau, B.; O’Cathain, A.; et al. The Mixed Methods Appraisal Tool (MMAT) Version 2018 for Information Professionals and Researchers. Educ. Inf. 2018, 34, 285–291.
- Erlingsson, C.; Brysiewicz, P. A Hands-on Guide to Doing Content Analysis. Afr. J. Emerg. Med. 2017, 7, 93–99.
- Fu, L.; Sun, Z.; He, L.; Liu, F.; Jing, X. Global Long-Term Care Research: A Scientometric Review. Int. J. Environ. Res. Public Health 2019, 16, 2077.
- Bressan, V.; Cadorin, L.; Bianchi, M.; Barisone, M.; Rossi, S.; Bagnasco, A.; Carnevale, F.; Sasso, L. Research in Italian nursing practice: An extensive review of literature. Prof. Inferm. 2019, 72, 77–88.
- Medeiros, M.; Souza, P.H. The State and Income Inequality in Brazil; Discussion Paper; IPEA-Instituto de Pesquisa Econômica Aplicada: Rio de Janeiro, Brazil, 2015. Available online: (accessed on 10 September 2020).
- Goodman, C.; Davies, S. ENRICH: A New Innovation to Facilitate Dementia Research in Care Homes. Br. J. Community Nurs. 2012, 17, 277.
- Giacomin, K.C. Frente Nacional de Fortalecimento ás Instituições de Longa Permanência Para Idosos. Available online: (accessed on 25 October 2020).