The segmentation of liver blood vessels is of major importance as it is essential for formulating diagnoses, planning and delivering treatments, as well as evaluating the results of clinical procedures. Different imaging techniques are available for application in clinical practice, so the segmentation methods should take into account the characteristics of the imaging technique.
- liver vessels
- segmentation
- liver vessel segmentation
- vascular segmentation
- segmentation methods
- medical imaging
1. Introduction
Two parts can be distinguished in the liver vein system: hepatic veins and the portal vein. They have a very complex, tree-like structure. According to anatomy, venous blood flows through the portal vein, into liver, and then flows into the inferior vena cava through the hepatic veins. Hepatocellular carcinoma constitutes one of the most deadly cancers in the world [1]. Computer-assisted liver surgery (e.g., ablation and embolization) allows the clinical treatment of unresected liver tumors. Prior to this treatment, it is very important for physicians to have information about the liver contour and about its venous system. It is used for preoperative planning and intraoperative navigation. Liver vessels that feed neoplasms should be accurately located during liver embolization surgery. Knowing the detailed location of the tumor between liver vessels and information such as the diameter of vessels can determine the outcome of the ablation. New technologies are constantly being introduced into clinical practice to improve the ability to visualize blood vessels, including those of liver. They include: computed tomography (CT), computed tomography angiography (CTA), magnetic resonance (MR), and ultrasonography (USG).
FigureFigure 1 1 shows an example of a CT scanner, and FigureFigure 2 2 shows a CT examination of the abdominal cavity and liver. Figure 3 shows a nurse monitoring patient during a CT scan. FigureFigure 4 4 shows sample CT images of liver and a 3D visualization of its blood vessels.
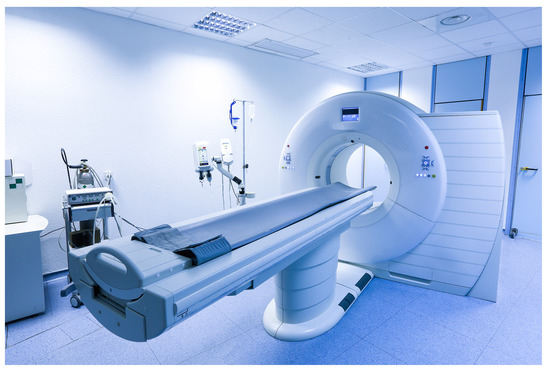
Figure 1. A CT scanner suitable for imaging the abdominal cavity and liver (courtesy of @ zlikovec/Depositphotos.com).

Figure 2. A CT examination of a patient to scan the abdominal cavity and liver (courtesy of @ monkeybusiness/Depositphotos.com).
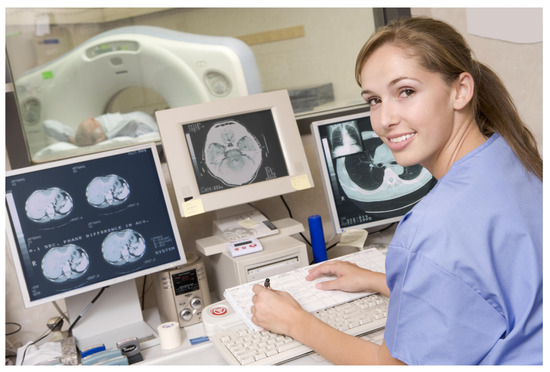
Figure 3. A nurse during a CT examination with the operating software visible (courtesy of @ monkeybusiness/Depositphotos.com). The monitor on the left displays example slices of the abdominal cavity and liver. Liver slices are shown in more detail in Figure 4.
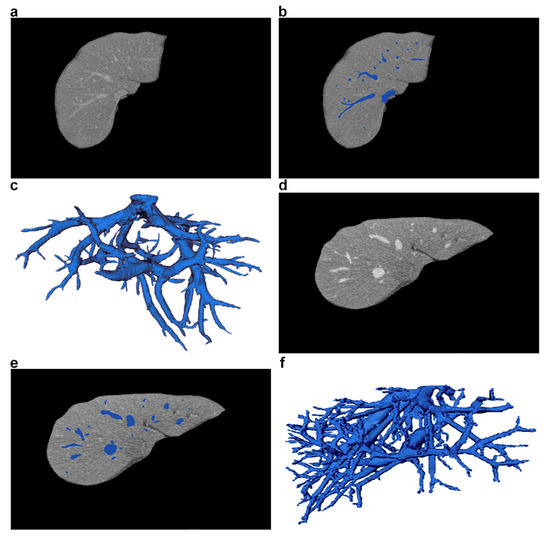
Figure 4. Sample CT images of liver and its blood vessels, taken from two different patients. (a,d) CT liver slices with vessels (axial view). (b,e) Vessel segmentation marked in blue. (c,f) 3D visualization of liver vessel trees.
Manual liver vessel segmentation is time consuming and tedious and often becomes impossible if the number of medical images is high. In addition, its results may vary, as they depend on the operators’ experience and skill.
Automated and semi-automated image processing tools can reduce the number of manual interactions and greatly simplify the work of physicians, which is why they are attracting the increasing attention of researchers, as proven by the large number of articles published on this subject. There are many studies of blood vessel segmentation in the literature, including review papers in this field [2][3][4][5][6][2,3,4,5,6]. However, due to the intensive progress in research, new review papers are needed to update the state-of-the-art and examine the results obtained in detail.
2. Methods of Segmenting Liver Blood Vessels
At the pre-processing stage, input images are filtered to eliminate noise, enhance contrast, and extract features (Figure 5). Different pre-processing methods are employed because the imaging techniques (i.e., CT, CTA, MR, USG, according to Table 1) and equipment used produce images of different resolution, contrast, and noise in them. A detailed literature review concerning the different pre-processing methods was presented in [7][39].
Methods for segmenting liver blood vessels can be divided into the following groups:
- -
-
Vessel enhancement approaches
- -
-
Active contour methods
- -
-
Tracking methods
- -
-
Machine learning approaches
Vessel enhancement approaches improve the contrast of vessels and make them easier to extract from the background of the image, for example by applying thresholding. However, as Figure 5 shows, vessel contrast enhancement also constitutes the initial stage used by other methods to produce the final segmentation. There are comprehensive reviews of the literature on enhancement methods [3][8][9][3,40,41], so these methods are not described here. The last step in segmentation is post-processing, which has a supporting role and is intended to, e.g., remove noise and minor artifacts that do not correspond to vessels, as well as to connect vessel sections if they are incomplete as a result of the segmentations done.
3. Publicly Available Evaluation Datasets
TableTable 3 1 lists five publicly available datasets containing images for segmenting and producing 3D visualizations of liver blood vessels. Three datasets are used for research according to a current review of the literature, namely:
- -
-
Segmentation of the Liver Competition 2007 (SLIVER07) [10][51]
- -
-
3D Image Reconstruction for Comparison of Algorithm Database (3D-IRCADb) [11][53]
- -
-
Vascular Synthesizer [12][54]
The dataset called Medical Segmentation Decathlon (MSD) [13][55] has not been included in research results yet as it has only recently been published, but it contains vascular ground-truths. The second dataset in which vascular ground-truth masks have been made available is 3D-IRCADb [11][53]. The Combined (CT-MR) Healthy Abdominal Organ Segmentation—CHAOS challenge database [14][56] is available as a set of CT and MR images of liver and its blood vessels. It has only been published recently and has not yet been used in research.
Table 13. Publicly available evaluation datasets. SLIVER07, Segmentation of the Liver Competition 2007; 3D-1RCADb, 3D Image Reconstruction for Comparison of Algorithm Database; MSD, Medical Segmentation Decathlon.
Name Number of Images/Volumes SLIVER07 [10] SLIVER07 [51] 30 CT 3D-1RCADb [11] 3D-1RCADb [53] 22 CT (http://www.ircad.fr/research/3dircadb/) (accessed on 5 May 2019) MSD [13] MSD [55] 443 CT (http://medicaldecathlon.com/) (accessed on 20 December 2020) CHAOS [14] CHAOS [56] 50 CT and 59 MR (https://chaos.grand-challenge.org/Data/) (accessed on 20 December 2020) Vascular Synthesizer [12] Vascular Synthesizer [54] 120 (3D synthetic data) Unfortunately, manual segmentation is a tedious and time-consuming task. What is more, it requires much input from experts. Synthetic data, in turn, allow representing certain important characteristics of the vessel tree, such as its thickness, tortuousness, and brightness profile [12][54]. These characteristics are important for evaluating methods under development. In addition, synthetic data can easily be modified. However, despite these advantages, phantoms cannot replace clinical data, including, e.g., the high variability of vessel shape, which results from patients’ individual traits. This is why some studies use both real medical images and synthetic data for the best possible matching of the necessary parameters and obtaining reliable results. Unfortunately, there is no publicly available dataset for ultrasonographic (USG) images in Table 1Table 3. This is because such a dataset does not exist yet.