Metastasis is the cause of most cancer deaths and continues to be the biggest challenge in clinical practice and laboratory investigation. The challenge is largely due to the intrinsic heterogeneity of primary and metastatic tumor populations and the complex interactions among cancer cells and cells in the tumor microenvironment. Therefore, it is important to determine the genotype and phenotype of individual cells so that the metastasis-driving events can be precisely identified, understood, and targeted in future therapies. Single-cell sequencing techniques have allowed the direct comparison of the genomic and transcriptomic changes among different stages of metastatic samples. Single-cell imaging approaches have enabled the live visualization of the heterogeneous behaviors of malignant and non-malignant cells in the tumor microenvironment.
- cancer metastasis
- single-cell sequencing
- single-cell imaging
1. Introduction
Metastasis is the leading cause of cancer death and has long been a major issue in cancer research [1][2]. Although metastasis is usually found at later or advanced stages, it might occur prior to or at the same time as primary tumor diagnosis [3]. Cancer metastasis involves a series of events known as the metastatic cascade. Briefly, cancer cells detach from the primary tumor mass and enter the circulation, i.e., intravasate primarily into the bloodstream but may also enter the lymphatic system. These cancer cells are named circulating tumor cells (CTCs). The CTCs extravasate, i.e., exit from the vessels when they arrive at distant sites such as the bone, brain, lung, or liver. These cells are then named disseminated tumor cells (DTCs). DTCs adhere and colonize at the distant organs. They may keep proliferating to detectable micrometastases and macrometastases, or stay dormant for years and even decades until being activated/reactivated for proliferation [1][4][5]. The phylogeny of metastasized tumors has been proposed through genetic studies; we also know that many factors, including tumor-intrinsic factors and those from the host microenvironment, control and regulate the metastasis [4]. Bulk metastatic tumor studies helped us sketch the scenarios of metastasis and identify common molecular biomarkers and therapeutic targets. However, genetic heterogeneity is diluted. On the one hand, druggable genomic and transcriptomic alterations are diverse and may represent only small subsets of patients in certain tumor types, which limits their clinical readout in biomarker-driven clinical trials [5]. On the other hand, we could have missed some cells with low proportions which could escape therapy and grow into resistant or relapsed tumors [6]. Moreover, macrometastases may have already undergone some essential but transient events along the metastasis cascade from colonization to micrometastases. Due to these unknown essentials, there is no precision therapy to specifically prevent or target metastasis. Therefore, advanced technologies and approaches are needed to break the limitations of our understanding of the biology of metastasis and to develop novel and effective therapeutic strategies to prevent and cure metastasis.
2. Single-Cell Sequencing
2.1. The Overall Experiment Flow
The high accuracy and specificity of next-generation sequencing (NGS) facilitate the high-throughput characterization of RNA expression and DNA alteration. Single-cell sequencing (SCS) is a collective term for sequencing methods on DNA and RNA at the single-cell resolution. Such methods have been developed to amplify the input with the lowest biases while maintaining the high-throughput coverage of genomic and transcriptomic information. Currently, SCS can be performed to examine the status of DNA, RNA, and proteins [7]. Various SCS platforms share a common workflow, as outlined below.
2.1.1. Single-Cell Capture and Nucleic Acid Isolation
The first step for SCS is single cell isolation, which can be carried out through micromanipulation (capillary pipette), laser capture, flow cytometry sorting, or microfluidic devices, depending on the type of starting materials (Figure 1). Recent technical advances also allow CTC or DTC isolation via liquid biopsy including peripheral blood, bone marrow, and cerebrospinal fluid [8][9][10]. The direct isolation of a single cell nucleus is preferred when unprocessed mRNA or genomic information is to be collected. Nonetheless, the isolation methods dictate the final output in terms of purity and detection capacity.
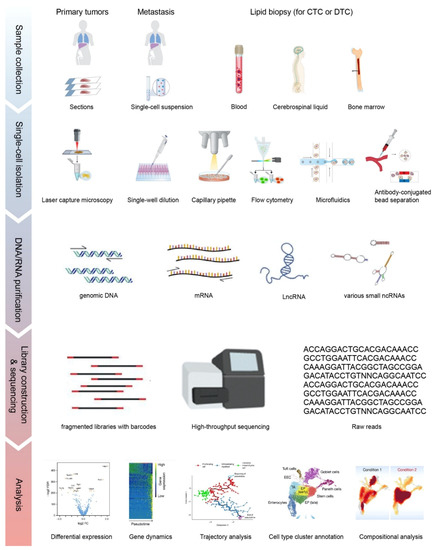
Figure 1. The overall workflow of single-cell sequencing (SCS). Single cells are isolated from solid tissues or liquid biopsies via different approaches. Libraries generated from purified nucleic acids are sequenced on the 2nd or 3rd generation sequencing platforms. Raw reads are processed and visualized as shown in different applications in the Analysis section, including marker gene selection by differential expression, pseudotime tracking by trajectory analysis and cell type cluster to elucidate the population. Parts of the subplots are adapted from the figures in the reference literature [11][12][13]. CTC: circulating tumor cell; DTC: disseminated tumor cell.
For the isolation of CTCs, the epithelial cell adhesion molecule (EpCAM) is usually adopted as a marker to capture CTCs and to minimize blood cell contamination. However, it is only applicable for CTCs with a high expression of EpCAM. To capture CTCs with a low expression of EpCAM, microfluidic devices and size-based selection approaches are applied [14]. With size-based selection, more CTCs and their heterogeneities are captured, but contamination from other types of cells is not excluded.
2.1.2. Library Preparation and Sequencing
The library preparation protocols vary on the downstream sequencing platforms. DNA or cDNA from each cell can be labeled with barcodes and then pooled together for sequencing. Most of the SCS methods are based on next-generation sequencing with typical read lengths of 50–150 bp, while SCS approaches such as SMART-Seq and SMART-Seq2 that are powered by third-generation sequencing (also known as long-read sequencing) can process longer reads of up to several kb. The extracted nucleic acids from single cells have to be fragmented to a certain required size range by physical sheering or chemical ion-based methods prior to the adaptor ligation. In addition, unique molecular identifiers of 4–10 bp are introduced to each transcript during reverse transcription to distinguish the reads between amplified copies of the same mRNA molecule and other mRNA molecules transcribed from the same gene.
2.1.3. Data Processing
The workflow for SCS data processing can be simplified into three steps:
-
File conversion. Convert the raw reads from any SCS machinery to a standardized format, such as fastq.
-
Demultiplexing, dataset quality control (QC), filtering, and alignment. Reads can be aligned to a reference genome or transcriptome via typical aligners such as STAR or HISAT2, or by pseudo-aligners such as Kallisto [15][16][17].
-
Data visualization and interpretation. Multiple open-source software packages are available for the visualization of cell clusters and subpopulation identification, i.e., Seurat, t-SNE, and UMAP [18][19][20].
-
File conversion. Convert the raw reads from any SCS machinery to a standardized format, such as fastq.
-
Demultiplexing, dataset quality control (QC), filtering, and alignment. Reads can be aligned to a reference genome or transcriptome via typical aligners such as STAR or HISAT2, or by pseudo-aligners such as Kallisto [15][16][17].
-
Data visualization and interpretation. Multiple open-source software packages are available for the visualization of cell clusters and subpopulation identification, i.e., Seurat, t-SNE, and UMAP [18][19][20].
The analysis pipeline used for SCS experiments is variable and can be customized based on the research objectives. Those interested in getting into this growing field can refer to two systematic reviews of bioinformatic tools for SCS [11][21]. To be noted, although RNA sequencing is mostly used to assess gene expression, it can also give information about genetic variants. Multiple packages have been developed, including inferCNV, CONICSmat and CaSpER, to identify copy number variations (CNVs) from single-cell RNA-Seq (scRNA-Seq) data to infer mutational phylogenies of cancer cell populations across different samples [22][23][24].
2.2. Single-Cell RNA-Seq (scRNA-Seq) in Metastatic Studies
The first SCS study was reported in 2009, in which a single-cell whole transcriptome sequencing protocol was developed to analyze transcriptome complexity in a single mouse blastomere. 75% more gene expressions were detected compared to using the microarray [25]. Since then, scRNA-seq has been advanced to easier cell isolation, higher cell throughput, greater gene coverage, longer read length, and less bias. The advances of scRNA-Seq also benefit metastatic studies.
2.2.1. Spatial Understanding: Mapping the Diversities of the Metastatic Microenvironment
ScRNA-seq allows for high-resolution analyses of the cellular constitution of metastatic tumors in the tumor microenvironment, including fibroblasts, endothelia, various immune cells, etc. As a result, the complexities and dynamics of the metastasis ecosystem can be explored. Studies using this approach have been conducted on various metastases of many cancer types, for example, transcriptome profiling the transcriptomes of nearly 6000 single cells of 18 head and neck squamous cell carcinoma patients, including five matched pairs of primary tumors and lymph node metastases. The stromal and immune cells shared expression patterns across patients, but malignant cells varied within and between tumors. Cells expressing the partial epithelial-to-mesenchymal transition program spatially localized to the leading edge of primary tumors and this program served as an independent predictor of nodal metastasis, grade, and adverse pathologic features [26]. A single-cell transcriptome study in liver metastatic colorectal cancer tissues (2770 cells) and adjacent normal liver tissues (2391 cells) from one patient revealed granulocyte enrichment in the liver metastases and discovered a positive correlation between ferroptosis-mediated cell death and hyperactivated Wnt signaling in the enriched granulocytes [27]. A study comparing the cellular composition and transcriptional states in matched samples of metastatic prostate cancer cells and adjacent bone marrow in the spinal cord, as well as bone marrow from orthopedic patients without malignancy, identified that the metastatic tumors had significant exhaustion of cytotoxic T lymphocytes but an increase in inflammatory lymphocytes and macrophages [28]. This study also found that the increased chemokine CCL20, produced by myeloid cells and its cognate CCR6 receptor on T-cells was associated with repressed immune responses, suggesting this might be the cause of the poor response to immune therapy by metastatic prostate cancer, as reported in recent clinical trials [29][30]. A study on myeloma found that CXCL12, a key molecule involved in CXCR4-dependent cell retention in bone marrow, was upregulated in circulating plasma cells and potentially induced myeloma cells’ intravasation [31].
Besides mapping the diversity of tumor microenvironment, scRNA-Seq is also helping to identify new therapeutic targets for metastasis. A recent study on uveal melanoma, which is highly metastatic, interrogated the tumor microenvironment (TME) at a single-cell resolution using scRNA-seq of ~60k tumors and non-neoplastic cells from primary and metastatic samples [32]. They found that among the tumor-infiltrating immune cells, the CD8+ T cells had only minimal expressions of CTLA-4 and PD-1 but the strongest expression of LAG3. This indicates T cell exhaustion and may partially explain the failure of targeting CTLA-4 and/or PD-1 in uveal melanoma. LAG3 blockade could be a potential effective immune therapy for these patients [32].
2.2.2. Temporal Understanding: Identifying Drivers of Metastasis
Beyond the established metastatic tumors, circulating tumor cells (CTCs) serve as the bridges and messengers between primary tumors and metastatic tumors. Unlike the transcriptomic gene expression profiling of bulk CTC samples, scRNA-seq is able to exclude the contamination from nonmalignant cells and cover the full-spectrum of CTC heterogeneity. The first scRNA-seq in CTC was conducted using SMART-Seq to characterize full-length mRNA profiles from melanoma patient samples and identified distinct potential metastatic biomarkers in CTC such as CDH1 and HLA1 [33]. By comparing the genome-wide expression profiles of CTCs with matched primary tumors in a mouse model of pancreatic cancer, another study discovered that CTCs clustered separately from primary tumors and tumor-derived cell lines, and they presented a low-proliferation signature [34]. The aberrant expression of stromal extracellular matrix genes by CTCs revealed the relevance of epithelial to mesenchymal transition (EMT) and contributions of microenvironmental signals to metastasis [34]. Novel findings were made in CTCs. For example, the elevation of noncanonical Wnt signaling (Wnt5a) was found to be associated with anti-androgen resistance through scRNA-seq of 77 CTCs from 13 prostate cancer patients [35]. Markers of cancer stem cells (CSCs) and of EMT were found in breast cancer through scRNA-seq of 666 CTCs from 21 breast cancer patient samples [36]. A consistent induction of β-globin (HBB) was observed in CTCs across breast, prostate, and lung cancers [37]. HBB was induced by KLF4 upon intracellular reactive oxygen species (ROS), and contributed to the survival of tumor cells under ROS stress, suggesting a cytoprotective effect of the signaling to suppress intracellular ROS during the circulation in the bloodstream [37].
These CTC profiling studies are snapshots of the metastatic cascade. A technical breakthrough, however, is the longitudinal CTC profiling. Through an optofluidic system that continuously collects fluorescently labeled CTCs from a genetically engineered mouse model, the researchers were able to use scRNA-Seq in profiling CTCs isolated longitudinally from the mice over four-day treatments with JQ1, an inhibitor of the bromodomain and extraterminal (BET) family of bromodomain proteins [38]. This is probably the first time the dynamic drug responses in terms of CTCs have been revealed. The future of translating this technology into clinical practice is very exciting. Furthermore, a recent study characterized single-cell profiles of CTCs in the cerebrospinal fluid in lung adenocarcinoma leptomeningeal metastases [9]. This advance provides the opportunity to compare CTCs from blood and CTCs from more local metastatic environments and, thus, the understanding of the site preference mechanisms in metastasis.
Altogether, these studies demonstrated the power of scRNA-seq in profiling CTCs, which are believed to be one of the best candidates in diagnosis and prognosis in metastasis prevention and treatment. The major challenges are capturing pure CTCs with high quality and translating new technologies into clinic.
2.3. Single-Cell Whole Genomic Sequencing and Whole-Exome Sequencing in Metastatic Studies
The next-generation sequencing of bulk tumors suggested that metastasis is initiated by a subclone of the primary tumor, based on their shared genomic alterations between primary and respective metastatic tumors. However, metastatic tumors often have unique mutations or genomic alterations that are not found in the primary tumors. The question is whether the metastasis-exclusive mutations were present below the detection limit in the primary tumor or whether they evolve after leaving the primary site. The single-cell whole-genome sequencing (scWGS) in isolated single nuclei of breast cancer cells was developed in order to answer these questions [39]. This was also the first SCS study in metastasis. Flow-sorted single-nucleus sequencing was performed for a previously identified genetically homogeneous breast duct carcinoma (52 nuclei) and its paired liver metastasis (48 nuclei). It was found that a single clonal expansion from the primary tumor evolved to metastasis. Following this study, single-cell whole-exome sequencing (scWES) was developed in 2012, focusing on protein-coding genomic regions in the metastasis study [40][41].
WGS and WES can profile the genomic landscapes in CTCs and metastatic tumors, including single-nucleotide variants (SNVs), insertions/deletions (indels), copy number alterations/variations (CNAs/CNVs), and the loss of heterozygosity (LOH). Similar to the transcriptomic landscape of CTCs, the intrapatient and interpatient heterogeneity of CTCs at the genomic level are frequently observed in prostate, lung, and breast cancer [42][43][44][45][46]. Using scWGS, androgen receptor (AR) gene positive or negative prostate cancer CTC subpopulations were identified during the period of androgen deprivation therapy (ADT); CNV evolution reflecting clinical response and disease progression was also observed in CTCs [47]. In metastatic breast cancer patients, the majority of CTC mutations that were detected at baseline disappeared; but some mutations were enriched and new mutations emerged during standard treatment, suggesting the evolution or shifting of the CTC population [48]. Other recent studies showed that genomic variations of CTCs represent their competencies of intravasation and migration/motility, abilities of cell–cell interactions, variations of energy metabolism, emergences of blood immune cells, and resistances to anoikis or certain therapy [16][41][42].
Furthermore, genomic alterations including CNV can also be inferred from RNA-sequecing data. While scRNA-Seq can provide useful information for characterizing the CNV architecture of essential oncogenes and tumor-suppressor genes, copy numbers of intergenic regions are not well represented. This limitation is also shared by scWES [49]. However, scWGS provides more coverage of genomic information [49]. Therefore, scWGS is recommended to get a much broader spectrum of CNV landscape in metastatic cascade. Recent studies that integrated genomic sequencing data and scRNA-Seq in CNV calling have achieved better information of evolution [22][50].
3. Single-Cell Imaging
3.1. Seeing Is Believing: Single-Cell Imaging Basics
Imaging approaches allow one to visualize metastasis in situ/in vivo and answer the questions that are beyond the capability of SCS. For example, what and how do different subtypes of cancer cells distribute spatially in a tumor mass? How do cancer cells connect with adjacent cells in the microenvironment? What types of immune cells were excluded from or infiltrate into the tumor, and when? In clinical practice, multiple imaging tools have been applied in the diagnosis of cancer metastasis, such as positron emission tomography (PET), magnetic resonance imaging (MRI), computed tomography (CT), and the like. However, these imaging modalities are not at a single-cell resolution. The single-cell imaging of cancer cells has been achieved in monolayer cultures with simple microscopy. Current techniques in super-resolution microscopy can even distinguish single-molecule dynamics at a nanometer resolution [51][52]. However, the acquisition of single-cell resolution images in in vivo samples, live or fixed, is far more challenging. Tissue status (live or fixed), label strategies (fluorescent, bioluminescent or others), signal-collecting instruments (balancing between sensitivity and specificity), and post-acquisition processing (3D deconvolution) are all limiting factors when applying the single-cell imaging technique in studying cancer metastasis.
3.2. Know Your Samples: Keep It Live or Get It Fixed?
For fixed sample sections, including patient samples, multispectral imaging with multiple antibodies will create the partial atlas of single-cell protein expressions. For example, the immune cell spatial distribution was charted using seven-plex immunofluorescence for the liver and lung metastases of colorectal cancer and infiltrated lymphocytes were found in the progressive metastatic clones [53]. Nucleic acid hybridization probes (ISH/FISH) could also be applied in sections to determine the differences between samples at the DNA or RNA levels [54][55]. The direct visualization of the deeper/inner parts of an intact tissue or an organ is challenging, because the light or signals will be scattered and hampered. To tackle this issue, one can use either a transparentized tissue/model or an imaging apparatus that can visualize more in-depth with higher penetrance.
3.3. Choose a Label—How to Track Metastatic Cancer Cells in Live Animals?
Intravital microscopy (IVM) imaging of live animals such as rats, mice and zebrafish allows one to track the real-time dynamics of metastases. IVM can image exposed tissues, or it can be carried out through optical windows or endomicroscopy. Imaging through optical windows allows metastasis observations for a relatively long period in vital organs such as the brain, liver, and lung [56][57][58]. Combining fluorescent protein tags or chemical dyes with upgraded fluorescence microscopy can allow metastatic cells to be directly observed in the organs of interest.
3.4. Signal Capture: The Choice of Microscopy in Single-Cell IVM Imaging
Confocal microscopy and multiphoton microscopy have been largely used in IVM imaging for tumors that are labeled with fluorescent proteins or stained with specific dyes. Confocal microscopy collects signals from excitation by single-photon absorbance in the focal plane and collects signals only in the focal plane, thus permitting thin optical sectioning, by either a pinhole in the laser scanning mode or a rotating disk with slits or holes in the spinning disk mode. With the use of confocal laser scanning microscopy, single cell metastases were observed in the lung from 3 to 10 weeks post injection of the RCN-9 colon cancer cells labeled with green fluorescence protein (GFP) into the liver parenchyma of male rats [59], as well as in the skull bone marrow on days 0, 3, 7, and 10 post intracardiac injections of the bone-metastatic derivative prostate cancer cell, PC-3-GFP-BM6, into transgenic nude mice with red fluorescence protein (RFP) [60]. However, the cons of this approach are: (1) fluorescence is generated via the excitation of light throughout the sample, and thus, the specimen can be bleached or damaged; and (2) a compromise of tissue penetration is the result of photons spreading from deep within the specimen experience scattering and rejection.
In contrast to single-photon confocal microscopy, multiphoton microscopy applies photons with longer wavelengths (and, thus, with lower energy); fluorophores are only excited by absorbing the energy of two or more photons simultaneously. Only the area proximal to the focal plane with a high photon density can be excited, so no more pinholes are needed to exclude non-focal signals. Additionally, the longer wavelength lights in multiphoton microscopy penetrate deeper, typically up to 2 mm below the tissue surface, and scatter less, thus there is less phototoxicity and photobleaching, allowing imaging for a longer time [61]. The responses of liver metastatic tumor cells and host stromal cells to chemotherapeutics in living mice were observed at the single-cell level after the red fluorescent protein-expressing human colorectal cancer cells (HT29) were inoculated into the spleen of green fluorescent protein-expressing nude mice [62]. GFP- or RFP-labeled T-cell lymphoma infiltration into the colon blood vessels of black C57BJ/6 mice was also observed using similar approaches [63]. Furthermore, the long-wavelength lights can produce second-harmonic generation (SHG) to image collagen fibers and allow the imaging of extracellular matrix changes (such as collagen stiffness) which is one of the hallmarks in cancer metastasis [64]. The amount and condition of the extracellular matrix adjacent to carcinoma cells can be directly observed and relatively quantified via the SHG results [65].
While multiphoton microscopy provides single-cell images with more tissue depth and less phototoxicity, the resolution at the focal plane is slightly lower than that of confocal microscopy, and pigmented samples may suffer from physical cellular damage through heating. Selective/single plane illumination microscopy (SPIM, also known as light sheet fluorescence microscopy, LSFM) is an alternative optical-sectioning approach used for imaging thick samples [66]. Light sheet microscopy uses a thin sheet (plane) of light for sample excitation (in contrast to a single-photon in confocal) and a second, separate light path for image detection to sidestep image blur created by traditional epi-illumination techniques. The result is an optically sectioned image without the need for a confocal pinhole. In addition, the sheet of light used for sample excitation dramatically reduces sample photo damage.
3.5. Specific Applications in the Near Future
Single-cell imaging is challenging at any depth of a specimen, and there is no single perfect approach for every situation. Various single-cell imaging approaches introduced above collectively enable the direct observation of metastatic cells intravasating, extravasating, and seeding into secondary sites. Multidimensional atlases of metastasis cancers include x, y, z, time course and different markers by multiplex labeling. Given the inspiring achievement of single-cell imaging techniques, future directions for single-cell imaging in metastatic studies are suggested below:
3.5.1. Noninvasive Single-Cell-Resolution Clinical Tools
Clinical tools such as CT, PET, and MRI are capable of providing noninvasive images, but they lack the resolution necessary to visualize the earliest seeding events, because a single pixel may encompass hundreds or thousands of cells. However, these tools hold the capacity to detect signals from a single cell. A brain-seeking clone of MDA-MB-231BR human breast cancer cells was magnetically labeled with fluorescent magnetic particles and injected into the left ventricles of mice, and MRI signals were able to be acquired multiple times from day 0 to day 33 post injection and provided the longitudinal tracking of individual cell fates [67]. A “cellular GPS” via PET/CT was reported in tracking a single breast cancer cell with radioisotope nanoparticle incorporation from tail vein injection to lung arrest [68]. Single-cell tracking using these methods could be applied to determine the kinetics of cell trafficking and arrest in the metastatic cascade, although it remains to be validated whether the signals from the later metastatic foci are too strong to distinguish the signals from single cells. Nonetheless, once these methods can be readily applied in patients as a single-cell resolution, we will get direct dynamics of cancer metastasis.
3.5.2. Simultaneous Monitoring of Cellular Status during Imaging
Within a tumor population, different cells likely display various states of metabolism and proliferation, which determine tumor progression and therapeutic responses. The time-lapse monitoring of the behaviors of cancer cells engineered with fluorescence ubiquitination cell cycle indicator (FUCCI) in mice via IVM, allow us to determine the cellular status of cancer cells during the interactions with infiltrating blood vessels and the progression to chemotherapy resistance [69]. More bio- and chemical-sensors of biological processes beyond the cell cycle, need to be developed and implemented into metastatic imaging.
3.5.3. Drug Bio-Distribution and -Action in Tumors
The evaluation of the drug–target engagement is essential in characterizing the response and administrating to those best responsive patients. Recently, an accumulation of HER2-targeting mAb trastuzumab (Herceptin) in tumor-associated phagocytes was observed when the AlexFluor647-conjugated mAb was injected into female mice bearing HER2-GFP breast cancer subcutaneous xenografts. Intravital multiphoton microscopy was used in this study to monitor tumor uptake of the mAb [70]. Compared to the conventional isotope labeling and mass spectrometry approach in pharmacodynamics, imaging tools offer more convenience and more layers of information in inter- and intratumor heterogeneity. More feasible imaging tools to evaluate the drug efficacy and distribution in terms of metastatic cancers need to be developed or adopted in the near future.
3.5.4. Emerging Imaging Techniques
Several emerging multiplex imaging techniques have also been applied in cancer studies. Distinct from typical multispectral immunofluorescence with limited spectrum, multiplex imaging techniques acquire information on more proteins on the same tissue section, frozen or fixed. These approaches include CyCIF (CyClic ImmunoFluorescence), CODEX (CO-Detection by indEXing), IBEX (Iterative Bleaching Extends Multiplexity) and MIBI (Multiplexed ion beam imaging) [71][72][73]. CyCIF and IBEX use similar logic of consecutive staining and quenching to repeatedly acquire images with antibody staining on the same section, resulting in imaging of up to 65 proteins; CODEX uses antibodies tagged with unique DNA oligonucleotides for subsequent staining, rather than direct labelling of fluorophores or rare metal elements, to acquire information on 40 targets; MIBI use metal-isotope-labeled antibodies in combination with time-of-flight mass spectrometry to simultaneously track up to 100 targets and can reach a sub-cellular resolution [74][75][76][77][78]. Although these techniques have not been widely applied in metastatic tumor samples yet, their potentials are highly expected.
3.5.5. Integrated Approaches of Imaging and Sequencing
An early example is SCOPE-Seq, which combined single-cell imaging and barcoded single-cell sequencing in a microwell assay, although it was not able to provide spatial information or the physiological state of cell phenotype [79]. A recent study integrated droplet scRNA-Seq, spatial transcriptomics, and MIBI to compare primary cutaneous squamous cell carcinoma and matched normal skin [80]. The authors identified three keratinocyte populations that were similar to the normal skin and a tumor-specific keratinocyte population that resided within a fibrovascular niche at leading edges of the tumors [80]. These specialized keratinocytes interacted as a hub with basal and adjacent stromal and immune cell types to exhibit invasive and immunosuppressive features, with the enrichment of integrin signaling genes ITGB1, FERMT1, and CD151 [80]. These integrated approaches and beyond are expected to be applied in metastatic studies in the near future.
References
- Seyfried, T.N.; Huysentruyt, L.C. On the Origin of Cancer Metastasis. Crit. Rev. Oncog. 2013, 18, 43–73.
- Lawson, D.A.; Kessenbrock, K.; Davis, R.T.; Pervolarakis, N.; Werb, Z. Tumour heterogeneity and metastasis at single-cell resolution. Nat. Cell Biol. 2018, 20, 1349–1360.
- Hu, Z.; Ding, J.; Ma, Z.; Sun, R.; Seoane, J.A.; Scott Shaffer, J.; Suarez, C.J.; Berghoff, A.S.; Cremolini, C.; Falcone, A.; et al. Quantitative evidence for early metastatic seeding in colorectal cancer. Nat. Genet. 2019, 51, 1113–1122.
- Gao, Y.; Bado, I.; Wang, H.; Zhang, W.; Rosen, J.M.; Zhang, X.H. Metastasis organotropism: Redefining the congenial soil. Dev. Cell. 2019, 49, 375–391.
- Zugazagoitia, J.; Guedes, C.; Ponce, S.; Ferrer, I.; Molina-Pinelo, S.; Paz-Ares, L. Current Challenges in Cancer Treatment. Clin. Ther. 2016, 38, 1551–1566.
- Boyd, A.L.; Aslostovar, L.; Reid, J.; Ye, W.; Tanasijevic, B.; Porras, D.P.; Shapovalova, Z.; Almakadi, M.; Foley, R.; Leber, B.; et al. Identification of Chemotherapy-Induced Leukemic-Regenerating Cells Reveals a Transient Vulnerability of Human AML Recurrence. Cancer Cell. 2018, 34, 483–498.
- Ren, X.; Kang, B.; Zhang, Z. Understanding tumor ecosystems by single-cell sequencing: Promises and limitations. Genome Biol. 2018, 19, 211.
- Sharma, S.; Zhuang, R.; Long, M.; Pavlovic, M.; Kang, Y.; Ilyas, A.; Asghar, W. Circulating tumor cell isolation, culture, and downstream molecular analysis. Biotechnol. Adv. 2018, 36, 1063–1078.
- Ruan, H.; Zhou, Y.; Shen, J.; Zhai, Y.; Xu, Y.; Pi, L.; Huang, R.; Chen, K.; Li, X.; Ma, W.; et al. Circulating tumor cell characterization of lung cancer brain metastasis in the cerebrospinal fluid through single-cell transcriptome analysis. MedRxiv 2020.
- Hartkopf, A.D.; Wallwiener, M.; Fehm, T.N.; Hahn, M.; Walter, C.B.; Gruber, I.; Brucker, S.Y.; Taran, F.A. Disseminated tumor cells from the bone marrow of patients with nonmetastatic primary breast cancer are predictive of locoregional relapse. Ann. Oncol. 2015, 26, 1155–1160.
- Luecken, M.D.; Theis, F.J. Current best practices in single-cell RNA-seq analysis: A tutorial. Mol. Syst. Biol. 2019, 15, e8746.
- Hwang, B.; Lee, J.H.; Bang, D. Single-cell RNA sequencing technologies and bioinformatics pipelines. Exp. Mol. Med. 2018, 50, 96.
- Trapnell, C.; Cacchiarelli, D.; Grimsby, J.; Pokharel, P.; Li, S.; Morse, M.; Lennon, N.J.; Livak, K.J.; Mikkelsen, T.S.; Rinn, J.L. The dynamics and regulators of cell fate decisions are revealed by pseudotemporal ordering of single cells. Nat. Biotechnol. 2014, 32, 381–386.
- Chen, X.X.; Bai, F. Single-cell analyses of circulating tumor cells. Cancer Biol. Med. 2015, 12, 184–192.
- Dobin, A.; Davis, C.A.; Schlesinger, F.; Drenkow, J.; Zaleski, C.; Jha, S.; Batut, P.; Chaisson, M.; Gingeras, T.R. STAR: Ultrafast universal RNA-seq aligner. Bioinformatics 2013, 29, 15–21.
- Kim, D.; Paggi, J.M.; Park, C.; Bennett, C.; Salzberg, S.L. Graph-based genome alignment and genotyping with HISAT2 and HISAT-genotype. Nat. Biotechnol. 2019, 37, 907–915.
- Bray, N.L.; Pimentel, H.; Melsted, P.; Pachter, L. Near-optimal probabilistic RNA-seq quantification. Nat. Biotechnol. 2016, 34, 525–527.
- Satija, R.; Farrell, J.A.; Gennert, D.; Schier, A.F.; Regev, A. Spatial reconstruction of single-cell gene expression data. Nat. Biotechnol. 2015, 33, 495–502.
- Vander Maaten, L.J.P.; Hinton, G.E. Visualizing High-Dimensional Data Using t-SNE. J. Mach. Learn. Res. 2008, 9, 2579–2605.
- McInnes, L.; Healy, J.; Saul, N.; Großberger, L. UMAP: Uniform Manifold Approximation and Projection. J. Open Source Softw. 2018, 3.
- Lahnemann, D.; Koster, J.; Szczurek, E.; McCarthy, D.J.; Hicks, S.C.; Robinson, M.D.; Vallejos, C.A.; Campbell, K.R.; Beerenwinkel, N.; Mahfouz, A.; et al. Eleven grand challenges in single-cell data science. Genome. Biol. 2020, 21, 31.
- Muller, S.; Cho, A.; Liu, S.J.; Lim, D.A.; Diaz, A. CONICS integrates scRNA-seq with DNA sequencing to map gene expression to tumor sub-clones. Bioinformatics 2018, 34, 3217–3219.
- Tickle, T.T.I.; Georgescu, C.; Brown, M.; Haas, B. InferCNV of the Trinity CTAT Project. Available online: (accessed on 10 January 2021).
- Serin Harmanci, A.; Harmanci, A.O.; Zhou, X. CaSpER identifies and visualizes CNV events by integrative analysis of single-cell or bulk RNA-sequencing data. Nat. Commun. 2020, 11, 89.
- Tang, F.; Barbacioru, C.; Wang, Y.; Nordman, E.; Lee, C.; Xu, N.; Wang, X.; Bodeau, J.; Tuch, B.B.; Siddiqui, A.; et al. mRNA-Seq whole-transcriptome analysis of a single cell. Nat. Methods. 2009, 6, 377–382.
- Puram, S.V.; Tirosh, I.; Parikh, A.S.; Patel, A.P.; Yizhak, K.; Gillespie, S.; Rodman, C.; Luo, C.L.; Mroz, E.A.; Emerick, K.S.; et al. Single-Cell Transcriptomic Analysis of Primary and Metastatic Tumor Ecosystems in Head and Neck Cancer. Cell 2017, 171, 1611–1624.
- Zhang, Y.; Song, J.; Zhao, Z.; Yang, M.; Chen, M.; Liu, C.; Ji, J.; Zhu, D. Single-cell transcriptome analysis reveals tumor immune microenvironment heterogenicity and granulocytes enrichment in colorectal cancer liver metastases. Cancer Lett. 2020, 470, 84–94.
- Baryawno, N.; Kfoury, Y.; Severe, N.; Mei, S.; Hirz, T.; Gustafsson, K.; Brouse, T.; Scadden, E.; Choi, B.; Barkas, N.; et al. Impact of metastatic prostate cancer on human bone marrow. BioRxiv 2020.
- Kwon, E.D.; Drake, C.G.; Scher, H.I.; Fizazi, K.; Bossi, A.; van den Eertwegh, A.J.; Krainer, M.; Houede, N.; Santos, R.; Mahammedi, H.; et al. Ipilimumab versus placebo after radiotherapy in patients with metastatic castration-resistant prostate cancer that had progressed after docetaxel chemotherapy (CA184-043): A multicentre, randomised, double-blind, phase 3 trial. Lancet. Oncol. 2014, 15, 700–712.
- Beer, T.M.; Kwon, E.D.; Drake, C.G.; Fizazi, K.; Logothetis, C.; Gravis, G.; Ganju, V.; Polikoff, J.; Saad, F.; Humanski, P.; et al. Randomized, Double-Blind, Phase III Trial of Ipilimumab Versus Placebo in Asymptomatic or Minimally Symptomatic Patients With Metastatic Chemotherapy-Naive Castration-Resistant Prostate Cancer. J. Clin. Oncol. 2017, 35, 40–47.
- Geng, S.; Wang, J.; Zhang, X.; Zhang, J.-J.; Wu, F.; Pang, Y.; Zhong, Y.; Wang, J.; Wang, W.; Lyu, X.; et al. Single-cell RNA sequencing reveals chemokine self-feeding of myeloma cells promotes extramedullary metastasis. FEBS Lett. 2020, 594, 452–465.
- Durante, M.A.; Rodriguez, D.A.; Kurtenbach, S.; Kuznetsov, J.N.; Sanchez, M.I.; Decatur, C.L.; Snyder, H.; Feun, L.G.; Livingstone, A.S.; Harbour, J.W. Single-cell analysis reveals new evolutionary complexity in uveal melanoma. Nat. Commun. 2020, 11, 496.
- Ramskold, D.; Luo, S.; Wang, Y.C.; Li, R.; Deng, Q.; Faridani, O.R.; Daniels, G.A.; Khrebtukova, I.; Loring, J.F.; Laurent, L.C.; et al. Full-length mRNA-Seq from single-cell levels of RNA and individual circulating tumor cells. Nat. Biotechnol. 2012, 30, 777–782.
- Ting, D.T.; Wittner, B.S.; Ligorio, M.; Vincent Jordan, N.; Shah, A.M.; Miyamoto, D.T.; Aceto, N.; Bersani, F.; Brannigan, B.W.; Xega, K.; et al. Single-cell RNA sequencing identifies extracellular matrix gene expression by pancreatic circulating tumor cells. Cell Rep. 2014, 8, 1905–1918.
- Miyamoto, D.T.; Zheng, Y.; Wittner, B.S.; Lee, R.J.; Zhu, H.; Broderick, K.T.; Desai, R.; Fox, D.B.; Brannigan, B.W.; Trautwein, J.; et al. RNA-Seq of single prostate CTCs implicates noncanonical Wnt signaling in antiandrogen resistance. Science 2015, 349, 1351–1356.
- Cheng, Y.H.; Chen, Y.C.; Lin, E.; Brien, R.; Jung, S.; Chen, Y.T.; Lee, W.; Hao, Z.; Sahoo, S.; Min Kang, H.; et al. Hydro-Seq enables contamination-free high-throughput single-cell RNA-sequencing for circulating tumor cells. Nat. Commun. 2019, 10, 2163.
- Zheng, Y.; Miyamoto, D.T.; Wittner, B.S.; Sullivan, J.P.; Aceto, N.; Jordan, N.V.; Yu, M.; Karabacak, N.M.; Comaills, V.; Morris, R.; et al. Expression of beta-globin by cancer cells promotes cell survival during blood-borne dissemination. Nat. Commun. 2017, 8, 14344.
- Hamza, B.; Ng, S.R.; Prakadan, S.M.; Delgado, F.F.; Chin, C.R.; King, E.M.; Yang, L.F.; Davidson, S.M.; DeGouveia, K.L.; Cermak, N.; et al. Optofluidic real-time cell sorter for longitudinal CTC studies in mouse models of cancer. Proc. Natl. Acad. Sci. USA 2019, 116, 2232–2236.
- Navin, N.; Kendall, J.; Troge, J.; Andrews, P.; Rodgers, L.; McIndoo, J.; Cook, K.; Stepansky, A.; Levy, D.; Esposito, D.; et al. Tumour evolution inferred by single-cell sequencing. Nature 2011, 472, 90–94.
- Hou, Y.; Song, L.; Zhu, P.; Zhang, B.; Tao, Y.; Xu, X.; Li, F.; Wu, K.; Liang, J.; Shao, D.; et al. Single-cell exome sequencing and monoclonal evolution of a JAK2-negative myeloproliferative neoplasm. Cell 2012, 148, 873–885.
- Xu, X.; Hou, Y.; Yin, X.; Bao, L.; Tang, A.; Song, L.; Li, F.; Tsang, S.; Wu, K.; Wu, H.; et al. Single-cell exome sequencing reveals single-nucleotide mutation characteristics of a kidney tumor. Cell 2012, 148, 886–895.
- Carlsson, A.; Kuhn, P.; Luttgen, M.S.; Dizon, K.K.; Troncoso, P.; Corn, P.G.; Kolatkar, A.; Hicks, J.B.; Logothetis, C.J.; Zurita, A.J. Paired High-Content Analysis of Prostate Cancer Cells in Bone Marrow and Blood Characterizes Increased Androgen Receptor Expression in Tumor Cell Clusters. Clin. Cancer Res. 2017, 23, 1722–1732.
- Kim, O.; Lee, D.; Chungwon Lee, A.; Lee, Y.; Bae, H.J.; Lee, H.B.; Kim, R.N.; Han, W.; Kwon, S. Whole Genome Sequencing of Single Circulating Tumor Cells Isolated by Applying a Pulsed Laser to Cell-Capturing Microstructures. Small 2019, 15, e1902607.
- Polzer, B.; Medoro, G.; Pasch, S.; Fontana, F.; Zorzino, L.; Pestka, A.; Andergassen, U.; Meier-Stiegen, F.; Czyz, Z.T.; Alberter, B.; et al. Molecular profiling of single circulating tumor cells with diagnostic intention. EMBO Mol. Med. 2014, 6, 1371–1386.
- Lu, S.; Chang, C.J.; Guan, Y.; Szafer-Glusman, E.; Punnoose, E.; Do, A.; Suttmann, B.; Gagnon, R.; Rodriguez, A.; Landers, M.; et al. Genomic Analysis of Circulating Tumor Cells at the Single-Cell Level. J. Mol. Diagn. 2020.
- Lim, S.B.; Lim, C.T.; Lim, W.T. Single-Cell Analysis of Circulating Tumor Cells: Why Heterogeneity Matters. Cancers 2019, 11, 1595.
- Dago, A.E.; Stepansky, A.; Carlsson, A.; Luttgen, M.; Kendall, J.; Baslan, T.; Kolatkar, A.; Wigler, M.; Bethel, K.; Gross, M.E.; et al. Rapid phenotypic and genomic change in response to therapeutic pressure in prostate cancer inferred by high content analysis of single circulating tumor cells. PLoS ONE 2014, 9, e101777.
- De Luca, F.; Rotunno, G.; Salvianti, F.; Galardi, F.; Pestrin, M.; Gabellini, S.; Simi, L.; Mancini, I.; Vannucchi, A.M.; Pazzagli, M.; et al. Mutational analysis of single circulating tumor cells by next generation sequencing in metastatic breast cancer. Oncotarget 2016, 7, 26107–26119.
- Mallory, X.F.; Edrisi, M.; Navin, N.; Nakhleh, L. Methods for copy number aberration detection from single-cell DNA-sequencing data. Genome Biol. 2020, 21, 208.
- Andor, N.; Lau, B.T.; Catalanotti, C.; Sathe, A.; Kubit, M.; Chen, J.; Blaj, C.; Cherry, A.; Bangs, C.D.; Grimes, S.M.; et al. Joint single cell DNA-seq and RNA-seq of gastric cancer cell lines reveals rules of in vitro evolution. NAR Genom. Bioinform. 2020, 2, lqaa016.
- Schermelleh, L.; Ferrand, A.; Huser, T.; Eggeling, C.; Sauer, M.; Biehlmaier, O.; Drummen, G.P.C. Super-resolution microscopy demystified. Nat. Cell. Biol. 2019, 21, 72–84.
- Coelho, S.; Baek, J.; Graus, M.S.; Halstead, J.M.; Nicovich, P.R.; Feher, K.; Gandhi, H.; Gooding, J.J.; Gaus, K. Ultraprecise single-molecule localization microscopy enables in situ distance measurements in intact cells. Sci. Adv. 2020, 6.
- Angelova, M.; Mlecnik, B.; Vasaturo, A.; Bindea, G.; Fredriksen, T.; Lafontaine, L.; Buttard, B.; Morgand, E.; Bruni, D.; Jouret-Mourin, A.; et al. Evolution of Metastases in Space and Time under Immune Selection. Cell 2018, 175, 751–765.
- Berberat, P.O.; Friess, H.; Wang, L.; Zhu, Z.; Bley, T.; Frigeri, L.; Zimmermann, A.; Buchler, M.W. Comparative analysis of galectins in primary tumors and tumor metastasis in human pancreatic cancer. J. Histochem. Cytochem. 2001, 49, 539–549.
- Chrzanowska, N.M.; Kowalewski, J.; Lewandowska, M.A. Use of Fluorescence In Situ Hybridization (FISH) in Diagnosis and Tailored Therapies in Solid Tumors. Molecules 2020, 25, 1864.
- Kitamura, T.; Pollard, J.W.; Vendrell, M. Optical Windows for Imaging the Metastatic Tumour Microenvironment in vivo. Trends Biotechnol. 2017, 35, 5–8.
- Choi, M.; Kwok, S.J.; Yun, S.H. In vivo fluorescence microscopy: Lessons from observing cell behavior in their native environment. Physiology 2015, 30, 40–49.
- Alieva, M.; Ritsma, L.; Giedt, R.J.; Weissleder, R.; van Rheenen, J. Imaging windows for long-term intravital imaging: General overview and technical insights. Intravital 2014, 3, e29917.
- Iguchi, K.; Oh, G.; Ookawa, K.; Yanagi, K.; Sakai, M.; Yamamoto, T.; Ishikawa, S.; Onizuka, M. In vivo observation of pulmonary micrometastasis of colon cancer in normal rats. Microvasc. Res. 2007, 73, 206–213.
- Miwa, S.; Toneri, M.; Igarashi, K.; Yano, S.; Kimura, H.; Hayashi, K.; Yamamoto, N.; Tsuchiya, H.; Hoffman, R.M. Real-Time In Vivo Confocal Fluorescence Imaging of Prostate Cancer Bone-Marrow Micrometastasis Development at the Cellular Level in Nude Mice. J. Cell Biochem. 2016, 117, 2533–2537.
- Beerling, E.; Ritsma, L.; Vrisekoop, N.; Derksen, P.W.; van Rheenen, J. Intravital microscopy: New insights into metastasis of tumors. J. Cell. Sci. 2011, 124, 299–310.
- Tanaka, K.; Okigami, M.; Toiyama, Y.; Morimoto, Y.; Matsushita, K.; Kawamura, M.; Hashimoto, K.; Saigusa, S.; Okugawa, Y.; Inoue, Y.; et al. In vivo real-time imaging of chemotherapy response on the liver metastatic tumor microenvironment using multiphoton microscopy. Oncol. Rep. 2012, 28, 1822–1830.
- Ueda, Y.; Ishiwata, T.; Shinji, S.; Arai, T.; Matsuda, Y.; Aida, J.; Sugimoto, N.; Okazaki, T.; Kikuta, J.; Ishii, M.; et al. In vivo imaging of T cell lymphoma infiltration process at the colon. Sci. Rep. 2018, 8, 3978.
- Kai, F.; Drain, A.P.; Weaver, V.M. The Extracellular Matrix Modulates the Metastatic Journey. Dev. Cell 2019, 49, 332–346.
- Wyckoff, J.; Gligorijevic, B.; Entenberg, D.; Segall, J.; Condeelis, J. High-resolution multiphoton imaging of tumors in vivo. Cold Spring Harb. Protoc. 2011, 2011, 1167–1184.
- Verveer, P.J.; Swoger, J.; Pampaloni, F.; Greger, K.; Marcello, M.; Stelzer, E.H. High-resolution three-dimensional imaging of large specimens with light sheet-based microscopy. Nat. Methods 2007, 4, 311–313.
- Heyn, C.; Ronald, J.A.; Ramadan, S.S.; Snir, J.A.; Barry, A.M.; MacKenzie, L.T.; Mikulis, D.J.; Palmieri, D.; Bronder, J.L.; Steeg, P.S.; et al. In vivo MRI of cancer cell fate at the single-cell level in a mouse model of breast cancer metastasis to the brain. Magn. Reson. Med. 2006, 56, 1001–1010.
- Jung, K.O.; Kim, T.J.; Yu, J.H.; Rhee, S.; Zhao, W.; Ha, B.; Red-Horse, K.; Gambhir, S.S.; Pratx, G. CellGPS: Whole-body tracking of single cells by positron emission tomography. BioRxiv 2019.
- Yano, S.; Hoffman, R.M. Real-Time Determination of the Cell-Cycle Position of Individual Cells within Live Tumors Using FUCCI Cell-Cycle Imaging. Cells 2018, 7, 168.
- Li, R.; Attari, A.; Prytyskach, M.; Garlin, M.A.; Weissleder, R.; Miller, M.A. Single-Cell Intravital Microscopy of Trastuzumab Quantifies Heterogeneous in vivo Kinetics. Cytometry A 2020, 97, 528–539.
- Angelo, M.; Bendall, S.C.; Finck, R.; Hale, M.B.; Hitzman, C.; Borowsky, A.D.; Levenson, R.M.; Lowe, J.B.; Liu, S.D.; Zhao, S.; et al. Multiplexed ion beam imaging of human breast tumors. Nat. Med. 2014, 20, 436–442.
- Goltsev, Y.; Samusik, N.; Kennedy-Darling, J.; Bhate, S.; Hale, M.; Vazquez, G.; Black, S.; Nolan, G.P. Deep Profiling of Mouse Splenic Architecture with CODEX Multiplexed Imaging. Cell 2018, 174, 968–981.
- Radtke, A.J.; Kandov, E.; Lowekamp, B.; Speranza, E.; Chu, C.J.; Gola, A.; Thakur, N.; Shih, R.; Yao, L.; Yaniv, Z.R.; et al. IBEX: A versatile multiplex optical imaging approach for deep phenotyping and spatial analysis of cells in complex tissues. Proc. Natl. Acad. Sci. USA 2020, 117, 33455–33465.
- Lin, J.R.; Izar, B.; Wang, S.; Yapp, C.; Mei, S.; Shah, P.M.; Santagata, S.; Sorger, P.K. Highly multiplexed immunofluorescence imaging of human tissues and tumors using t-CyCIF and conventional optical microscopes. Elife 2018, 7.
- Pietrobon, V.; Cesano, A.; Marincola, F.; Kather, J.N. Next Generation Imaging Techniques to Define Immune Topographies in Solid Tumors. Front. Immunol. 2020, 11, 604967.
- Rashid, R.; Gaglia, G.; Chen, Y.A.; Lin, J.R.; Du, Z.; Maliga, Z.; Schapiro, D.; Yapp, C.; Muhlich, J.; Sokolov, A.; et al. Highly multiplexed immunofluorescence images and single-cell data of immune markers in tonsil and lung cancer. Sci. Data 2019, 6, 323.
- Schurch, C.M.; Bhate, S.S.; Barlow, G.L.; Phillips, D.J.; Noti, L.; Zlobec, I.; Chu, P.; Black, S.; Demeter, J.; McIlwain, D.R.; et al. Coordinated Cellular Neighborhoods Orchestrate Antitumoral Immunity at the Colorectal Cancer Invasive Front. Cell 2020, 182, 1341–1359.
- Coskun, A.F.; Han, G.; Ganesh, S.; Chen, S.Y.; Clave, X.R.; Harmsen, S.; Jiang, S.; Schurch, C.M.; Bai, Y.; Hitzman, C.; et al. Nanoscopic subcellular imaging enabled by ion beam tomography. Nat. Commun. 2021, 12, 789.
- Yuan, J.; Sheng, J.; Sims, P.A. SCOPE-Seq: A scalable technology for linking live cell imaging and single-cell RNA sequencing. Genome Biol. 2018, 19, 227.
- Ji, A.L.; Rubin, A.J.; Thrane, K.; Jiang, S.; Reynolds, D.L.; Meyers, R.M.; Guo, M.G.; George, B.M.; Mollbrink, A.; Bergenstrahle, J.; et al. Multimodal Analysis of Composition and Spatial Architecture in Human Squamous Cell Carcinoma. Cell 2020, 182, 497–514.