Almond (Prunus dulcis) is a tree species that together with peach is included in the subgenus Amygdalus.
- almond (Prunus dulcis)
- cultivar
- geographical authenticity
1. Introduction
Sweet almonds have an average length of 2.3 cm, 1.4 cm width, and 0.8–1.0 cm thickness. They have a delicate, aromatic, and sweet flavour. Externally, the seeds are oval, asymmetrical, flattened, sharpened at one end and rounded at the other, with an external husk that protects them from the environmental conditions and harvest. Finally, the almond nut is surrounded by the almond skin, also called tegument, which is a thick and brown wrapper, somewhat rough with quite noticeable streaks (Figure 12). Almond kernels have low water content, while their amount of fat can range from 46% to 64% [5] [5] and their protein level can be around 10–35% [4]. It is known that these values are conditioned by cultivar and geographical origin [6]. Regarding the composition of the fat fraction, almonds are characterized by high amounts of monounsaturated and polyunsaturated fatty acids [7]. Oleic and linoleic acids are the most abundant unsaturated fatty acids in almonds, accounting for about 80–90% while saturated fatty acids, such as palmitic and stearic fatty acids, are present in lower quantities (<10%) [8]. Almonds are also noticeable for their content in minor compounds such as polyphenols, and tocopherols [9], which are correlated with antioxidant properties that reduce the risk of suffering from diseases related to oxidative stress such as arthritis, vasculitis, and high blood pressure, cancer, or Alzheimer [10]. Other minor compounds present in almonds are phytosterols or plant sterols which carry out cell functions in the plants analogous to those of cholesterol in animals.
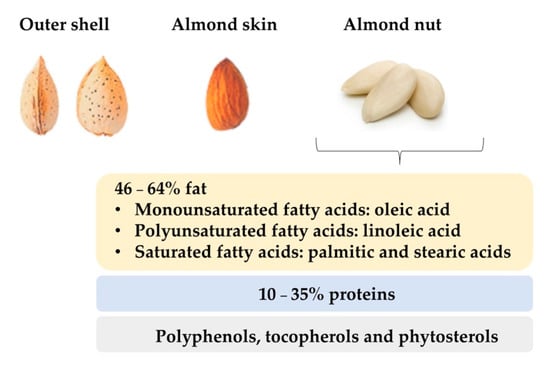
Figure 12. Physical and nutritional characteristics of almond nut.
The commercial interest in almonds is increasing because they greatly enrich many recipes and desserts in Mediterranean cuisine such as nougat, marzipan, pralines, or ice creams. Also, they can be used in different forms: natural or salty, fresh or dried, roasted or fried [11]. Several publications concluded that different almond cultivars showed dissimilar chemical composition values and physicochemical and biochemical properties [12][13][12,13]. Due to this fact, the discrimination among almond cultivars has been the focal point of many research studies in order to avoid fraud in the food industry. Thus, it is interesting to check and evaluate the research works related to the chemical characterization and classification of almond cultivars.
2. Total Fat, Fatty Acids, and Triacylglycerides
The USDA National Nutrient Database highlighted the value of 49.9 g total lipid per 100 g raw almonds as a Standard Reference value [14], but the composition depends not only on cultivar but also on growing conditions and year of cultivation, among others. Related to this fact, in a study carried out in our research group, values of lipid content between 42.5–52.0%, 50.9–60.9%, 46.6–56.2%, and 47.9–56.2% were reported for the cultivars Garrigues, Marcona, Guara, and Butte, respectively. All of them were grown in different locations of Spain and California. Samples from two consecutive years were analyzed, confirming that the oil content is dependent on the origin and year of cultivation [9].
The fat fraction of almonds is mainly composed of fatty acids with 14 carbons up to 20 carbons quantified mainly by gas chromatography-flame ionization detector (GC-FID) [15]. In general terms, the amount of unsaturated fatty acids account for more than 90% of total lipids, being the main ones in decreasing order of mention: oleic (58.1–71.3%), linoleic (15.7–29.9%), palmitoleic (0.20–0.62%), and vaccenic acid (0.77–2.17%). In contrast, saturated fatty acids, such as palmitic (5.9–7.5%), stearic (1.0–2.4%), arachidic (0.07–0.10%), and myristic (0.02–0.05%) represented only 10% of total lipids [6]. Different research works in which almonds from different parts of the world were analyzed (i.e., almonds from Turkey [16], Spain [15], Italy [17], Serbia [18], China [19], and California [15], among others) reported oleic and linoleic as the major fatty acids.
In a recent study, it was revealed that the quality of the almond kernel depends on the maturity stage of the fruit, being noticeable the fat fraction changes related to the fatty acid composition [20]. Moreover, other studies have suggested that poor water supply to the crop leads to a lower oleic/linoleic ratio indicating a significant effect of irrigation on almond fatty acid composition [21]. In this sense, the irrigation management and the temperatures were the main factors affecting the oil content and fatty acid composition studied in seventeen different almond cultivars grown in two different environmental conditions, such as northeast Spain and central Morocco [22]. Regarding samples grown in Spain submitted to lower temperatures and better water contribution, the values of total oil content (58.65% vs. 55.58% (w/w)) and the percentage of oleic acid (71.1% vs. 68.6% (w/w)) were higher in comparison with the ones obtained in samples grown in central Morocco.
Considering the genetic diversity, the fatty acid composition has been strongly influenced by the genotype [22] [22] being the oleic and linoleic the most variable acids among genotypes [23]. Kodad et al. studied samples of forty-seven advanced self-compatible almond genotypes in terms of the analysis of oil content and fatty acid composition [8] [8]. The analyzed samples were grown in two different years and belonged to eight cultivars developed in an almond reproducing program. The obtained results confirmed that these parameters were highly variable, being strongly influenced by genotype.
Crucial aspects of food safety are the food authenticity studies focused on the identification of the geographical origin of food samples. In these studies, it is essential the development of new analytical methods and techniques able to confirm the chemical composition detailed on the food label [17]. Following this work line, a recent study reported a proper classification of almonds from different geographical origins (Sicily, Spain, and California) by the combination of chemometric techniques and the data related to fatty acid composition achieving an 87% of correctly classified samples. In this way, linear discriminant analysis (LDA) is the most predominant chemometric technique used with this purpose among the supervised pattern recognition methods [17]. Also, Colic et al. [18] [18] determined the total oil, fatty acids, total phenolic content, and the radical-scavenging activity in almonds belonging to North Serbia from cultivars Marcona, Texas, and Troito. Regarding the fatty acid composition, oleic and linoleic acids were the most abundant ones among the sixteen compounds that were identified. To find out the components able to differentiate among samples based on their genotype, principal component analysis (PCA) was performed, with principal component 1 being strongly influenced by oleic, pentadecanoic, and palmitoleic acids content.
Other researchers analyzed the fatty acid composition of different almond cultivars grown in Afghanistan and determined the levels of palmitic, palmitoleic, tridecanoic, stearic, oleic, linoleic, arachidic, linolenic, henicosanoic, behenic, tricosanoic, and lignoceric acids [24]. Taking into account all the determined fatty acids, significant differences (p < 0.05) between the almond cultivars were found and the study revealed that the LDA classification was mainly influenced by linolenic, henicosanoic, tridecanoic, tricosanoic, and lignoceric acids. In similar research work, commercial almond samples from different cultivars grown under the same environmental conditions (Cristomorto, D. Largueta, Ferraduel, Ferragnes, Ferrastar, Glorieta, Lauranne, Masbovera, Nonpareil, Picantili, Sonora, Supernova, Texas, Tuono, and Yaltinski) were analyzed by Yildirim et al. [7]. PCA analysis showed that principal component 1 was mainly contributed by palmitic, palmitoleic, stearic, oleic, and arachidic acid, unsaturated fatty acids (UFA), saturated fatty acids (SFA), and UFA: SFA ratio. In a similar study, Beltrán et al. [15] [15] achieved a classification of four almond cultivars (Butte from the USA, Marcona, Guara, and Garrigues from Spain) by using parameters related to the oil degradation. As it was expected, the main fatty acids found in the almond samples were oleic, linoleic, stearic, palmitic, and palmitoleic. The content in linoleic acid was higher in samples belonging to the Butte cultivar in comparison with the Spanish ones (Marcona, Guara, and Garrigues) and the application of the LDA technique provided a 100% correct classification of samples according to the cultivar.
Chemometric characterization of almond germplasm was conducted by Kodad et al. [25]. The oil content and the main fatty acids were determined in 73 almond cultivars from 10 different countries (Spain, Argentina, France, Italy, Greece, India, Syria, Portugal, Ukraine, and United States). The application of PCA indicated that the responsible variables for the separation were palmitic, oleic, and linoleic acids and the oleic acid/linoleic acid ratio indicating that fatty acid composition is strongly affected by the cultivar.
On the other hand, almond oil has been reported as the nut oil with the highest content in triacylglycerol′s (TAGs) (about 98%). However, the determination of the almond oil TAGs composition has not been the focus of many scientific studies. Among the few studies found, HPLC with refractive index detection was employed by Prats et al. [26] [26] to quantify the TAGs present in different almond cultivars such as Desmayo Largueta, Marcona, Guara, and Masbovera from Spain; Texas, Non Pareil, and Titan from the United States of America; Tuono from Italy; Ferragnes from France; and Primorskyi from a Caucasian region. The main triacylglycerol detected was OOO followed by OLO, POO, OLL, PLO, StOO, LLL, PLL, and PLP, where O refers to oleic acid, L to linoleic acid, P to palmitic acid, and St to Stearic acid, with OOO and OLO together representing more than 60% of the total triglyceride content. A correct classification was obtained based only on the almond TAGs determined except PLP and POO by using four discriminant functions with the calculated retain variables. The classification was based on almond genotypes which were not camouflaged by environmental conditions.
To look for dissimilarities among Protected Designation of Origin (PDO) Amêndoa Douro and commercial non-PDO cultivars, Barreira et al. [27] [27] characterized almonds during three harvesting years in Portugal in terms of fatty acid profile and TAGs. Accordingly, OOO and OLO were the major TAGs present in the studied samples as it was previously reported by Prats et al. [26]. To obtain statistical differences among PDO and non-PDO cultivars independent of the grown year, the PCA, LDA, and analysis of variance chemometric techniques were applied obtaining good results with the data of TAG analysis coupled with LDA.
From the fatty fraction, it seems that fatty acids and triacylglycerols could be used to classify almond cultivars if a good selection of variables is done when a multivariate analysis is applied. The variables that have had more differentiating power in the literature (Table 12) consulted are: palmitic, oleic, and linoleic acids and the oleic acid/linoleic acid ratio together with the following triglycerides OOO, OLO, POO, OLL, StOO, LLL, and PLL.
Table 12. Characterization of almonds of different geographical origins and cultivars based on their fatty acid composition.
| Geographical Origin Confirm the Color of Back Ground | Cultivars-Country of Origin | Compounds | Analysis |
|---|---|---|---|
| Turkey | Cristomorto, Largueta, Ferraduel, Ferragnes, Ferrastar, Glorieta, Lauranne, Masbovera, Nonpareil, Picantili, Sonora, Supernova, Texas, Tuono, and Yaltinski | Palmitic, Palmitoleic, Heptadecanoic, Stearic, Oleic, Linoleic, Arachidic | GC-FID PCA |
| Sicily, Spain, California | Not specified | Oleic, Linoleic, Palmitic, Stearic, Myristic, Arachidonic, Arachidic | GC-MS PCA |
| Serbia | Marcona-Spain, Texas- USA, Troito-Italy and 17 selections from the large spontaneous population of almonds in North Serbia, called Slankamen Hill | Oleic, Linoleic, Palmitic, Stearic, Myristic, Arachidic, Palmitoleic, Heptadecanoic, Cis-10-heptadecenoic, Linolenic, Eicosenoic, Tricosanoic, Behenic, Pentadecanoic, Docosadienoic, Lignoceric | GC-FID PCA |
| Afghanistan | Khairodini samangani, Pista Badam, Kaghazai Siah Dana, Qaharbai, Sangak Shashum, Shokorbai, Carmel, Kaf Samangani, Khairodini, Kaghazai Kalan, Sattarbai, Belabai, Marawaja Du Maghza, Sattarbai Doum, Shakh-i- Buz Safid, Sangak Dahum, Qambari Kunduzi, Sattarbai Bakhmali, Khairodini-161 Samangan, Sattarbai Saiz Talkhak | Palmitic, Tridecanoic, Palmitoleic, Stearic, Oleic, Linoleic, Arachidic, Linolenic, Henicosanoic, Behenic, Tricosanoic, Lignoceric | GC-FID PCA |
| Argentina, France, Greece, India, Italy, Portugal, Spain, Syria, Ukraine, USA | Emilito-Argentina; Marcona Argentina-Argentina, Ai-France, Ardechoise-France, Bartre-France, Belle d’Aurons-France, Cristar-France, Ferragnes-France, Ferralise-France, Fourcouronne-France, Fournat de Brezenaud-France, Pointu d’Aureille-France, Princesse-France, Stelliette-France, Tardive de la Verdiere-France, Tournefort-France, Exinograd-Greece, Phyllis-Greece, Pagrati-Greece, Symmetriki-Greece, Truoito-Greece, Tsotoliou-Greece, Kata-India, Spilo-India, Talengy-India, Bonifacio-Italy, Cavaliera-Italy, Cristomorto-Italy, Filippo Ceo-Italy, Fiori-Italy, Fragiulio-Italy, Mollese-Italy, Olla-Italy, Prouvista-Italy, Rachele-Italy, Rana-Italy, Supernova-Italy, Tuono-Italy, Carreirinha-Portugal, Cosa Nova-Portugal, Gama-Portugal, Rameira-Portugal, Raposa-Portugal, Verdeal-Portugal, Atocha-Spain, Del Cid-Spain, Desmayo Largueta-Spain, Desmayo Rojo-Spain, Garbí-Spain, Garrigues-Spain, Mollar Arbeca-Spain, Marcona-Spain, Mollar-Spain, Ramillete-Spain, Verdereta-Spain, Siria-1-Syria, Siria-3-Syria, Nikitskij-Ukraine, Primorskij-Ukraine, Sovietskij-Ukraine, Drake-USA, IXL-USA, LeGrand-USA, Mono-USA, Nec Plus Ultra-USA, Nonpareil-USA, Peerless-USA, Tardy Nonpareil-USA, Texas-USA, Thompsom-USA, Tioga-USA, Tokyo-USA, Yosemite-USA | Palmitic, Palmitoleic, Stearic, Oleic, Linoleic | GC-FID PCA |
| Portugal | Protected Designation of Origin: Casa Nova, Duro Italiano, Pegarinhos, Refego. Non PDO: Ferraduel, Ferragnes, Ferrastar, Gloriette and Marcona | Palmitic, Palmitoleic, Cis-10-heptadecenoic, Stearic, Oleic, Linoleic, Arachidic | GC-FID PCA |
| Spain and California | Marcona-Spain, Guara-Spain Garrigues-Spain and Butte-California | Palmitic, Palmitoleic, Stearic, Oleic, Linoleic | GC-FID PCA |
| Morocco; Spain, France and Tunisia | Marcona-Spain, Desmayo Largueta-Spain, Ferragnès-France, Fournat de Brézenaud-France, Ferraduel-France, Khoukhi’-Tunisia and 46 local genotypes from the Rif mountains (north of Morocco), the Atlas mountains and the valley of Tadla (central-south Morocco) |
Palmitic, Palmitoleic, Stearic, Oleic, Linoleic | GC-FID PCA |
GC-FID: gas chromatography-flame ionization detector; PCA: principal component analysis; GC-MS: gas chromatography-mass spectrometry.
3. Proteins
The levels of protein in almonds can vary from 10% to 35% [4]. Usually, protein concentration is determined from the nitrogen levels using a nitrogen-to-protein conversion factor. In this sense, it is interesting to note that 6.25 or 5.18 values for this factor are reported, which can lead to differences in the stated protein content of almonds. As it has been reported, protein content in almond kernels steadily increases up to harvest, since the seed has a greater protein synthesis activity [30] [30] and, additionally, its water content is reduced. Among the studies found, Barreira et al. evaluated the protein content of nine almond cultivars collected through three consecutive years in Portugal [31]. In this work, the authors used a nitrogen-to-protein conversion factor of 5.18 but non statistically significant differences in the protein levels were found. The same factor was used in another study [32] [32] and the authors found that the proteins were one of the major components that had more variability related to the year of cultivation. In contrast, Drogoudi et al. [33], using the same protein conversion factor, showed that proteins have the highest variability between genotypes and the lowest between years, so it could be a good marker to differentiate varieties. Previously, this conclusion had been stated in the work of Calixto et al. [34] [34] which determined the protein content of five different almond cultivars collected during the same year using a conversion factor of 6.25.
In the paper of Rabadán et al. [32], the protein concentration was the nutritional component with the highest reported variability among kernels, with the crop year being responsible for most of this variability. However, Yada et al. [35] [35] found that, although the protein concentration was significantly different for two of the five cultivars studied, the crop year and growing region had not impact on the three genotypes followed. In this line, Kodad et al. [36] [36] selected 41 almond genotypes from four different regions of Morocco during two consecutive years and evaluated the protein content of the kernel using the Dumas method with a conversion factor of 6.25. The ANOVA of the protein levels showed that the effect of genotype was significant as were the year and regions, and the interaction of year and genotype. The PCA carried out showed that kernel's oil-to-protein ratio could be used to differentiate genotypes. Finally, other works have also found differences in the protein content among several cultivars, although no classification was attempted [37]. From these results, it appears that the protein content of almond cultivars could hardly, on its own, be a candidate marker for cultivar classification as the influence of the growing conditions and year of cultivation are determinant.
4. Amino Acids
Amino acids accumulate in the almond kernel until the protein synthesis activity begins, afterwards, the levels of amino acids stabilize leading to a final residual (i.e., <200 mg/100 g) free amino acid content in the ripe kernel [30]. Font i Forcada et al. [38] [38] reported that the heritability estimate of protein content in almond was very low, confirming the strong effect of environmental conditions on its expression. This was evidenced by the differences in this parameter found when different irrigation systems with inorganic/organic fertilization schemes were used [39]. Some works showed the complete amino acid profile of different almond cultivars [40][41][40,41]. However, the studies were not focused on comparison for classification purposes.
Furthermore, some articles of our research group showed data of the free amino acid profile of almond kernels, using this information for cultivar classification purposes [42][43][44][42,43,44]. Seron et al. [44] studied the free amino acid composition of nineteen cultivars from different countries, Spain, USA, Australia, Italy, and Tunisia, belonging to the same crop year. Leucine, Valine, and Alanine were the amino acids with a higher cultivar discrimination power although all amino acids contributed to differentiate cultivars. By applying PCA and discriminant analysis, the Spanish cultivars could be classified as a single class different from the rest. In the work of Grané et al. [42], the free amino acid profile of five almond cultivars grown in different regions of Spain was used as a classification tool. Two groups were found with Serine and Asparagine levels being the more effective data for differentiating cultivars. Finally, in a study using ten different cultivars grown in different parts of Spain, the authors suggested that the cultivar variable had a stronger influence on the free amino acid profile than the variables such as the region of growing and weather conditions [43]. Hence, Asparagine and Glutamic acid levels were used to distinguish Marcona and Texas cultivars from the other eight cultivars using LDA.