Research in instability has focused on the analysis of muscle activation. This systematic entry was to analyze the effects of unstable devices on speed, strength and muscle power measurements administered in the form of controlled trials to healthy individuals in adulthood.
- Instability
- resistance training
- exercise ball
- suspension training
- performance
- unstable devices
1. Systematic Review Protocol
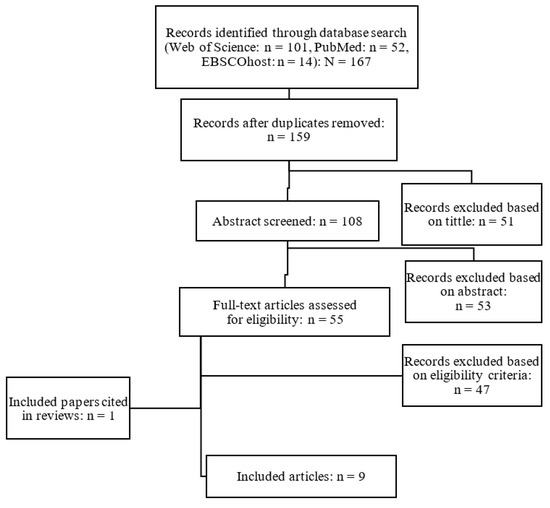
The authors worked separately and independently to ensure the reliability of the process and the suitable eligibility of the studies. According to the criteria for preparing systematic reviews “Preferred Reporting Items for Systematic Reviews and Meta-Analysis”—PRISMA [1], the protocol carried out in the months of July, August and September 2020 and it was made up of four stages (
n
n
n
n
n = 8) based on the relationship between the execution of the exercises in a stable condition and their execution in an unstable condition were finally considered. An additional article was identified from the reference lists of included papers and review articles already published[2][3][4][5].

Figure 1.
2. Qualitative and Qualitative Analysis
2.1. Synthesis of Findings (Qualitative Analysis)
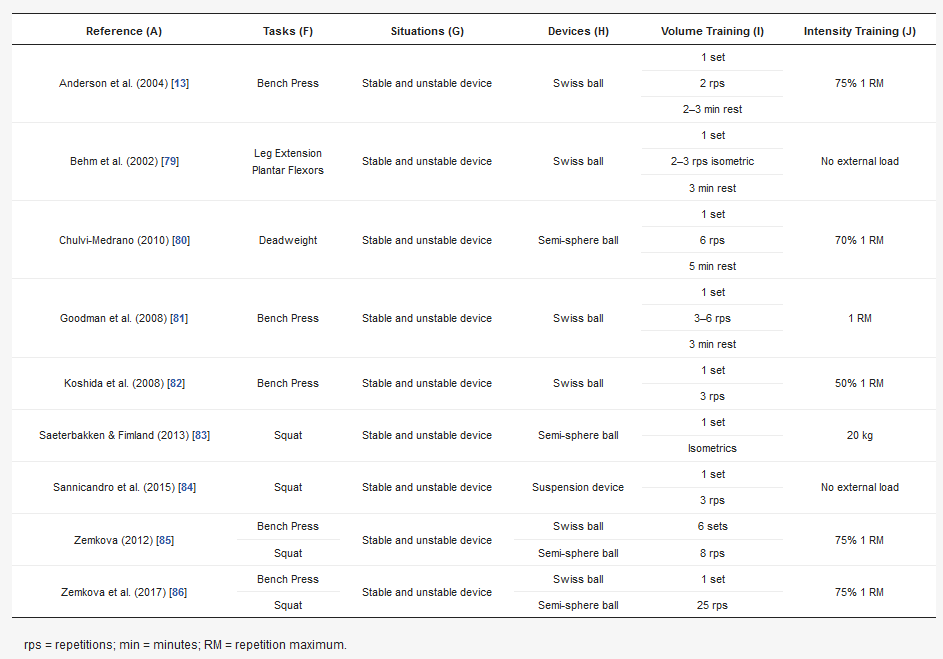
Table 1.
| Reference (A) | Sample | ||
|---|---|---|---|
Table 3.
| Reference (A) | Performance Measures | ||
|---|---|---|---|
| Strength Results in Newtons (K) | Power Results in Watios (L) | Speed Results in cm/s (M) | |
| Anderson et al. (2004) [6] | INS (S) = ↓59.4% MIVC | ||
| Behm et al. (2002) [7] | INS (LE-S) = ↓75.4% MVC | ||
| INS (PF-S) = ↓20.2% MVC | |||
| Chulvi-Medrano (2010)[8] | INS (B) = ↓10.2% MIVC | ||
| Goodman et al. (2008) [9] | INS (S) = No Differences MáxS | ||
| Koshida et al. (2008) [10] | INS (S) = ↓5.9% MS | INS (S) = ↓9.9% MP | INS (S) = ↓9.1% MV |
| Saeterbakken & Fimland (2013) [11] | INS (B) = −19% MS | ||
| Sannicandro et al. (2015)[12] | INS (EF-LF-T) = ↓13.8 MS | ||
| INS (EF-LF-T) = ↓46.8 MáxS | |||
| INS (CF-LF-T) = ↓12.8 MS | |||
| INS (CF-LF-T) = ↓12.6 MáxS | |||
| INS (EF-RF-T) = ↓11.7 MS | |||
| INS (EF-RF-T) = ↓42.9 MáxS | |||
| INS (CF-RF-T) = ↓13.2 MS | |||
| INS (CF-RF-T) = ↓11.9 MáxS | |||
| Zemkova (2012)[13] | INS (BP-S) = ↓10.3% MP | ||
| INS (BP-S) = ↓7.3% Pmáx | |||
| INS (BP-S) = ↓11.5% CF | |||
| INS (SQ-B) = ↓15.7% MP | |||
| INS (SQ-B) = ↓17% Pmáx | |||
| INS (SQ-B) = ↓15.1% CF | |||
| Zemkova et al. (2017)[14] | INS (BP-S) = ↓12.9% MP (1–3 rps) | ||
| INS (BP-S) = ↑5.6% MP (22–25 rps) | |||
| INS (BP-S) = ↓6.9% MP (25 rps) | |||
| INS (BP-S) = ↓13.8% CF (1–3 rps) | |||
| INS (BP-S) = ↑13.2% CF (22–25 rps) | |||
| INS (BP-S) = ↓4.6% CF (25 rps) | |||
| INS (SQ-B) = ↓17.1% MP (1–3 rps) | |||
| INS (SQ-B) = ↓21.4% MP (22–25 rps) | |||
| INS (SQ-B) = ↓19.3% MP (25 rps) | |||
| INS (SQ-B) = ↓16.2% CF (1–3 rps) | |||
| INS (SQ-B) = ↓20.6% CF (22–25 rps) | |||
| INS (SQ-B) = ↓18% CF (25 rps) | |||
| Reference (A) |
|---|
| Variables (E) |
|---|
| Sample | Variables (E) | Experience (B) | Size and Sex (C) | Characteristics (D) | |||
|---|---|---|---|---|---|---|---|
| Experience (B) | Size and Sex (C) | Characteristics (D) |
|---|
| Anderson et al. (2004)[6] | Trained in strength, Instability 1 year earlier | 10 (M) | a: 26.2 ± 6.0 years | Strength |
| h: 177.3 ± 6.0 cm | ||||
| w: 87.3 ± 12.2 kg | ||||
| Behm et al. (2002)[7] | Trained | 8 (M) | a: 24.3 ± 6.7 years | Strength |
| h:178.1 ± 6.1 cm | ||||
| w: 82.3 ± 8.9 kg | ||||
| Chulvi-Medrano (2010)[ |
| Anderson et al. (2004)[6] | Trained in strength, Instability 1 year earlier |
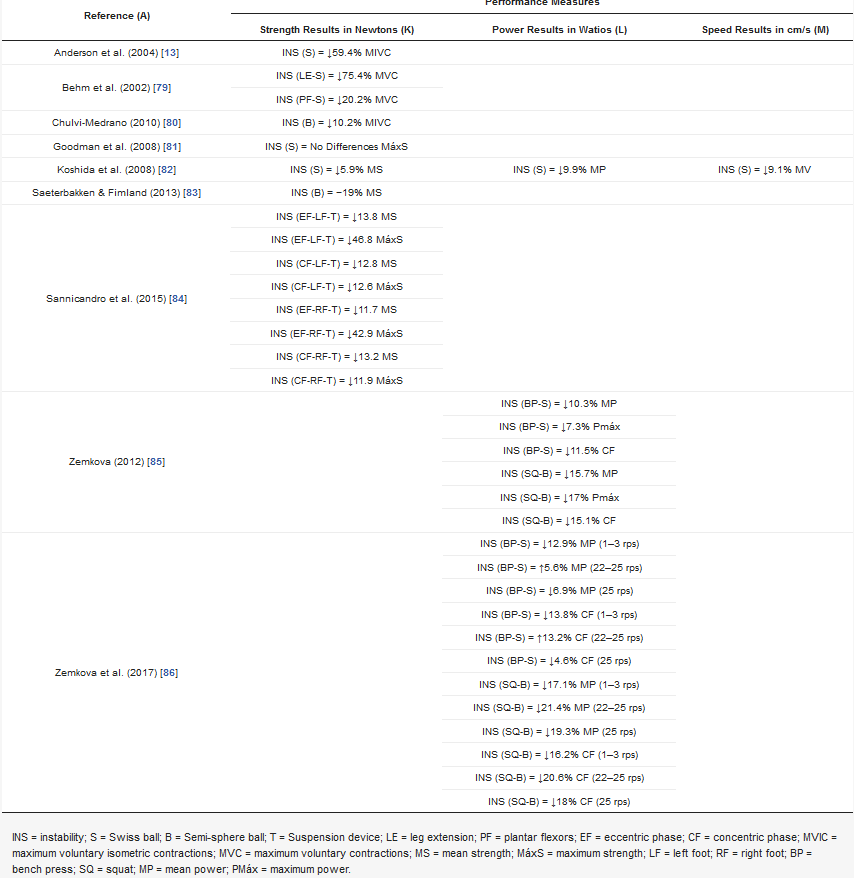
INS = instability; S = Swiss ball; B = Semi-sphere ball; T = Suspension device; LE = leg extension; PF = plantar flexors; EF = eccentric phase; CF = concentric phase; MVIC = maximum voluntary isometric contractions; MVC = maximum voluntary contractions; MS = mean strength; MáxS = maximum strength; LF = left foot; RF = right foot; BP = bench press; SQ = squat; MP = mean power; PMáx = maximum power.

2.2. Sample Characteristics
n
n
n
n
n
n
n
2.3. Tasks, Devices, and Training Parameters
n
n
n
n
n
2.4. Strength Results
Concerning the strength parameter with a Swiss ball, the bench press exercise showed 59.4% less isometric strength in instability [6], 5.9%[10], but no differences were found in 1RM [9]. For the lower limb exercises, 70.5% less was evidenced in the unstable condition in leg extension exercises than in the stable condition while the unstable force in plantar flexors was 20.2% less than the stable condition[7]. Also with the same exercise, a decrease with the execution with the semi-sphere ball concerning the stable condition of 19% was evidenced [11]. In the case of the deadweight exercise, the decrease in the maximum isometric contraction between the stable condition and the execution with semi-sphere ball was 10.2%[8]. Regarding suspension training squat exercise with bipodal execution, in the eccentric phase, peak and average force showed a decrease of 46.8% and 13.8% respectively for the lower left limb. In the concentric phase, the use of the suspension training tool caused a decrease of 12.6% in peak force and 12.8% in mean force. For the right lower limb, in the eccentric phase, during execution with the suspension training tool, the force decreased by 42.9% and the mean force by 11.7%. In the concentric phase, during execution with the suspension training tool, the peak and average force decreased respectively by 11.9% and 13.2%. During monopodal execution, the eccentric phase in the left limb, the peak force suffered a decrease of 41.8% and the average force a decrease of 18.1%. In the concentric phase, on the other hand, the use of the suspension training tool caused a decrease of 13.5% in peak force and 15.8% in average force. For the right limb during monopodal execution, in the eccentric phase, the force has decreased by 45.1% and the average force by 17.4%. In the concentric phase, the use of the suspension training tool caused a decrease of 12.4% in the force and 14.3% in the mean force [12].
2.5. Power Results
82], and of 10.3% in the average power, 7.3% in the maximum power and 11.5% in the power exercised in the concentric phase[13]. For the average power, with the execution of 25 repetitions, a decrease of 6.9% was found in the unstable bench press, although in the last three repetitions the average power exercised in the unstable condition was 5.6% higher than the stable condition. On the contrary, among the first three repetitions, the unstable data was 12.9% lower than the stable condition. The power exercised in the concentric phase of the bench press was reported to be 4.6% lower in the unstable bench press, although in the last three repetitions the power exercised in the concentric phase of the unstable condition was 13.2% higher than the stable condition. On the contrary, among the first three repetitions, the unstable data was 13.8% lower than the stable condition[14]. To average power, 25 repetitions showed a decrease of 19.3% in the unstable squat, although in the last three repetitions the average power exercised in the unstable condition was 21.4% higher than the stable condition. On the contrary, among the first three repetitions, the unstable condition was 17.1% lower than the stable condition. The power exercised in the concentric phase of the squat was reported to be 18% lower in the unstable squat, although in the last three repetitions the power exercised in the concentric phase of the unstable condition was 20.6% lower than the stable condition. On the contrary, among the first 3 repetitions, the unstable condition was 16.2% lower than the stable condition [14].
2.6. Speed Results
2.7. Study Selection and Assessment (Qualitative Analysis)
Table 4.
| Reference | Title and Abstract | Introduction | Methods | Results | Other Analysis | Discussion | Other Information | Strobe Points | Study Quality | |||||||||||||||
|---|---|---|---|---|---|---|---|---|---|---|---|---|---|---|---|---|---|---|---|---|---|---|---|---|
| 1 | 2 | 3 | 4 | 5 | 6 | 7 | 8 | 9 | 10 | 11 | 12 | 13 | 14 | 15 | 16 | 17 | 18 | 19 | 20 | 21 | 22 | |||
| Anderson et al. (2004) [13] | ||||||||||||||||||||||||
| 10 (M) | a: 26.2 ± 6.0 years | Strength | ||||||||||||||||||||||
| + | + | + | - | - | + | + | + | - | - | + | + | - | - | + | + | - | + | - | + | + | - | 13 | FAIR | |
| h: 177.3 ± 6.0 cm | ||||||||||||||||||||||||
| Behm et al. (2002) [79] | + | + | + | - | - | + | + | + | - | - | + | + | - | - | + | + | + | + | - | + | + | - | 14 | FAIR |
| Chulvi-Medrano (2010) [80] | + | + | + | + | + | + | + | + | - | - | + | + | - | - | + | + | - | + | + | + | + | - | 16 | GOOD |
| Goodman et al. (2008) [81] | + | + | + | + | + | + | + | + | - | - | + | + | - | - | + | + | + | + | - | + | + | - | 16 | GOOD |
| Koshida et al. (2008) [82] | + | + | + | + | + | + | + | - | 15 | GOOD | ||||||||||||||
| Saeterbakken & Fimland (2013) [83] | + | + | + | + | - | + | + | + | - | |||||||||||||||
| 8] | Trained in strength Experience with instability | 31 (M) | a: 24.29 ± 0.48 years | Strength | ||||||||||||||||||||
| h: 167.98 ± 8,11 cm | ||||||||||||||||||||||||
| w: 79.08 ± 2,37 kg | ||||||||||||||||||||||||
| - | + | + | - | |||||||||||||||||||||
| Goodman et al. (2008)[9] | Recreational | 13 (10 M, 3 W) | a: 24.1 ± 1.6 years | Strength | ||||||||||||||||||||
| h: 176.7 ± 3.0 cm | ||||||||||||||||||||||||
| w: 76.0 ± 3.9 kg | ||||||||||||||||||||||||
| Koshida et al. (2008)[10] | Trained | 20 (M) | a: 21.3 ± 1.5 years | Strength | ||||||||||||||||||||
| h: 167.7 ± 7.7 cm | ||||||||||||||||||||||||
| w: 87.3 ± 12.2 kg | ||||||||||||||||||||||||
| Behm et al. (2002)[4] | Trained | 8 (M) | a: 24.3 ± 6.7 years | Strength | ||||||||||||||||||||
| h:178.1 ± 6.1 cm | ||||||||||||||||||||||||
| w: 82.3 ± 8.9 kg | ||||||||||||||||||||||||
| + | - | + | + | + | - | - | + | + | - | - | + | - | + | + | - | + | - | |||||||
| Chulvi-Medrano (2010)[8] | Trained in strength Experience with instability | 31 (M) | a: 24.29 ± 0.48 years | Strength | ||||||||||||||||||||
| + | ||||||||||||||||||||||||
| h: 167.98 ± 8,11 cm | ||||||||||||||||||||||||
| + | + | - | 13 | FAIR | ||||||||||||||||||||
| Sannicandro et al. (2015) [84] | + | + | + | - | - | + | + | + | - | - | + | + | - | - | + | + | + | + | - | + | + | + | 15 | GOOD |
| Zemkova (2012) [85] | + | + | + | - | - | + | + | + | - | - | + | + | - | - | + | + | - | + | + | + | + | + | 14 | FAIR |
| w: 79.08 ± 2,37 kg | ||||||||||||||||||||||||
| Zemkova et al. (2017) [86] | + | + | + | - | - | + | + | + | - | - | + | + | - | - | + | + | - | + | - | + | + | - | 13 | |
| Goodman et al. (2008)[9] | Recreational | 13 (10 M, 3 W) | a: 24.1 ± 1.6 years | Strength | ||||||||||||||||||||
| h: 176.7 ± 3.0 cm | ||||||||||||||||||||||||
| w: 76.0 ± 3.9 kg | ||||||||||||||||||||||||
| Koshida et al. (2008)[10] | Trained | 20 (M) | a: 21.3 ± 1.5 years | Power | ||||||||||||||||||||
| Strength | ||||||||||||||||||||||||
| h: 167.7 ± 7.7 cm | Power | w: 75.9 ± 17.5 kg | Speed | |||||||||||||||||||||
| FAIR | ||||||||||||||||||||||||
| w: 75.9 ± 17.5 kg | Speed | Saeterbakken & Fimland (2013)[11] | Trained | 15 (M) | a: 23.3 ± 2.7 | |||||||||||||||||||
| Saeterbakken & Fimland (2013) | Strength | |||||||||||||||||||||||
| [11] | h: 181 ± 0.09 cm | |||||||||||||||||||||||
| w: 80.5 ± 8.5 kg | ||||||||||||||||||||||||
| Trained | 15 (M) | a: 23.3 ± 2.7 | Strength | Sannicandro et al. (2015)[12] | No previous experience in strength or instability is indicated | 24 (M) | a: 17.8 ± 0.8 years | |||||||||||||||||
| h: 181 ± 0.09 cm | Strength | |||||||||||||||||||||||
| w: 80.5 ± 8.5 kg | Power | |||||||||||||||||||||||
| Sannicandro et al. (2015)[12] | No previous experience in strength or instability is indicated | 24 (M) | a: 17.8 ± 0.8 years | Strength Power |
h: 179.1 ± 5.6 cm | |||||||||||||||||||
| w: 73 ± 4.9 kg | ||||||||||||||||||||||||
| Zemkova (2012) | ||||||||||||||||||||||||
| h: 179.1 ± 5.6 cm | [ | |||||||||||||||||||||||
| w: 73 ± 4.9 kg | 13] | |||||||||||||||||||||||
| Zemkova (2012) | Trained in strength, no experience in instability | [13] | 16 (M) | a: 23.4 ± 1.9 years | Power | |||||||||||||||||||
| Trained in strength, no experience in instability | 16 (M) | a: 23.4 ± 1.9 years | Power | h: 181.5 ± 6.1cm | ||||||||||||||||||||
| - | ||||||||||||||||||||||||
| h: 181.5 ± 6.1cm | w: 75.1 ± 6.1 kg | |||||||||||||||||||||||
| w: 75.1 ± 6.1 kg | Zemkova et al. (2017)[14] | Trained in strength, no experience in instability | 24 (M) | a: 22.1 ± 1.8 years | Power | |||||||||||||||||||
| Zemkova et al. (2017)[14] | Trained in strength, no experience in instability | 24 (M) | a: 22.1 ± 1.8 years | h: 184.5 ± 8.3 cm | ||||||||||||||||||||
| w: 79.8 ± 9.4 kg | ||||||||||||||||||||||||

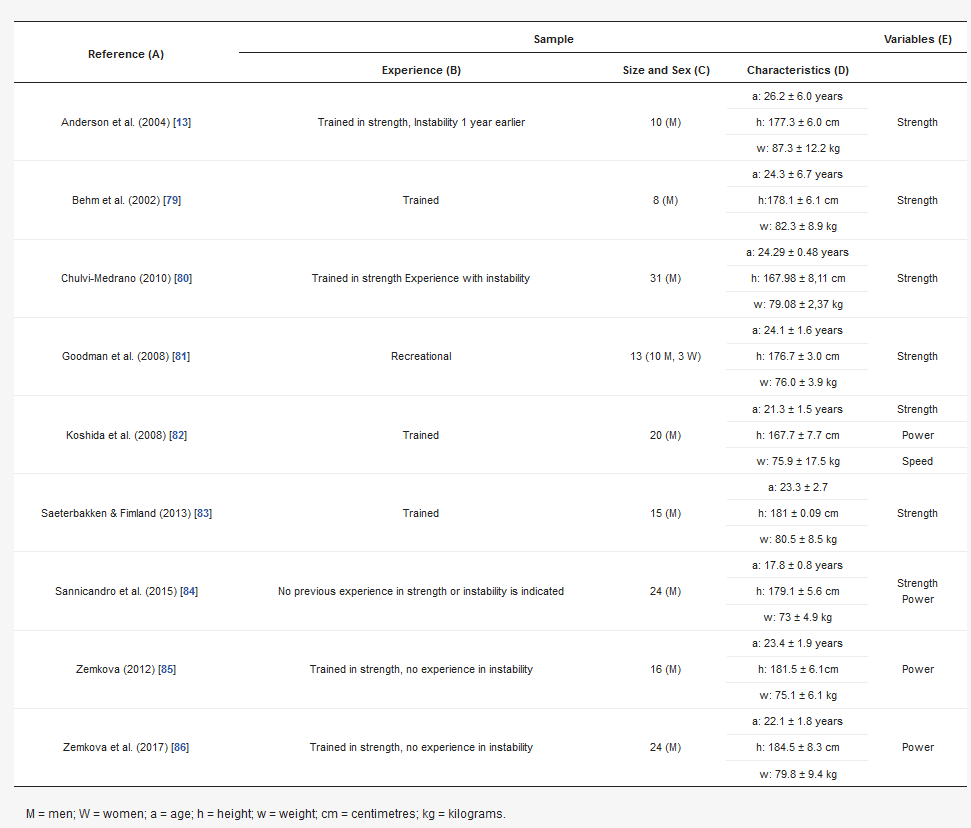
Table 2.
| Power |
| h: 184.5 ± 8.3 cm |
| w: 79.8 ± 9.4 kg |


3. Discussion
About the production of force, for the exercises of the upper limb, high decreases in values have been observed for the unstable condition. These differences have ranged from 20 to 75% loss in force development in unstable conditions. According to Kornecki, Kebel, and Siemieński[15], the stabilising function of the skeletal muscles is necessary for the coordinated performance of any voluntary movement, and it significantly influences muscle coordination patterns. Therefore, significant reductions in muscle production probably occurred because the muscles around the shoulder complex needed to give priority to stability over force production. Furthermore, under conditions of instability, the stiffness of the joints that act can limit gains in strength, power and speed of movement[16].
However, in the data evidenced in the study by Koshida et al. [10], the losses in force values are much lower than in the rest of the studies (5.9% loss in instability) compared with 59.4% loss in Anderson and Behm [6] and in the case of Goodman et al. [9], no significant differences are observed. This inconsistency between the previous research can be attributed to the type of muscle contraction, the degree of instability during the recorded task and the equipment. In Koshida et al. [10] the bench press movement was performed in a supine position with the Swiss ball placed in the thoracic area, which provided a broader support base than for other activities performed in a sitting or standing position. Therefore, the instability imposed on the trunk stabilising muscles would probably be less significant than in previous research. Besides, both studies used dynamic contractions with an Olympic bar with weight plates, while Anderson and Behm [6] used isometric contractions with two independent handles held by straps to force the transducers into the ground. The difference in equipment could impose different levels of instability on the shoulder joint and trunk muscles. Although bilateral contractions were performed in both studies, the independence of each hand in the study by Anderson and Behm[6] may have increased the effort required to maintain balance and the need for the muscles to stabilize during maximum isometric contractions, therefore reducing the net force output. In the case of Goodman et al. [9], where no differences were found, it could be due to the use of different loads, since 1RM was used while in Anderson and Behm[6] 75% of 1RM loads were used and in Goodman et al. [
In the case of force production in the lower limbs, there have been notable decreases when comparing tasks performed in instability concerning stable conditions. These decreases ranged from 10% to 19%, so it seems that instability affects the upper body more than the lower. With the use of the semi-sphere ball, analysed in terms of strength, with the performance of a dominant hip exercise such as deadweight the decrease in strength was 10.2%[8] while with a dominant knee exercise such as squat it was 19% [11]. This could indicate that certain movements could be affected to a lesser extent depending on the instability. However, as detailed above the methods and loads used were very different. It is noteworthy that many of the studies to check force production in the lower limb using isometric contractions. However, isometric contractions are not usually used in strength training. Despite this, results obtained under isometric contractions have reported that conditions are strongly correlated with dynamic mobility performance[17]. However, due to the isometric test mode, subjects could gradually build up strength while stabilizing and maintaining balance on different surfaces. During the 3 s of maximum effort, the subjects may have been able to stabilize the limbs and trunk and therefore be able to exert a considerable amount of force in unstable conditions. We only know of one study that investigates the production of maximum force in squats on a stable and unstable surface[18]. These researchers used an inflatable balance disk and reported a decrease of approximately 46% in peak force. Although there was a greater decrease in force in that study, it could be attributed to the lack of a familiarization session, which the rest of the studies did consider appropriate.
Concerning the production of muscular power in the upper limb, decreases in the unstable condition have been observed. Decreases with the unstable condition ranged from 7% to 17%. The data found in the studies that analyzed the bench press with Swiss ball reported a very similar percentage decrease in terms of average power (10.3% [13]; 9.9% [10]; and 12.9% [14]). These small deviations found may again be due to the different percentage of load used (50% vs. 75%) and the different volume of training applied. However, in some situations, instability has produced better power data than a stable condition. These better data have been produced in the last repetitions of the executions with high numbers of repetitions in the exercise (22–25 repetitions). The improvements observed in average power were 5.6% and in the concentric phase 13.2%.
The increase in power observed could be due to previous evidence that has shown that producing a high power output with a light to moderate load would be more effective in developing maximum power than using a heavy load [19][20]. Thus, it appears that such a low rate of reduction may still allow muscle power to be gained from strength exercise in the unstable condition. The mechanism of energy production using the stretch-shortening cycle employs the energy storage capacity of several elastic components and the stimulation of the stretching reflex to facilitate muscle contraction for a minimum period. The concentric muscle action does not occur immediately after the eccentric, the stored energy is dissipated and lost in the form of heat and also the strengthening stretching reflex is not activated. Resistance to instability exercise can compromise the three phases of the stretching-shortening cycle, including the amortization phase. Around this turning point, where the eccentric phase becomes concentric, the maximum force is produced. At the same time, the subjects must stabilize the torso on an unstable surface to provide firm support for the contracted muscles. This additional task can compromise the contraction of the muscles acting on the bar. Their less intense contraction not only prolongs the change of direction of movement but, due to the lower maximum force, impairs the accumulation of elastic energy. The consequence is less speed and power in the subsequent concentric phase[21][22]. However, the subjects of the study by Zemkova et al. [14] were able to produce greater power during the executions on an unstable surface than on a stable one. This higher energy production can be attributed to the so-called ball bounce effect.
Finally, about the speed of execution, a decrease in the values in unstable conditions in comparison to stable conditions is observed, but the analysis of this variable has hardly been studied. According to Adkin et al. [23], a postural threat in a subject (fear of falling) will lead to a reduction in the magnitude and speed of voluntary movements. Thus, muscle stabilization seems to compromise gains in strength, power and speed of movement[24]. It should also be noted that new patterns of movement are generally learned at low speed, while sport-specific motor actions are executed at high speed[25].
