Atrial Fibrillation (AF) is a heart rhythm disorder. Hence, AF diagnosis is based on measurements which reflect the activity of the heart. Detectable symptoms of the disease might not be present all the time. Therefore, the measurement duration is positively correlated with the AF detection rate. Suitable measurements include photoplethysmogram, electrocardiogram, and heart rate. The data volume, produced through long term measurement, mandates computer support to automate the AF detection task. This article introduces the measurement methods and it reviews the scientific work on automated AF detection.
- Atrial Fibrillation
- Computer Aided Diagnosis
- Electrocardiogram
- RR interval
- Photoplethysmogram
- Physiological signals
1. Introduction
In this entry, we discuss the different measurements that can be used to support AF diagnosis. From a service perspective, patient-led data acquisition is an important requirement. Imaging methods, such as echocardiogram[1][2][3][4] [55,56,57,58] and chest X-ray[5][6] [59,60], are unsuitable for measurements in the patient environment. Blood test biomarkers can be useful for risk prediction[7] [61]. However, it is not yet feasible to carry out either measurement or analysis in the home environment.
ECG and RR interval signals result from passive non-invasive measurements. These measurements can be carried out in the patient environment. ECG results from measurement of the electric field emitted by heart[8] [62]. The resulting signals provide a good base for automated AF detection[9][10][11] [63,64,65]. This is because AF symptoms, such as poorly coordinated atrial activation and turbulent cardiac beating[12] [66], alter the signal morphology[13][14][15] [67,68,69]. RR interval signals can be extracted from the ECG, and these signals are useful for detecting heart rhythm disorders, such as AF[16] [70]. The following sections provide further details concerning both ECG- and RR interval-based AF detection. Wearable Photoplethysmogram (PPG) might provide an alternative for measuring the RR intervals[17] [71].
2. Photoplethysmogram
PPG is an optical measurement that detects variations in light reflected from human tissue[18] [72]. The main feature of the resulting signal is the peripheral pulse, which is synchronized with the R peaks in the ECG. Once the PPG signal is captured, the beat-to-beat interval is measured and saved as an RR interval signal[19] [73]. Hence, the AF detection methods are similar to those that process RR intervals extracted from ECG. The measurement can be done with mobile devices, such as wrist watches[20] [74]. As such, the PPG measurement becomes an add-on feature for a mobile device, which keeps the cost down. Widespread availability, combined with little extra cost for the sensor, might lead to a significant increase in data volume. Given the right detection algorithms, that data can help to establish the presence of AF in the wider population.
For user comfort, these devices can move around, which is likely to cause activity specific artifacts in the measurements[21] [75]. These artifacts mandate preprocessing algorithms that clean up the signal for the AF detector. In 2017, Sološenko et al. addressed the lack of annotated public PPG databases by generating a photoplethysmogram model from the well-known MIT–BIHAF database[22] [76]. This model attempts to reflect the cardiovascular system; hence, there might be variation in how well that model fits for a particular patient. That uncertainty also affects the AF detection methods that were developed with the photoplethysmogram model. Furthermore, detectors with a high computational complexity might exploit some of the hidden assumptions that went into the photoplethysmogram model design. In a practical scenario, these assumptions might not hold, which reduces the detector performance. Another approach is to record PPG alongside ECG and transfer the labels, established by a cardiologist, from ECG to PPG[17][23] [71,77]. Such double recording is necessary, because PPG signals cannot be used for diagnosis. In other words, cardiologists diagnose AF based on ECG signals. Until that changes, PPG-based AF detection can only be used in gadgets that can raise the suspicion that AF symptoms are present. The medical diagnosis will require additional measurements.
3. Electrocardiogram
Twelve-lead ECG is the reference standard for AF detection[24] [78]. In order to establish a diagnosis, the signal is analyzed by a trained clinician[25] [34]. Figure 1 shows two ECG signal segments from PhysioNet’s AF database[26][27] [79,80]. A normal ECG cycle is referred to as Normal Sinus Rhythm (NSR). It consists of a P wave, QRScomplex, and T wave. The first plot in FigureFigure 1 1 provides an example of NSR. In that plot, the first P wave is marked and labeled. Pathologically, AF can be described as a breakdown of organized atrial electrical activity[28] [30]. This breakdown manifests itself in the absence of a P wave in the ECG signal and the R peak appearing at irregular intervals[29] [81]. The second plot in Row 1 of Figure 1 provides an example of an ECG signal that shows signs of AF. The R peaks appear at irregular time intervals, and the P wave is muted or absent. TableTable 1 1 provides a summary of studies that investigated computer support for automated AF detection in ECG signals.
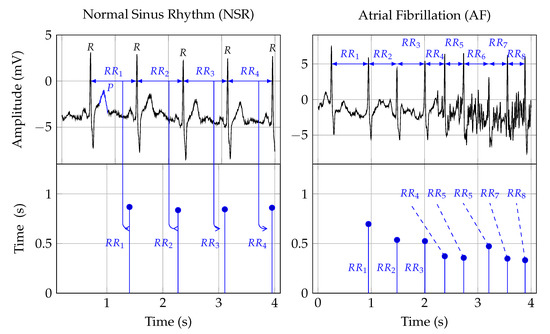
Figure 1. The first row depicts two ECG signals and the second row the corresponding RR interval traces. The two plots in the first column show NSR, and the plots in the second row show AF symptoms. The Rpeak, in the ECG plots, indicates ventricular depolarization, i.e., the time of the heart beat. The time between two heart beats, say a and b, is indicated as the RRinterval. That time duration forms the amplitude, and the time location of the second beat b is the time location of an RR interval sample. The Pwave, labeled in the NSR ECG plot, indicates atrial depolarization.
Table 1. A summary of automated AF detection in ECG signals. A “+” in the Salient features column indicates a positive point. Conversely, a “−” indicates a negative point.
| Authors | Data | Digital Biomarkers | AI | Performance in % | Salient Features | ||
|---|---|---|---|---|---|---|---|
| Acc | Sen | Spe | |||||
| Wang et al., 2020[30] | Wang et al., 2020 [183] | MIT-BIHAFDB | WPD followed by multivariate statistical features | ANN | 98.8 | 98.7 | 98.9 |
|
| |||
| Cao et al., 2020[31] | Cao et al., 2020 [184] | CinCchallenge 2017 | Data augmentation | DNN | 78.35 | - | - |
|
| |||
| Marsili et al., 2019[32] | Marsili et al., 2019 [185] | MIT-BIH AFDB and measurements | Shannon entropy | Threshold | 98.1 | 99.2 | 97.3 |
|
| |||
| Yao et al., 2019[33] | Yao et al., 2019 [186] | CinC challenge 2017 | DWT | Multi-scale CNN | 98.18 | 98.22 | 98.11 |
|
| |||
| Lui et al., 2018[34] | Lui et al., 2018 [187] | MIT-BIH AFDB/NSR/Arrhythmia Database | Normalized fuzzy entropy | Threshold | - | - | - |
|
| |||
| Xia et al., 2018[35] | Xia et al., 2018 [188] | MIT-BIH AFIB | STFT, SWT | CNN | 98.63 | 98.79 | 97.87 |
|
| |||
| Kora et al., 2017[36] | Kora et al., 2017 [189] | MIT-BIH AFIB | CS-SCHT | LMNN | 99.30 | 96.97 | 99.43 |
|
| |||
| Tripathy et al., 2017[37] | Tripathy et al., 2017 [138] | MIT-BIH AFIB | Sample entropy, VMD | DBN | 98.27 | 98.80 | 97.77 |
|
| |||
| Annavarapu and Padmavathi, 2016[38] | Annavarapu and Padmavathi, 2016 [190] | MIT-BIH Arrhythmia Database | CS-SCHT | LMNN | 99.50 | 99.97 | 98.70 |
|
| |||
| Abdul-Kadir et al., 2016[39] | Abdul-Kadir et al., 2016 [102] | MIT-BIH NSR/AFDB | Dynamic system | ANN, SVM | 95.00 |
|
| |||||
| Yuan et al., 2016[40] | Yuan et al., 2016 [180] | MIT-BIH NSR/AFDB/LTAFDB | - | Autoencoder DL | 98.31 | 96.56 | 99.04 |
|
| |||
| Asgari et al., 2015[41] | Asgari et al., 2015 [135] | MIT-BIH AFDB | SWT, Log-energy entropy, peak-to-average power ratio | SVM | 97.10 | 97.00 | 97.10 |
|
| |||
| Daqrouq et al., 2014[42] | Daqrouq et al., 2014 [191] | MIT-BIH AFIB | WPD | PNN | 97.92 | - | - |
|
| |||
| Martis et al., 2013[43] | Martis et al., 2013 [192] | MIT-BIH AFDB/Arrhythmia Database | DWT | NB | 99.33 | 99.32 | 99.33 |
|
| |||
| Majia et al., 2013[44] | Majia et al., 2013 [193] | MIT-BIH Arrhythmia Database | HOS and EMD | Thresholded | - | 96 | - |
|
| |||
| Rincón et al., 2012[45] | Rincón et al., 2012 [194] | MIT-BIH AFIB | Statistical measures | Fuzzy classifier | - | 98.09 | 91.66 |
|
| |||
| Lee et al., 2012[46] | Lee et al., 2012 [41] | MIT-BIH NSR/AFDB | RMSSD, sample entropy, Shannon entropy | Threshold | 98.44 | 97.63 | 99.61 |
|
| |||
| Fukunami et al., 1991[47] | Fukunami et al., 1991 [195] | Measurement data | Frequency-domain | Statistical analysis | - | 91 | 76 |
|
| |||
| Parvaresh and Ayatollahi, 2011[48] | Parvaresh and Ayatollahi, 2011 [196] | MIT-BIH AFIB | Autoregressive model | Statistical classifier | - | 96.14 | 93.20 |
|
|
The morphology of normal ECG signals differs from person-to-person[49] [82]. ECG-based AF diagnosis means to detect disease-related morphology changes. The main challenge is that these morphology changes may not be unique, which can lead to reduced specificity in identifying the disease that causes these changes. Extending the observation time might help to solve the sensitivity problem[50][51] [83,84]. Furthermore, the relationship between atrial activity, measured by surface ECGs, and AF mechanisms, is not yet well understood[52] [85]. This ambiguity translates into inaccurate detection algorithms[53] [86]. Detecting AF based on the symptomatic heart rhythm change could be a helpful way forward.
4. Heart Rate
Heart Rate (HR) can be used to detect AF episodes[54] [87]. The second row in Figure 1 shows the RR intervals that correspond to the ECG signals shown in the first row. As such, RR interval signals are constructed from RR intervals. These RR intervals represent the time from one R peak in the ECG signal to the next. In Figure 1, this is indicated by the arrows from the ECG to the RR interval signal.
For a human expert, it might be difficult to detect the subtle linear and nonlinear changes in the RR interval trace that indicate AF. Therefore, manual analysis of RR interval measurements may result in inter- and intra-observer variability. Digital biomarkers and algorithmic decision support can help to avoid these problems and hence improve diagnostic quality[55][56] [88,89].
The occurrence of symptomatic episodes in paroxysmal AF is uncertain[57][58] [90,91]. Some episodes may last more than 48 h[57] [90]. Statistical analysis shows that during AF, RR intervals have a larger standard deviation and a shorter correlation length than those during NSR. Hence, these measures can be used as digital biomarkers for AF detection. However, they are not specific enough when it comes to differentiating AF from other arrhythmias[59][60] [92,93].