The methodological design for this study’s bibliographic analysis involved two phases: (a) the collection of related research and (b) the analysis of these contributions. Data were collected from the scientific databases IEEE Xplore, ScienceDirect, MDPI, Hindawi, and from the web-based scientific indexing services Web of Science and Google Scholar. Regarding the search keywords, the following query was performed:
Only documents regarding conferences and journal articles published between 2010 to 2020 were considered. From the results, we filtered out the papers that did not provide sufficient descriptive elements for the method adopted. In this way, the number of documents was reduced to 46. Finally, each paper was analyzed considering the general approach, the AI, ML, or DL techniques employed, the sources, the type of data used, the predicted output, and the applied performance metrics.
3. Discussion
In the present section, we discuss the plant and crop disease predictions carried out through data analysis techniques, which fall into three computer areas known as AI, ML, and DL. The review considered 46 scientific papers, which predicted the onset of the disease at a pre-symptomatic (i.e., symptoms not visible to the naked eye) or at an early stage, which was done by adopting the methodology described in
Section 2.1.
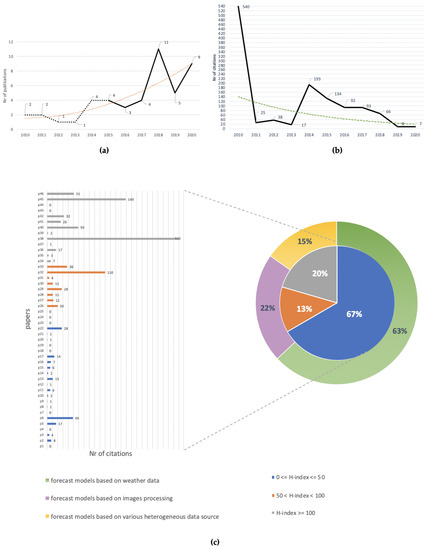
a shows the trend line of publications. From 2010 to 2020, there was an incremental trend (orange line).The majority of the papers were published after 2015, indicating how recent this sub-domain is in agriculture. More precisely, 22% of papers from 2010 to 2015 excluded (dashed line) and 78% from 2015 to 2020 (solid line). b shows the number of citations for each year considered. As can be seen, the resulting line does not show a uniform trend, with a maximum in 2010 and a minimum between 2011–2013. However, to better understand this trend, it is necessary to evaluate the impact index of the conference proceedings and journals. To this end, a bar graph was constructed (c) which shows the number of citations for each paper, with works grouped according to the journal’s H-index. Three clusters were identified: 0 ≤ H-Index ≤ 50 (blue), 50 < H-Index < 100 (orange), H-Index ≥ 100 (gray). The information relating to the citations was retrieved from the Google Scholar service, while the H-index was taken from the Scimago (
https://www.scimagojr.com/) online service. The graph shows that 67% of publications were related to an impact index lower than 50, 13% to an impact index between 50 and 100 and the remaining 20% to an impact index higher than 100. Therefore, the graph shows that the number of citations is closely linked to how often the conference proceedings/journal is consulted.
Figure 3. (
a) Number of research publications per year (2010–2020) related to plant and crop disease prediction, which predicted the onset of the disease in a pre-symptomatic (i.e., symptoms not visible to the naked eye) or early stage, recovered by adopting the methodology described in
Section 2.1; (
b) number of citations for each year considered; (
c) number of citations for each paper, which have been grouped according to the journal’s H-index.
Our study shows that the approaches used in the literature to tackle the problem under examination can be divided into three categories: forecast models based on weather data (the first category), forecast models based on image processing (the second category), and forecast models based on distinct types of data coming from various heterogeneous sources (the third category). The first and second categories are the most explored, with an adoption rate of 63% and 22%, against 15% for the third category (see c). Generally, RMs, ANNs, SVMs, and CNNs are the most used techniques. Due to the high heterogeneity of the experimental conditions (i.e., approaches, datasets, parameters, and performance metrics), it is difficult—if not unreliable—to perform a systematic comparison of the performance of each paper. Therefore, our comparisons are strictly limited to the techniques used in each paper. Taking these factors into account, we observe that the SVM and SVR when applied to the first category of models outperform ANNs and traditional regression models. As underlined by the various studies, the advantage given by the use of the SVM lies in its good ability to learn the representations of data in non-linear problems, with large dimensions and small samples. Likewise, the ANNs were favored for their ability to learn representations from past events to predict the future probability of occurrence of an event based on the conducive condition. The main obstacles encountered by the studies of the first category that used these techniques concerned the reduced size and imbalance of the classes in the dataset as well as overfitting. These problems had a major impact on the ANNs [
59]. In fact, performance was limited by their trend of requiring more time and more data for training. Another disadvantage shown by the analyzed works that unites both techniques relates to the concept of the “black box”. The relationship between input and output is difficult to explain and derive. As indicated by Gu et al. [
47], the purpose of SVR is to make predictions rather than to provide explanations. Therefore, there are limitations in explaining the effects that variables have on other variables. Although SVM showed superior performance in weather-based classification and regression problems, it did not perform as well in terms of image processing methodology.
Models belonging to this category conducted spectral analysis using optical and thermal remote sensing images as well as multispectral and hyperspectral images. The multispectral images were found to be relevant for the detection of the disease at an early stage, as demonstrated in [
38]. Besides this, the hyperspectral images most used by the studies reviewed (six papers) allowed the prediction of disease in a presymptomatic stage; i.e., even before the symptom was visible to the naked eye. This difference is due to the spectral resolution used by the two remote sensing technologies. Multispectral imaging collects spectral signals in a few discrete bands, each spanning a broad spectral range from tens to hundreds of nanometers. In contrast, hyperspectral imaging detects spectral signals in a series of continuous channels with a narrow spectral bandwidth (e.g., typically below 10 nm); therefore, it can capture fine-scale spectral features of targets that otherwise could be compromised [
30]. Multispectral images compared to hyperspectral images provide less data complexity and information content [
85]. However, the analysis of hyperspectral images brings with it various limitations. Several authors underlined the high dimensionality of the data as being among the difficulties encountered. As Mahlein et al. [
85] pointed out, the high degree of inter-band correlation results in information redundancy, which can cause convergence instability in the multivariate prediction models. Therefore, most papers focused a great deal of effort on identifying the effective wavelengths for the extraction of the target properties; i.e., the visible patterns in the spectrum that characterize a healthy leaf from a pre-symptomatic diseased leaf. Image resolution also affects model performance. Zhang et al. [
37] crossed weather data with MODIS images. The authors observed that the forecasting accuracy was affected by restricting the spatial resolution and imaging quality of optical remote sensing images.
From the results obtained in the literature, we infer that remote sensing data represent a wealth of information that is useful for the development of autonomous non-invasive systems for the prediction of biotic and abiotic stress in plants. In this context, recent Deep Learning models, such as CNNs, seem capable of properly addressing many of the technical challenges related to perceptual problems, as seen in other use cases; e.g., yield prediction [
16], land cover classification [
86], and plant and weed recognition [
87]. In particular, spectral images can be an aid to conventional adversity management techniques that are often time-consuming, destructive, expensive, and impractical. An ideal system approach requires precision, speed, and non-destructive practices.
In general, the studies of the first and second categories show that the exclusive use of a single data source is not sufficient to build models capable of capturing and predicting the variability of a disease in the field. To increase the stability and generalization capabilities of the algorithms, several authors suggest the integration of multiple data sources, as well as the inclusion of more information such as plant age, cultivar, growth phase, and soil characteristics. In fact, the results obtained from the third category of models confirm this. Zhang et al. [
67], by combining meteorological data with remote sensing data, recorded an increase in accuracy from 69% to 78%. Most works have focused on forecasting a disease by analyzing mainly meteorological parameters. Variables such as temperature, humidity, and precipitation emerge as the variables that contribute most to the onset of the disease. Each of these have different effects depending on the disease and the crop under examination. Rowlandson et al. [
88] observed that leaf wetness, together with the variables mentioned above, is a parameter that should not be neglected. The authors pointed out that the analysis of leaf wetness periods of a specific time duration is necessary, as this variable interacts with the propagule germination of most phytopathogens. Badnakhe et al. [
70] demonstrated that soil temperature plays a crucial role in
gummosis disease prediction.
As
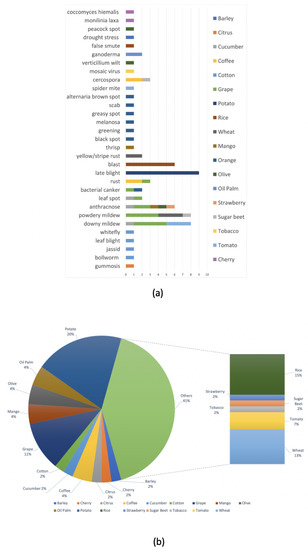
Section 2.3.3 illustrates, a large variety of algorithms and techniques have been employed to predict the occurrence or severity of diseases affecting different crops and plants. From these, we observed that many scientific contributions focused on predicting the main diseases affecting rice, wheat, and potato crops such as late blight [
3,
20], powdery mildew [
37,
67,
68], downy mildew, and blast [
46,
48,
55], as shown in a,b.
Figure 4. (a) Number of publications based on crop and disease examined; (b) current state of crops and plants explored during the last 10 years in terms of percentage of research papers.
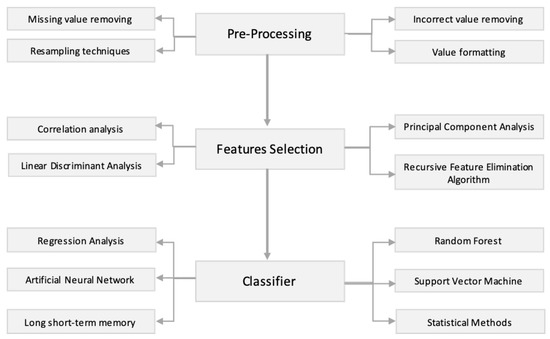
Overall, related to the approaches adopted by the works surveyed, we can generalize that a prediction model for plant and crop disease should consist of three mandatory steps: pre-processing, feature selection, and classification. The flow diagram of our survey is shown in .
Figure 5. Techniques popularly explored in the domain of plant and crop disease prediction models.
The Support Vector Machine, followed by the Artificial Neural Network and Random Forest, were the most employed techniques. Nevertheless, although te aforementioned techniques and others produced promising results, a restricted number of studies tested their solutions in different datasets. This underlying trend may be influenced by the restricted availability of open-data. To obtain available weather and environmental parameters, a large number of studies relied on third-party organizations, such as national/regional governmental services. Only a restricted number of these works gathered data with their own on-field IoT networks. According to Kamilaris et al. [
15], more big data repositories should become publicly available.
Furthermore, we noticed that there is a shortage of model validation in real-world scenarios. Appropriate validation is needed for studies to have an accurate and broad impact. This can be inferred from the fact that such studies require an extensive observation time as well as requiring the involvement of human resources with different expertise.
4. Conclusions
In this paper, we performed an analysis and classification of forecasting models for plant and crop disease over the past 10 years (2010–2020). Forty-six research works were identified and reviewed, with an examination of the approaches adopted as well as the pre-processing techniques and data used. Issues and concerns were discussed in
Section 2.4.
As we have seen in this study, the prediction of plant and crop disease is a complex problem to be solved due to the interaction of several environmental and climatic factors. Over the last 10 years, the literature has presented considerable advancements in understanding these dynamic processes by adopting different scientific approaches. As we observed, the problem under study requires high-quality, labeled data. However, the lack of open data is slowing the advance of knowledge in this agricultural sub-domain.
Indeed, regarding the state of the art, only a limited number of contributions has been presented in the literature from 2010 to today. The majority of these have focused on few pathogens and crops; furthermore, only a few of these have considered data from various heterogeneous sources to predict disease occurrence. These gaps are hindering progress in achieving development goals and creating products that are able to face realworld scenarios, and so more effort is required in data collection and in developing novel solutions to prevent and mitigate the impact of crop and plant disease to food production, especially for those crops which represent staple foods for millions of people who live in the least developed countries.