Since its first confirmed case at the end of 2019, COVID-19 has become a global pandemic in three months with more than 1.4 million confirmed cases worldwide, as of early April 2020. Quantifying the changes of pollutant emissions due to COVID-19 and associated governmental control measures is crucial to understand its impacts on economy, air pollution, and society. We used the WRF-GC model and the tropospheric NO2 column observations retrieved by the TROPOMI instrument to derive the top-down NOx emission change estimation between the three periods: P1 (January 1st to January 22nd, 2020), P2 (January 23rd, Wuhan lockdown, to February 9th, 2020), and P3 (February 10th, back-to-work day, to March 12th, 2020). We found that NOx emissions in East China averaged during P2 decreased by 50% compared to those averaged during P1. The NOx emissions averaged during P3 increased by 26% compared to those during P2. Most provinces in East China gradually regained some of their NOx emissions after February 10, the official back-to-work day, but NOx emissions in most provinces have not yet to return to their previous levels in early January. NOx emissions in Wuhan, the first epicenter of COVID-19, had no sign of emission recovering by March 12. A few provinces, such as Zhejiang and Shanxi, have recovered fast, with their averaged NOx emissions during P3 almost back to pre-lockdown levels.
- COVID-19
- air pollutant emission
- TROPOMI
- NO2
- NOx
- economic activity
1. IntrodResuctionlts
The daily top-down emissions at regional levels are subject to large day-to-day variations, which may result from real signals, random error, or uncertainties. To better illustrate the changes of top-down emissions, we grouped the data into three periods: P1 (January 1st to January 23rd, 2020), P2 (January 24th to February 9th, 2020), and P3 (February 10th to March 12th, 2020). Note that our conclusions are not sensitive to small changes in the selection of the periods. We presented the analysis of period-averaged data in Section 3.1 and Section 3.2. We also investigated on the time series of top-down NOx emissions in typical regions in Section 3.3. The complete data for each region, including NO2TROPOMI, top-down emissions, and bottom-up emissions from MEIC, are included in Table S1 (Table S1.xlsx in the Supplementary Materials).
2. NO
NO
2TROPOMI
Changes
Figure 1 shows the NO2TROPOMI averaged during three periods and the relative changes between them. “P3 versus P1” means the relative change of NO2TROPOMI between P3 and P1. It is clear that NO2TROPOMI decreased greatly in P2 relative to P1, and there is a limited recovery during P3, in accordance with a previous report [1]. The levels of NO2TROPOMI can be controlled by many factors, including anthropogenic NOx emissions, meteorology (such as sunlight, precipitation, advection, and convection), and other pollution emissions.
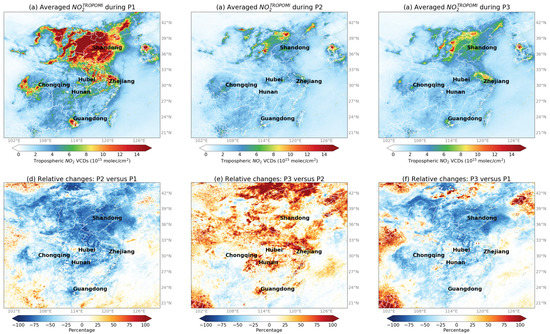
Figure 1. (a–c) TROPOMI tropospheric NO2 VCDs (NO2TROPOMI) averaged during the three periods. (d–f) Relative changes between periods.
Table 1 shows the NO2TROPOMI changes in eight selected regions, which would be discussed in more detail in Section 3.3. Overall, in East China, the NO2TROPOMI decreased by 52% from P1 to P2 and increased by 19% from P2 to P3. The averaged NO2TROPOMI increase of 0.3 × 10¹⁵ molecules/cm2 from P2 to P3 only recovered 14% of the NO2TROPOMI decrease from P1 to P2 (2.1 × 10¹⁵ molecules/cm2).
Table 1. Averages and standard deviations (temporal variability) of NO2TROPOMI during three periods and the relative changes between the three periods.
| Region | NO | 2TROPOMI | ± Standard Deviation (10 | 15 | Molecules/cm | 2 | ) | NO | 2TROPOMI | Relative Changes (%) | ||||||||||||||||||||
|---|---|---|---|---|---|---|---|---|---|---|---|---|---|---|---|---|---|---|---|---|---|---|---|---|---|---|---|---|---|---|
| Region | Top-Down Emission ± Standard Deviation (Gg/Month) | P1 | P2 | P3 | P2vP1 | 1 | P3vP2 | P3vP1 | ||||||||||||||||||||||
| Relative Changes | ||||||
|---|---|---|---|---|---|---|
| P1 | P2 | P3 | P2vP1 | 1 | P3vP2 | P3vP1 |
| East China | 4.1 ± 1.0 | 2.0 ± 0.4 | 2.3 ± 0.5 | −52% * | 19% * | −43% * |
| East China | 1589 ± 449 | 795 ± 236 | 1001 ± 283 | −50% * | 26% * | −37% * | |||||||
| Shandong | 13.1 ± 5.9 | 3.8 ± 1.1 | 4.8 ± 2.0 | −71% * | 26% | −63% * | |||||||
| Shandong | 135 ± 73 | 51 ± 28 | 76 ± 53 | −62% * | 48% | −44% * | Guangdong | 3.9 ± 0.9 | 2.2 ± 0.6 | 2.7 ± 0.8 | −45% * | ||
| Guangdong | 74 ± 24 | 22% | −33% * | ||||||||||
| 41 ± 16 | 51 ± 19 | −43% * | 23% | −30% * | Hubei | 2.5 ± 0.6 | 1.6 ± 0.6 | 2.0 ± 0.7 | −37% * | ||||
| Hubei | 25% | 27 ± 10 | 18 ± 8 | 23 ± 8 | −34% * | −21% | |||||||
| 32% | −13% | Zhejiang | 4.2 ± 1.4 | 2.1 ± 1.1 | 2.9 ± 1.0 | −49% * | 38% * | −30% * | |||||
| Zhejiang | 41 ± 17 | 23 ± 16 | 38 ± 22 | −44% * | 67% * | −6% | Hunan | 2.7 ± 1.0 | 1.8 ± 0.9 | 2.4 ± 0.9 | −33% | 33% | −11% |
| Chongqing | 4.0 ± 1.8 | 2.8 ± 1.3 | 2.7 ± 1.0 | −30% | −5% | −33% * | |||||||
| Wuhan | 5.1 ± 1.4 | 3.3 ± 1.8 | 3.3 ± 1.1 | −35% * | 0% | −35% * |
3. Top-Down NOx Emission Changes
Top-Down NOx Emission Changes
The top-down NOx emissions (as derived in Section 2.3) averaged during the three periods and the relative changes between them are shown in Figure 2 and Table 2. The top-down NOx emission for East China was estimated as 1589.3 ± 449.8 Gg/month during P1, compared to 1250.6 Gg/month estimated by the bottom-up emission inventory (MEIC). Because the focus of this research is on the relative changes of top-down emissions, the differences between top-down and bottom-up emissions are not discussed. NOx emissions decreased from P1 to P2 (Figure 2g) and increased from P2 to P3 (Figure 2h) in almost all regions in East China, consistent with emissions being the main driver of NO2TROPOMI changes during the periods. Overall, in East China, NOx emissions decreased by 50% from P1 to P2 and increased by 26% from P2 to P3. As a result, the NOx emissions during P3 were still 37% lower than the ones during P1. NOx emissions only recovered 206 Gg/month from P1 to P3, which was 26% of the emission decrease (794 Gg/month) from P1 to P2 (Figure 2i). Hereafter, an emission recovery refers to regain the emission decrease from P1 to P2 (i.e., P2-P1) in P3.
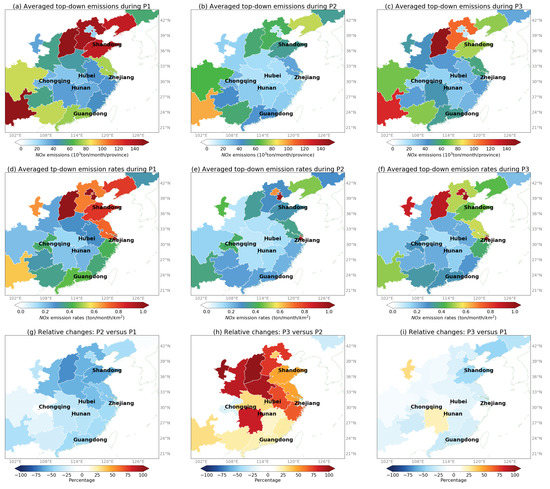
Figure 2. (a–c) Top-down NOx emissions summed up in each province during the three periods. (d–f) Top-down NOx emission rates (emission per area) of each province during the three periods. (g–i) Relative changes of top-down emissions between the periods.
Table 2. Averages and standard deviations (temporal variability) of top-down NOx emissions during the three periods and the relative changes between the three periods.
| Hunan | ||||||
| 38 ± 9 | ||||||
| 25 ± 19 | 46 ± 30 | −34% | 85% * | 22% | ||
| Chongqing | 31 ± 17 | 32 ± 15 | 24 ± 10 | 1% | −24% | −23% |
| Wuhan | 4 ± 2 | 2 ± 1 | 3 ± 0 | −41% * | 13% | −33% * |
The top-down NOx emissions decreased most in North China and Central China (e.g., Shandong) during P2 versus P1, while those in Southwest China (e.g., Chongqing) merely changed (Table 2, Table S1).
Although top-down NOx emissions changes (P2vP1: −50%, P3vP2: 26%) were very close to NO2TROPOMI changes (P2vP1: −52%, P3vP2:19%) in East China, the discrepancies between the two were evident at the provincial level. Between P1 and P2, in Jilin, Chongqing, Yunnan, and Sichuan, the relative changes of NO2TROPOMI were −54%, −30%, −2%, and −35%, respectively, and those of top-down NOx emissions were −10%, 1%, −39%, and −20%, respectively. Between P2 and P3 in Shandong, Zhejiang, and Hunan, the relative changes of NO2TROPOMI were 26%, 38%, and 33%, respectively, and these of top-down NOx emissions were 48%, 67%, and 85%, respectively.
This implies that the recovery of human activity and subsequent anthropogenic emissions was much faster than what is implied by the NO2TROPOMI in these regions. NO2TROPOMI changes are dependent on both NOx emission changes and meteorological changes. For example, it is likely that increasing precipitation, higher temperature, and stronger sunlight would shorten NOx lifetime and decrease NO2TROPOMI after February, given fixed NOx emissions. Assuming that WRF-GC reasonably captured the meteorological impact on NO2, NO2WRF-GC can serve as a baseline which shows how tropospheric NO2 VCDs should have behaved with changing meteorology but fixed emissions. The top-down NOx emissions, which were derived partly based on NO2WRF-GC, were largely independent of meteorological factors. Still, the top-down NOx emissions were subject to the uncertainties of both WRF-GC, TROPOMI retrievals, and bottom-up emissions. However, as this research focuses on the relative changes of top-down NOx emissions, as long as there is no systematic bias of temporal changes of both WRF-GC simulation and TROPOMI retrievals, we consider the results presented here to be reasonable. In East China, where primary sources of NOx emissions are anthropogenic, the actual anthropogenic NOx emission changes can be better captured by top-down NOx emission changes. The changes of NO2TROPOMI can be significantly larger or smaller than the changes of NOx emission in individual regions. Therefore, one needs to be careful when attributing the changes of NO2TROPOMI solely to the changes of human activity.
Figure 3 better illustrates the top-down NOx emission changes in each region. The recovery rate can be measured by the relative changes of top-down emissions between P3 and P1, as shown by the colored contours. The contour of “relative change P3vP1 = 0%” means a full recovery from the emission decrease in P2. Most regions have decreased emissions between P1 and P2 and increased emissions between P2 and P3. Only Ningxia and Hunan have increased emissions in P3 compared to P1, while other regions have not fully recovered in P3.
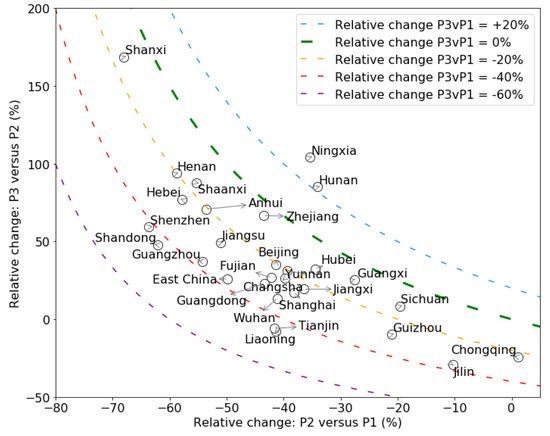
Figure 3. Relative changes between the three periods of individual modeled region, represented by the annotated circles. Colored contours represent the relative changes between top-down emissions during P3 vs these during P1.
4. Timeseries in Selected Regions
Timeseries in Selected Regions
To better understand the different emission reduction and recovery patterns, we examined the timeseries of daily regional top-down emissions of the eight selected regions in Figure 4. These regions serve as good examples of different emission change patterns. As the daily top-down NOx emissions have high day-to-day fluctuations, we also presented 14-day central moving averages in Figure 4 to better reflect the general trends. We included similar time-series of all regions, for more information see the Supplementary Materials. For readers’ references, we included several reference lines: the monthly emissions from the MEIC emission inventories, the dates for Wuhan lockdown, and official nationwide back-to-work day. The MEIC emissions serve as references on how the emissions should change temporally.
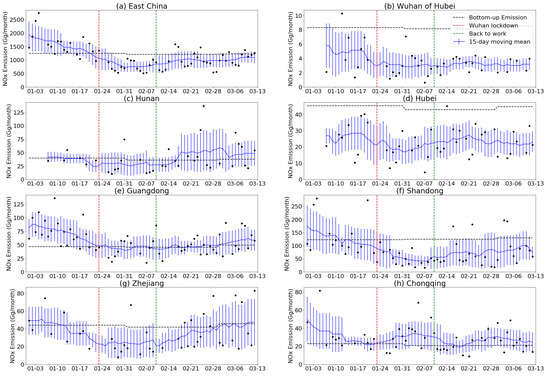
Figure 4. (a–h) Daily top-down emissions (black dots) in different regions. The horizontal black dash lines represent bottom-up emissions (MEIC) to show the a priori knowledge of the month-to-month variation of NOx emissions. The blue solid line represents 15-day center moving averages of daily top-down emissions, and the error bars represent corresponding standard deviations of the data in the 15-day window. Vertical red and green dashed lines represent the dates of Wuhan lockdown and official back-to-work day.
4.1. East China: Recovering
East China: Recovering
The top-down NOx emissions decreased before the Wuhan lockdown, reached their lowest point after the Chinese New Year (January 24 to February 2), and then gradually increased afterwards (Figure 4a). Assuming that the NOx emissions keep increasing at current rate, it would still take a few months for the emissions to return to their levels back in January.
4.2. Wuhan of Hubei: No Sign of Recovering
Wuhan of Hubei: No Sign of Recovering
Being the first epicenter of COVID-19, NOx emissions decreased in Wuhan (Figure 4b) before the lockdown and there was no sign of recovering by March 12. In fact, non-essential businesses were only allowed to return to work after March 20th [2]. Although Table 2 shows there was a possible 13% increase from P2 to P3, the p-value from an ANOVA test is 0.41 (ANOVA: p = 0.41), meaning that the difference between the P2 and P3 periods was not significant at all. This suggests a similar lockdown state of Wuhan when businesses were limitedly functioning from January 24 to March 12.
Wuhan, however, was not the only region without a successful recovery. Figure 3 shows that Liaoning and Tianjin suffered from similar emission reductions (−41%, ANOVA: p = 0.01; −42%, ANOVA: p = 0.01) from P1 to P2 and the emissions stayed about the same from P2 to P3 (−8%, ANOVA: p = 0.73; −6%, ANOVA-p = 0.79). While businesses in Tianjin and Liaoning were ordered to return to work after February 10, they seem to need more time to recover.
4.3. Hubei and Hunan: Possibly Recovered
Hubei and Hunan: Possibly Recovered
Wuhan is the capital of Hubei, and Hunan is adjacent to Hubei and generally very close to Wuhan. However, they shared a quite different emission pattern compared to Wuhan. Hubei (Figure 4d) and Hunan (Figure 4c) both have decreased NOx emissions from P1 to P2 by 34%; they featured NOx emission increases of 32% and 85% from P2 to P3, respectively. Considering the staggering NOx emission in Wuhan, the NOx emission increase was even larger in Hubei excluding Wuhan. As a result, the top-down NOx emissions in Hubei and Hunan during P3 had no significant difference compared to these during P1 (ANOVA: p = 0.32 and 0.5).
4.4. Guangdong and Shandong: Recovering Slowly
Guangdong and Shandong: Recovering Slowly
NOx emissions in many more developed and industrialized provinces greatly decreased prior to P3. Among them, we chose to use Shandong (Figure 4f) in North China and Guangdong (Figure 4e) in South China as examples. Similar to the pattern of East China, Shandong and Guangdong had NOx emission decreases of −62% and −43% from P1 to P2 (ANOVA: p = 0.00 and 0.00). The NOx emissions gradually increased (48% ANOVA: p = 0.10; 23%, ANOVA: p = 0.13) after February 9 but they had not fully recovered before March 12 (Figure 4e,f). Like Guangdong and Shandong, most other provinces followed this similar pattern, such as Jiangsu, Fujian, Guizhou, Beijing, Shanghai, and Shenzhen (Table S1 in the Supplementary Materials).
4.5. Zhejiang: Almost Recovered
Zhejiang: Almost Recovered
The top-down NOx emissions of Zhejiang decreased by 44% from P1 to P2 but increased by 67% from P2 to P3 (Table 2). As a result, the difference between P3 and P1 was not significant (−6%, ANOVA: p = 0.77). Zhejiang was the first province to declare a highest level response to coronavirus on January 23 and the first province to urge its local governments to relax control measures and support business resumption [3]. Zhenhai of Zhejiang has nearly 200 chemical plants including the largest oil refinery in China [4]. Zhejiang is also known for its thriving private sector, which constitutes 65.5% of the total gross domestic product (GDP) in the province in 2018 [5]. It is possible that both the efficient order execution of local governments and the rising pressure to resume work of private sectors resulted in the faster recovery of business activity and NOx emissions.
Besides, Zhejiang, Shanxi, Shaanxi, Guangxi, and Beijing also recovered fast with no significant difference between P1 and P3 (ANOVA: p = 0.55, 0.38, 0.49, 0.31, respectively). Among these, top-down emissions of Shanxi rebounded with the most rate, the emissions decreased by 68% (ANOVA: p = 0.00) from P1 to P2 and increased by 169% (ANOVA: p = 0.01) from P2 to P3. There are several possible reasons why the NOx emissions in Shanxi increased fast. Shanxi was one of the provinces with fewest confirmed cases (138 cases as of April 7th, 2020) [6]. Moreover, MEIC emission inventory indicates that 31% and 26% of total NOx emissions came from powerplants in Shanxi and Shaanxi, respectively (Table S1), which were much higher than the averaged percentage in East China (19%).
4.6. Chongqing: No Significant Changes
Chongqing: No Significant Changes
Surprisingly, there are a few regions not showing significant changes of NOx emissions from P1 to P2. Chongqing (Figure 4h) had no significant change of top-down NOx emissions from P1 to P2 (1%, ANOVA-p = 0.96). Jilin was also barely affected from P1 to P2 (−10%, ANOVA-p = 0.71). The reason why these regions were hardly impacted during COVID-19 is yet to be investigated.
5. Discussion
5.1. Chinese New Year
The official holidays for Chinese New Year were from January 24 to February 2, within P2 (January 23 to February 9). This may partly explain why we see the top-down NOx emission decreased steadily before Wuhan lockdown. Before the official holidays started, the business activities decreased as people may use paid time-off to travel back to their hometowns and unite with families. Moreover, it might be possible that some small businesses were taking extra caution and halted their operations even before Wuhan lockdown. The Chinese government prolonged the holidays to February 9 for spreading control purpose, which would certainly contribute to the emission decrease during P2.
Lin et al. (2011) estimated that the emission reduction associated with the Chinese New Year is about 10% in January 2009 using multiple satellite retrievals [7]. Gu et al. (2014) found that the top-down NOx emission estimated using OMI and the Global Ozone Monitoring Experiment-2 (GOME-2) retrievals decreased by 35% and 31% from January to February and increased by about 13% and 27% from February to March during 2011 in China [8]. Meanwhile, the bottom-up NOx emissions from MEIC showed little temporal changes in the study period (Figure 4, Table A1 in the Appendix).
In this study, we observed much more evident reduction (−50%) between P1 and P2 in East China and the emissions remained at low level during P3 compared to P1 (−37%). It is likely that a significant portion of the emission reductions are COVID-19 related.
The slow NOx emission increase during P3 after the prolonged holidays implied that the human activity was slowly recovering. During P3, the emissions only recovered 26% and might need at least a few months to reach its early January level at current rate. We would not anticipate such slow recovery after holidays under normal circumstances.
Future studies may compare the TROPOMI-based top-down NOx emission changes in early 2020 to the climatology of them to better quantify the impact of COVID-19. As of April 2020, TROPOMI NO2 retrievals are only available at a different version for early 2019 so that they are not directly comparable.
5.2. Economic Downturn
Even if the COVID-19-related control measures such as mandatory business halt and social distance were not enforced anymore, there could be impact on the economy if people lost their jobs, businesses went bankrupt, and people spent less for fear of an economic recession. This aftershock of COVID-19 might partly explain the slow recovery during P3.
Besides the economic interruption in China, the slow recovery of NOx emissions may result from the change of foreign economies. As COVID-19 became a global pandemic, it affected the global economy besides Chinese economy. Previous studies have shown that the previous 2007–2009 global economic recession may have reduced Chinese NOx emissions by ~20% [7][9]. Although the exports of goods and services as a percentage of GDP decreased from 32% in 2008 to 20% in 2018 [10], the decreasing demand from other countries would nevertheless impact Chinese businesses focusing on exports and the domestic suppliers.
By April 19th, 2020, more than 80 countries have established lockdown or other control measures in March and early April and the lockdown continues with numerous businesses closed [11]. Applying the method of this study to derive the different emission changes corresponding to the different control measures would be important to (1) understand how the control measures affected the environment and (2) evaluate how to minimize the economy interruption (partly reflected by the emission changes) while controlling the spread of virus.
This study focuses on the changes of NOx since it is a better indicator of human activity. Future studies may also perform similar analyses using satellite retrievals of SO2, CH4, CHOCHO, and aerosol optical depth (AOD). A comprehensive analysis on different atmospheric components would help us better understand the activity changes of each sector (e.g., powerplant, industry, transportation, and residential) and their impact on the environment and climate.
5.3. Relative Changes of Top-Down NOx Emissions and Tropospheric NO2 VCDs
The early results of NO2TROPOMI in East China and Wuhan were released by NASA and European Space Agency [1] and drew considerable attention from mass media. Although we found that the difference between the relative changes of NO2TROPOMI and top-down NOx emissions during the study period was limited (<10%) in East China, the difference was evident in specific provinces, as discussed in Section 3.2. Although NO2TROPOMI and surface NO2 concentrations are directly measured by satellite instruments and governmental monitoring systems, they are affected by both NOx emission and meteorology. Hereby, they are not direct measures of anthropogenic activities. It is possible that these NO2 concentration measures show different directions of changes compared to those of NOx emissions, like the case in Chongqing (Section 3.2). Future media releases may want to be cautious about the implications of NO2TROPOMI changes.
6. Conclusions
We used WRF-GC and TROPOMI tropospheric NO2 data to derive top-down NOx emissions of regions in East China. We found that different provinces were affected differently during January 1 to March 12, 2020 in response to COVID-19. East China was still recovering its NOx emissions by March 12. Wuhan, the first epicenter of COVID-19, showed no sign of NOx emission recovery by March 12. A few provinces, such as Zhejiang and Shanxi, featured huge NOx emission decreases during the lock-down period but almost fully recovered by March 12.
The reported emission changes and the method of this analysis can be used to (1) adjust bottom-up emissions in air quality and climate studies covering the studied period, (2) quantify socioeconomic activity changes, and (3) assess the effectiveness and impact of different measures in different regions on socioeconomic activities.
References
- Patel, K.; Stevens, J.; European Space Agency; NASA Aura team; NASA SPoRT team. Airborne Nitrogen Dioxide Plummets over China. Available online: https://earthobservatory.nasa.gov/images/146362/airborne-nitrogen-dioxide-plummets-over-china (accessed on 7 April 2020).
- Hubei COVID-19 Headquarter. Hubei Back-to-Work Notice. Available online: https://www.hubei.gov.cn/zhuanti/2020/gzxxgzbd/zxtb/202003/t20200311_2178823.shtml (accessed on 7 April 2020).
- Yeung, K. Coronavirus: Zhejiang Province Orders Relaxation of Excessive Controls to Allow Life to Return to Normal. Available online: https://www.scmp.com/economy/china-economy/article/3049821/coronavirus-chinese-province-orders-relaxation-excessive (accessed on 5 April 2020).
- Wikipedia. Zhenhai District. Available online: https://en.wikipedia.org/wiki/Zhenhai_District (accessed on 5 April 2020).
- He, L.; Cui, L.; Ma, X.; Li, L.; Wei, Y.; Zheng, M. Economic Powerhouse Leads Legislation in Beefing up Private Sector. Available online: http://www.xinhuanet.com/english/2020-01/22/c_138727326.htm (accessed on 20 April 2020).
- National Helath Commission of the People’s Republic of China. Live Data of COVID-19 Cases in China. Available online: https://datanews.caixin.com/interactive/2020/pneumonia-h5/#live-data (accessed on 7 April 2020).
- J.-T. Lin; M. B. McElroy; Detection from space of a reduction in anthropogenic emissions of nitrogen oxides during the Chinese economic downturn. Atmospheric Chemistry and Physics 2011, 11, 8171–8188, 10.5194/acpd-11-193-2011.
- Gu, D.; Wang, Y.; Smeltzer, C.; Boersma, K.F; Anthropogenic emissions of NOx over China: Reconciling the difference of inverse modeling results using GOME-2 and OMI measurements. J. Geophys. Res. Atmos. 2014, 119, 2014JD021644.
- Jintai Lin; Pan Da; Zhang Rui-Xiong; Trend and Interannual Variability of Chinese Air Pollution since 2000 in Association with Socioeconomic Development: A Brief Overview. Atmospheric and Oceanic Science Letters 2013, 6, 84-89, 10.1080/16742834.2013.11447061.
- The World Bank. Exports of Goods and Services (Percentage of GDP). Available online: https://data.worldbank.org/indicator/NE.EXP.GNFS.ZS?locations=CN (accessed on 5 April 2020).
- Wikipedia. Curfews and Lockdowns Related to the 2019–20 Coronavirus Pandemic. Available online: https://en.wikipedia.org/wiki/Curfews_and_lockdowns_related_to_the_2019%E2%80%9320_coronavirus_pandemic (accessed on 20 April 2020).