Total knee arthroplasty (TKA) is a highly effective procedure for advanced osteoarthritis of the knee. Thirty-day hospital readmission is an adverse outcome related to complications, which can be mitigated by identifying associated risk factors.
- readmission
- arthroplasty
1. Introduction
Total knee arthroplasty (TKA) is a highly effective treatment for advanced osteoarthritis of the knee[1][2]. The number of procedures being performed each year continues to grow[3]. However, despite its widespread success and increasing utilisation rates, a range of complications can arise following TKA surgery[4], some of which necessitate hospital readmission. Hospital readmission following TKA is often a marker of surgical complications[5][6]. Post-operative hospital readmissions are recognised as a significant cause for concern because such events disrupt the patient’s postoperative recovery, incur significant costs to the healthcare system¸ and controversially have been used as a marker of quality of care[7][8][9]. In the USA, unplanned hospital readmissions for all patient populations overall are estimated to cost over USD 17 billion[10] In 2004, Germany became the first country to implement financial incentives to reduce readmissions[11]. Five years later, in 2009, the United States’ Centers for Medicare & Medicaid Services introduced the Hospital Readmissions Reduction Program[9] and expanded this program in 2014 to include TKA[12][13], where hospital penalties are applied for readmission signalling government authorities to view readmission as an issue requiring attention.
By improving our ability to accurately predict individual patients’ risk of readmission following TKA, we may reduce the rate of avoidable readmissions through optimising shared decision-making and consent processes; better preparing patients for surgery and developing personalised management and discharge planning for higher risk patients. Furthermore, some readmissions are potentially avoidable and can be targeted through the development of personalised management and discharge planning for higher risk patients. Patients whose risk of readmission is difficult to mitigate, such as those patients with non-modifiable risk factors, can still benefit from risk prediction because they will be more informed as they work with the surgeon to weigh the potential benefits and risks of the procedure, and patients who have more realistic expectations regarding their likely postoperative course are more likely to achieve a satisfactory outcome following TKA [14].
Our previous narrative literature review has explored patient-related risk factors for 30-day readmissions in TKA[15]. Comorbidities such as diabetes, chronic kidney disease, and bleeding disorders were consistently shown to increase risk, but demographic factors such as age, sex, and body mass index (BMI) demonstrated a more complex and less consistent influence on 30-day readmission. Using age as an example, some researchers dichotomise at a particular number, while others create multiple categories at different cut-points with different interval durations, such as five years or 10 years. The inconsistent way different researchers categorise predictor variables when modelling risk, and the increasing age, BMI, and physical activity demands of the TKA patient population over time[16][17][18], may contribute and confound this further. Thus, the purpose of this systematic review was to apply rigorous systematic review methodology to synthesise the evidence pertaining to patient risk factors for 30-day readmission following TKA. Contrasting the more subjective style of the narrative review, which identified broad themes in the literature, the current work synthesises the evidence in the most objective manner possible, including: critical appraisal of all included articles, quantitative synthesis when appropriate, narrative synthesis when quantitative synthesis was not possible, and summary of findings in accordance with a version of the Grading of Recommendations Assessment, Development and Evaluation (GRADE) approach modified for systematic reviews of prognostic factors [19].
Objectives
The objectives of this review were to (1) identify patient-related characteristics that are associated with increased risk of unplanned 30-day readmission following TKA and (2) determine the effect size of the association between the identified risk factors and unplanned 30-day readmission[20]. This systematic review and meta-analysis synthesises existing knowledge, determines the effect size of identified factors, and aims to resolve uncertainty when discrepancies arise between reports.
2. Methods
2.1. Protocol and Registration
The protocol for this systematic review has been published [20] and registered with the International Prospective Register of Systematic Reviews (PROSPERO-CRD42019118154). Protocol deviations, and justifications for them, are outlined in Supplementary File 1 (Section S1–Amendments to Protocol). Deviations were minor and did not alter the objectives, nor the direction of this systematic review. This review was conducted in accordance with the Preferred Reporting Items for Systematic Reviews and Meta-Analyses (PRISMA) statement[21].
2.2. Eligibility Criteria
We used the adapted Patient, Intervention, Comparator, Outcome (PICO) framework[22] to answer the following questions: which patient-related factors confer increased risk of unplanned 30-day readmission following TKA, and to what extent do these factors influence the risk? Eligible studies involved TKA recipients (primary and revision) compared for 30-day readmission to any institution, due to any cause, on the basis of patient risk factors (presence vs absence of each risk factor). Case series were excluded, but all other types of quantitative study design were eligible for inclusion, including retrospective and observational studies.
No restrictions were placed on the date of publication for this review.
2.3. Information Sources, Search Strategy, and Study Inclusion
MEDLINE and EMBASE were searched from inception to 5 February 2020, using search terms related to total knee arthroplasty and patient-related risk factors for 30-day readmission. An experienced research librarian was consulted to assist with development of the search strategy, and no restriction was placed on grey literature. The full search strategy for both databases is available in Supplementary File 1 (Section S2—Search Strategies (MEDLINE(Ovid) and EMBASE(Ovid)). The search was repeated immediately prior to final analysis (8th September 2020) to obtain studies that had been published since initially searching the database. Reference lists of articles included after full text screening were also screened.
The search strategy was carried out in line with the protocol. In brief, two reviewers (DG and OJ) pilot-tested the eligibility criteria on a 10% sample of titles and abstracts of articles obtained from the database search. A third reviewer (MD) arbitrated discussions between DG and OJ to resolve any major difference in opinion arising from this process. The eligibility criteria were then applied to titles and abstracts and, subsequently, to the full text of articles that were deemed eligible for inclusion following initial screening.
Authors of articles potentially eligible for inclusion were contacted to provide the requisite data for inclusion.
2.4. Data Collection Process
Two reviewers (DG and JT) independently extracted data using a standardised data extraction form. The process was pilot-tested on 10 articles from the final set of included articles following full-text screening. Any points of clarification were resolved by discussion between DG and JT. DG identified additional information required in order to complete the critical appraisal assessment and this was verified by JT as well as the reviewer who completed the critical appraisal assessment with DG (WK).
2.5. Data Items
Data items extracted were those listed in the protocol, as well as several additional items necessary for critical appraisal (Supplementary File 1, Tables S3–S7).
As outlined in the protocol amendments (Supplementary File 1, Section S1), adjusted odds ratios (ORs) were preferentially collected over risk ratios (RRs), as this reflects how data were reported in the vast majority of included studies, which were retrospective in nature. As the estimated 30-day readmission rate for TKA ranges from 3%[5] to 4.6% [23][23] and this is well below the 10% threshold whereby the OR provides a reasonable approximation of the RR [20][24], it is unlikely that this would have altered the key findings.
2.6. Risk of Bias of Individual Studies
The Joanna Briggs Institute (JBI) critical appraisal tool [25] was used for all studies. A semi-quantitative method was used, based on that used by Goplen et al. [26] in a systematic review on outcomes in total joint arthroplasty (TJA) patients. However, since there is no valid cut-off value to determine “high” or “low” methodological quality, we assessed quality in relative terms by splitting the studies according to risk of bias quartiles. The item: “Were the groups/participants free of the outcome at the start of the study (or at the moment of exposure)?” was omitted from the checklist as it is not possible for a patient to be readmitted prior to their TKA procedure. The remaining 10 items were given equal weighting with a higher score indicating greater risk of bias. Each “no” was given a score of 2, each ‘unclear a score of 1, and each “yes” a score of 0. Arbitrarily selecting a cut-point above which a study is considered to be at high risk of bias is problematic because there are no clear guidelines pertaining to the choice of such a cut-point. Instead, quartiles of risk of bias were calculated to distinguish between higher quality studies (lower risk of bias quartiles) and lower quality studies (higher risk of bias quartiles). This use of quartiles is similar to that used by Detweiler et al., 2016 [27] in their exploration of methodological quality of systematic reviews, and we believe it provides readers with an easily interpretable way of judging the relative methodological quality of included studies without generating an overwhelming number of categories.
Selective reporting was also assessed for each study. This was included in the summary table for critical appraisal but because it was not a JBI checklist item, it did not contribute to the calculation of risk of bias score.
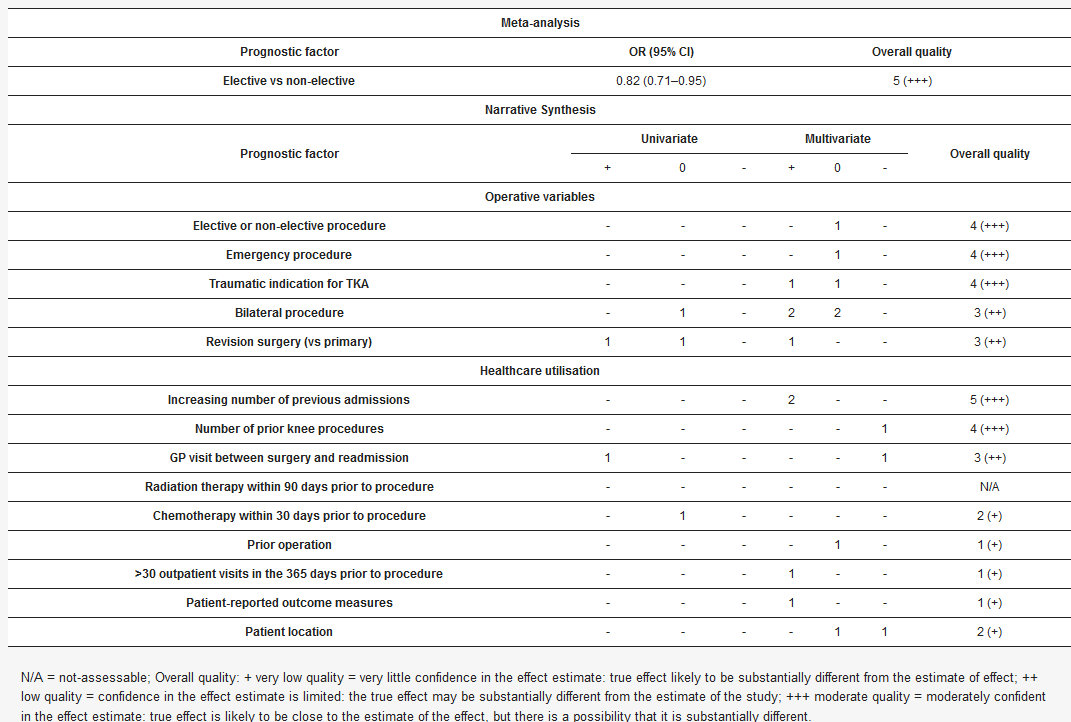
Table 1 depicts a generic example of the way in which the outcome of critical appraisal is presented in this review for an imaginary study, for the sake of illustration.
Table 1. Example of critical appraisal table.
| Meta-analysis | ||||||||||||||||
| Prognostic factor | OR (95% CI) | Overall quality | ||||||||||||||
| OR (95% CI) | Overall quality | Hispanic race | 0.92 (0.68–1.25) | 5 (+++) | ||||||||||||
| Elective vs non-elective | 0.82 (0.71–0.95) | 5 (+++) | Narrative Synthesis | |||||||||||||
| Narrative Synthesis | Prognostic factor | Univariate | Multivariate | Overall quality | ||||||||||||
| Prognostic factor | Univariate | Multivariate | Overall quality | + | 0 | - | + | 0 | - | |||||||
| Age (continuous variable) | ||||||||||||||||
| + | 0 | - | + | 0 | - | Age | 3 | |||||||||
| Operative variables | 1 | - | 4 | 3 | - | 5 (+++) | ||||||||||
| Elective or non-elective procedure | - | - | - | - | 1 | - | 4 (+++) | Sex | ||||||||
| Emergency procedure | - | - | - | - | 1 | - | 4 (+++) | Female sex | - | 1 | - | - | 1 | 4 | ||
| Traumatic indication for TKA | 5 (+++) | |||||||||||||||
| - | - | - | 1 | 1 | - | 4 (+++) | Male sex | 2 | 2 | - | 8 | - | - | 6 (++++) | ||
| Bilateral procedure | - | 1 | - | 2 | 2 | - | 3 (++) | Race | ||||||||
| Revision surgery (vs primary) | 1 | 1 | - | 1 | - | - | 3 (++) | Black (reference = white or non-Black) | 1 | 1 | - | 4 | 3 | - | 4 (+++) | |
| Hispanic (reference = white or non-Hispanic) | - | 1 | - | - | ||||||||||||
| Healthcare utilisation | - | |||||||||||||||
| Increasing number of previous admissions | - | - | - | 2 | -- | 1 (+) | ||||||||||
| - | 5 (+++) | Asian (reference = white) | - | 2 | - | - | 1 | 2 | - | |||||||
| Number of prior knee procedures | - | - | - | - | -4 (+++) | |||||||||||
| 1 | 4 (+++) | Native Hawaiian (reference = white) | - | 1 | - | - | - | |||||||||
| GP visit between surgery and readmission | 1 | - | - | - | 3 (++) | |||||||||||
| - | - | 1 | American Indian (reference = white) | - | 2 | - | - | 1 | - | 4 (+++) | ||||||
| 3 (++) | ||||||||||||||||
| Radiation therapy within 90 days prior to procedure | - | - | - | - | - | - | N/A | White | - | 1 | 1 | - | 1 | - | 2 (+) | |
| Chemotherapy within 30 days prior to procedure | - | 1 | - | - | - | - | 2 (+) | Indian (reference = Chinese) | - | - | - | |||||
| Prior operation | - | - | 1 | - | 2 (+) | |||||||||||
| - | - | - | 1 | - | 1 (+) | Malay (reference = Chinese) | - | - | - | - | 1 | |||||
| >30 outpatient visits in the 365 days prior to procedure | - | - | 2 (+) | |||||||||||||
| - | - | 1 | - | - | 1 (+) | Biracial (Workman) or mixed race (Ali) | 1 | - | ||||||||
| Patient-reported outcome measures | -- | 1 | - | - | -5 (+++) | |||||||||||
| - | 1 | - | - | 1 (+) | Minority ethnicity- | - | 1 | - | - | 2 (+) | ||||||
| Patient location | - | - | - | - | 1 | 1 | 2 (+) | Other (Tang = Chinese; otherwise = white) | - | 1 | - | 1 | 4 | 2 | 3 (++) | |
| Missing | - | 1 | - | 1 | - | 3 | 3 (++) | |||||||||
| Race (combined analysis – i.e., racial difference exists between readmitted and non-readmitted cohorts) | 2 | - | - | 1 | - | - | 4 (+++) | |||||||||
| Socioeconomic | ||||||||||||||||
| Decreasing incoming | - | - | - | 3 | 1 | - | 5 (+++) | |||||||||
| Low socioeconomic status | 1 | - | - | 1 | - | - | 4 (+++) | |||||||||
| Insurance status | ||||||||||||||||
| Medicare (reference category = private insurance or non-Medicare) | - | - | - | 4 | - | - | 4 (+++) | |||||||||
| Medicaid (reference category = private insurance) | - | - | - | 3 | - | - | 3 (++) | |||||||||
| Self-pay, no charge, workers’ compensation, or other (reference category = private insurance) | - | - | - | - | 2 | 3 | 2 (+) | |||||||||
| Disability entitlement | - | - | - | 1 | - | - | 3 (++) | |||||||||
| Functional status, living situation, and frailty | ||||||||||||||||
| Dependent functional status | - | - | - | 1 | - | - | 4 (+++) | |||||||||
| Use of walking aids | 1 | - | - | - | 1 | - | 4 (+++) | |||||||||
| Living alone | - | 1 | - | - | 2 | - | 5 (+++) | |||||||||
| Living in an institution or nursing home | - | 1 | - | 1 | - | - | 3 (++) | |||||||||
| Homeless | - | - | - | 1 | - | |||||||||||
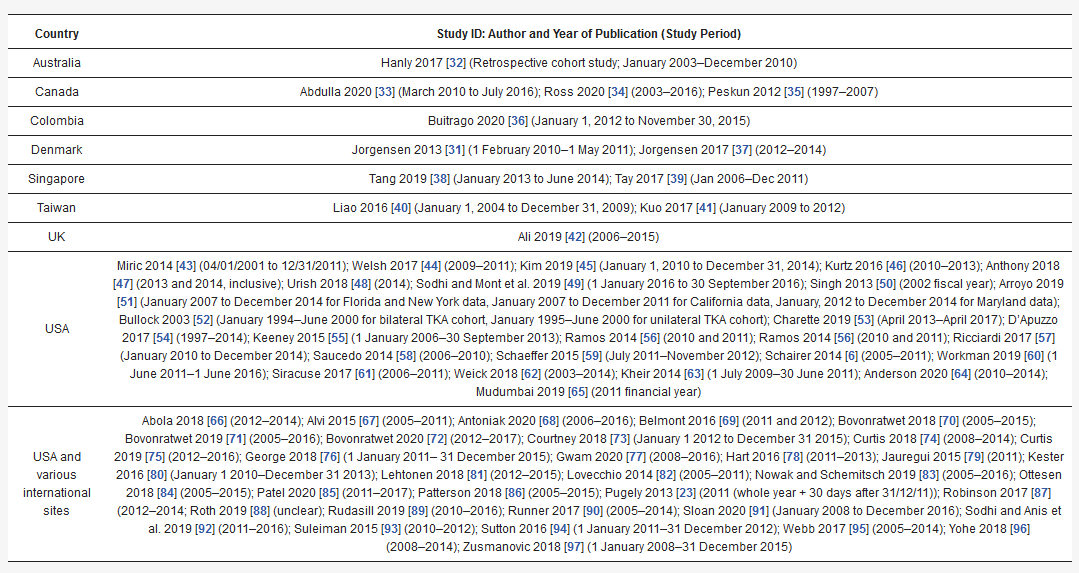
| Canada | |
| Abdulla 2020[29] (March 2010 to July 2016); Ross 2020[30] (2003–2016); Peskun 2012[31] (1997–2007) | |
| Colombia | Buitrago 2020 [32] (January 1, 2012 to November 30, 2015) |
| Denmark | Jorgensen 2013 [33] (1 February 2010–1 May 2011); Jorgensen 2017[34] (2012–2014) |
| Singapore | Tang 2019 [35] (January 2013 to June 2014); Tay 2017 [36] (Jan 2006–Dec 2011) |
| Taiwan | Liao 2016[37] (January 1, 2004 to December 31, 2009); Kuo 2017[38] (January 2009 to 2012) |
| UK | Ali 2019 [39](2006–2015)[40][41] |
| USA | Miric 2014[42] (04/01/2001 to 12/31/2011); Welsh 2017[43] (2009–2011); Kim 2019 [44] (January 1, 2010 to December 31, 2014); Kurtz 2016 [45] (2010–2013); Anthony 2018 [46] (2013 and 2014, inclusive); Urish 2018 [47] (2014); Sodhi and Mont et al. 2019[48] (1 January 2016 to 30 September 2016); Singh 2013 [49] (2002 fiscal year); Arroyo 2019 [50] (January 2007 to December 2014 for Florida and New York data, January 2007 to December 2011 for California data, January, 2012 to December 2014 for Maryland data); Bullock 2003 [51] (January 1994–June 2000 for bilateral TKA cohort, January 1995–June 2000 for unilateral TKA cohort); Charette 2019 [52] (April 2013–April 2017); D’Apuzzo 2017 [53] (1997–2014); Keeney 2015 [54] (1 January 2006–30 September 2013); Ramos 2014 [55] (2010 and 2011); Ramos 2014[55] (2010 and 2011); Ricciardi 2017 [56] (January 2010 to December 2014); Saucedo 2014 [57] (2006–2010); Schaeffer 2015 [58](July 2011–November 2012); Schairer 2014 [6] (2005–2011); Workman 2019[59] (1 June 2011–1 June 2016); Siracuse 2017[60] (2006–2011); Weick 2018[61](2003–2014); Kheir 2014 [62] (1 July 2009–30 June 2011); Anderson 2020 [63] (2010–2014); Mudumbai 2019[64] (2011 financial year) |
| USA and various international sites | Abola 2018 [65](2012–2014); Alvi 2015 [66] (2005–2011); Antoniak 2020[67](2006–2016); Belmont 2016 [68](2011 and 2012); Bovonratwet 2018[69] (2005–2015); Bovonratwet 2019[70] (2005–2016); Bovonratwet 2020[71] (2012–2017); Courtney 2018 [72](January 1 2012 to December 31 2015); Curtis 2018[73] (2008–2014); Curtis 2019[74] (2012–2016); George 2018[75](1 January 2011– 31 December 2015); Gwam 2020 [76] (2008–2016); Hart 2016 [77] (2011–2013); Jauregui 2015 [78](2011); Kester 2016 [79](January 1 2010–December 31 2013); Lehtonen 2018 [80] (2012–2015); Lovecchio 2014[81] (2005–2011); Nowak and Schemitsch 2019[82] (2005–2016); Ottesen 2018 [83] (2005–2015); Patel 2020 [84] (2011–2017); Patterson 2018 [85][86] (2005–2015); Pugely 2013 [23] (2011 (whole year + 30 days after 31/12/11)); Robinson 2017 [86](2012–2014; Roth 2019 [87] (unclear); Rudasill 2019[88] (2010–2016); Runner 2017 [89] (2005–2014); Sloan 2020 [90][91] (January 2008 to December 2016); Sodhi and Anis et al. 2019[91] (2011–2016); Suleiman 2015 [92](2010–2012); Sutton 2016 [93](1 January 2011–31 December 2012); Webb 2017[94] (2005–2014); Yohe 2018 |
| Critical Appraisal | ||||||||||||
|---|---|---|---|---|---|---|---|---|---|---|---|---|
| Study ID | * JBI 1. | JBI 2. | JBI 3. | JBI 4. | JBI 5. | JBI 7. | JBI 8. | JBI 9. | JBI 10. | JBI 11. | Overall Risk of Bias Score (Quartile; Arranged in Descending Order) | Evidence of Selective Reporting |
| Example study | Y | Y | Y | Y | Y | Y | Y | N | U | Y | 3/20 therefore 15% (1st quartile) | No |
The colour scheme mimics that of a traffic light system indicating whether each critical appraisal criterion was fulfilled in the given study: Green = yes (Y), Yellow = unclear (U), Red = No (N); * Joanna Briggs Institute critical appraisal checklist for cohort studies – components: Joanna Briggs Institute (JBI) 1. Were the groups similar and recruited from the same population? JBI 2. Were the exposures measured similarly to assign people to both exposed and unexposed groups? JBI 3. Was the exposure measured in a valid and reliable way? JBI 4. Were confounding factors identified? JBI 5. Were strategies to deal with confounding factors stated? JBI 6. (Omitted because it is not relevant) Were the groups/participants free of the outcome at the start of the study (or at the moment of exposure)? JBI 7. Were strategies to deal with confounding factors stated? JBI 8. Was the follow up time reported and sufficient to be long enough for outcomes to occur? JBI 9. Was follow up complete, and if not, were the reasons for loss to follow up described and explored? JBI 10. Were strategies to address incomplete follow up utilized? JBI 11. Was appropriate statistical analysis used?
3. Results
3.1. Study Selection
Supplementary File 1 (Tables S3–S7)
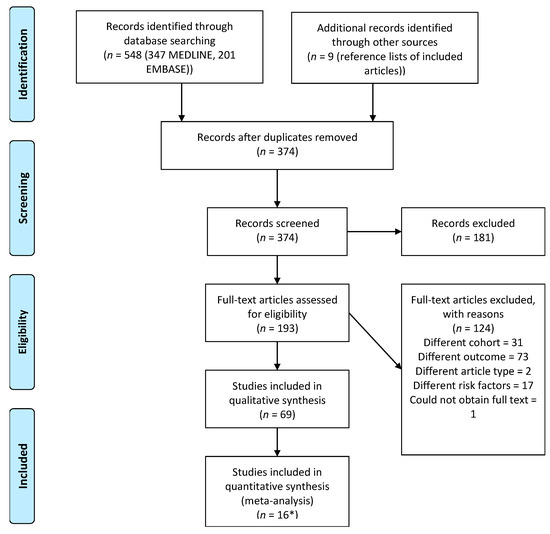
Figure 1.
Table 3.
Three authors of potentially eligible articles were contacted to provide data necessary for inclusion, and one returned the required data [33].
3.2. Risk of Bias of Individual Studies
Table S15 (Supplementary File) shows that studies at 0–15% risk of bias (RoB) comprised the first RoB quartile, studies at 20% RoB comprised the second quartile, studies at 25–35% RoB comprised the third quartile, and studies at 40–70% RoB comprised the fourth quartile. Only 2/69 studies (3%) definitively addressed loss to follow-up, i.e., loss to follow-up occurs when patients are not routinely contacted during the 30-day post-discharge period to ascertain whether they were readmitted even if the readmission was to an institution other than that at which they underwent TKA, whereas three provided some level of justification and the remaining 64 studies clearly did not adequately address this. Similarly, only 14/69 studies (20%) clearly documented a strategy to deal with incomplete follow-up. Only 9/69 studies (13%) reported adjusted analyses with a clearly documented and robust method of handling missing data, whereas 49/69 studies (71%) reported adjusted analyses without mention of how missing data were handled, and 11/69 studies (16%) reported only unadjusted analyses. These 11 studies were therefore penalised for not adequately addressing confounding results. Thirty-one studies also had evidence of selective reporting.
3.3. Risk of Bias across Studies
n < 10) of compatible studies available for meta-analysis of any risk factor[97].
In accordance with Huguet et al. 2013[19], publication bias was assumed to be a serious limitation for every prognostic factor except those that were analysed in multiple studies of different sample sizes from relatively small (<10,000 participants) to large (>10,000 participants). While publication bias could not be ruled out from these risk factors, we considered it unlikely to be a serious limitation when considering the overall weight of evidence for these factors. See the summary of findings tables (
Supplementary File 1, Tables S8, S16–S18
| Meta-analysis |
|---|
| - | ||||||||
| 2 (+) | ||||||||
| Frailty (Modified Frailty Index) | ||||||||
| - | ||||||||
| - | ||||||||
| - | ||||||||
| 1 | ||||||||
| - | ||||||||
| - | ||||||||
| 5 (+++) | ||||||||
| Prognostic factor | ||||||||
| OR (95% CI) | ||||||||
| Overall quality | ||||||||
| Alcohol abuse | ||||||||
| 1.08 (0.96–1.20) | 6 (++++) | |||||||
| BMI < 18.5 vs. normal | ||||||||
| 1.15 (0.45–2.98) | 4 (+++) | |||||||
| BMI 25–30 vs. normal | ||||||||
| 0.91 (0.80–1.03) | 6 (++++) | |||||||
| BMI 30–35 vs. normal | ||||||||
| 0.90 (0.80–1.02) | 6 (++++) | |||||||
| BMI 35–40 vs. normal | ||||||||
| 0.84 (0.69–1.02) | 6 (++++) | |||||||
| BMI > 40 vs. normal | ||||||||
| 1.05 (0.84–1.31) | 6 (++++) | |||||||
| Obesity | ||||||||
| 1.06 (1.02–1.09) | 4 (+++) | |||||||
| Weight loss | ||||||||
| 0.95 (0.71–1.27) | 3 (++) | |||||||
| Arrhythmias and AF combined | ||||||||
| 1.14 (1.09–1.19) | 4 (+++) | |||||||
| Ischaemic heart disease (IHD) + coronary artery disease (CAD) + cardiac disease | ||||||||
| 1.29 (0.79–2.09) | 3 (++) | |||||||
| Peripheral vascular disease | ||||||||
| 1.17 (1.10–1.24) | 5 (+++) | |||||||
| Previous myocardial infarction, or coronary artery disease | ||||||||
| 1.18 (0.29–4.88) | 3 (++) | |||||||
| Non-insulin-dependent diabetes mellitus (NIDDM) | ||||||||
| 1.08 (0.80–1.45) | 4 (+++) | |||||||
| Liver disease | ||||||||
| 1.29 (1.20–1.39) | 4 (+++) | |||||||
| Peptic ulcer disease | ||||||||
| 0.94 (0.84–1.07) | 4 (+++) | |||||||
| Anaemia | ||||||||
| 1.19 (1.15–1.24) | 6 (++++) | |||||||
| Deficiency anaemias | ||||||||
| 1.06 (1.01–1.11) | 4 (+++) | |||||||
| Coagulopathy | ||||||||
| 1.25 (1.15–1.36) | 4 (+++) | |||||||
| Fluid and electrolyte disorder | ||||||||
| 1.05 (1.00–1.12) | 4 (+++) | |||||||
| Chronic pulmonary disease | ||||||||
| 1.28 (1.22–1.34) | 3 (++) | |||||||
| Paralysis | ||||||||
| 1.13 (0.97–1.31) | 4 (+++) | |||||||
| Psychiatric disorder | ||||||||
| 1.43 (1.12–1.70) | 3 (++) | |||||||
| Smoking | ||||||||
| 1.25 (0.82–1.91) | 5 (+++) | |||||||
| Rheumatologic disorder | ||||||||
| 1.11 (1.04–1.18) | 3 (++) | |||||||
| Narrative Synthesis | ||||||||
| Prognostic factor | ||||||||
| Univariate | ||||||||
| Multivariate | ||||||||
| Overall quality | ||||||||
| + | 0 | - | + | 0 | - | |||
| Composite comorbidity indices | ||||||||
| Charlson Comorbidity Index (CCI) 1-2 (reference category = 0) | ||||||||
| - | - | - | 2 | - | - | 6 (++++) | ||
| CCI 1 (reference category = 0) | ||||||||
| - | - | - | 2 | 1 | - | 6 (++++) | ||
| CCI 2 (reference category = 0) | ||||||||
| - | - | - | 1 | - | - | 5 (++++) | ||
| CCI ≥2 (reference category = 0) | ||||||||
| - | - | - | 1 | 1 | - | 6 (++++) | ||
| CCI 3-4 (reference category = 0) | ||||||||
| - | - | - | 1 | - | - | 5 (+++) | ||
| CCI ≥3 (reference category = 0) | ||||||||
| - | - | - | 1 | - | - | 4 (+++) | ||
| CCI 5+ (reference category = 0) | ||||||||
| - | - | - | 1 | - | - | 5 (+++) | ||
| Increasing CCI | ||||||||
| - | - | - | - | 1 | - | 3 (++) | ||
| Presence of any comorbidity | ||||||||
| 1 | - | - | 2 | - | - | 4 (+++) | ||
| Increasing American Society of Anaesthesiologists (ASA) classification (reference category = 2) | ||||||||
| - | - | - | 1 | - | - | 4 (+++) | ||
| Increasing ASA classification (reference category = 1) | ||||||||
| - | - | - | - | 1 | - | 2 (+) | ||
| ASA classification (other) | ||||||||
| - | 1 | - | - | 1 | - | 2 (+) | ||
| Increasing Elixhauser Index | ||||||||
| - | - | - | 1 | - | - | 5 (+++) | ||
| Increasing DRG (Diagnosis-related group) | ||||||||
| - | - | - | 1 | - | - | 3 (++) | ||
| Cardiovascular | ||||||||
| Hypertension | ||||||||
| 2 | 2 | - | 6 | 1 | - | 5 (+++) | ||
| Hyperlipidaemia | ||||||||
| 1 | 1 | - | - | - | - | 4 (+++) | ||
| Cardiac disease | ||||||||
| - | - | - | 1 | - | - | 3 (++) | ||
| Cardiovascular disease (CVD) | ||||||||
| - | 1 | - | - | - | - | 3 (++) | ||
| Congestive Cardiac/Heart Failure (CCF/CHF) | ||||||||
| 3 | - | - | 5 | 2 | - | 5 (+++) | ||
| Valvular disease | ||||||||
| 1 | - | - | 2 | 1 | - | 3 (++) | ||
| Peripheral vascular disease | ||||||||
| 1 | 1 | - | - | 1 | - | 3 (++) | ||
| History of percutaneous coronary intervention or cardiac surgery | ||||||||
| 1 | - | - | - | - | - | 2 (+) | ||
| BMI, obesity, and weight loss | ||||||||
| BMI (continuous) | ||||||||
| - | 1 | - | 1 | 1 | - | 4 (+++) | ||
| BMI underweight (reference category = overweight (25–30)) | ||||||||
| - | - | - | - | 1 | - | 4 (+++) | ||
| BMI normal weight (reference category = overweight (25–30)) | ||||||||
| - | - | - | - | 1 | - | 4 (+++) | ||
| BMI obese (reference category = overweight (25–30)) | ||||||||
| - | - | - | - | 1 | - | 4 (+++) | ||
| BMI very obese (reference category = overweight (25–30)) | ||||||||
| - | - | - | - | 1 | - | 4 (+++) | ||
| BMI morbidly obese (reference category = overweight (25–30)) | ||||||||
| - | - | - | 1 | - | - | 4 (+++) | ||
| BMI > 30 (reference category = normal weight) | ||||||||
| - | - | - | 1 | - | - | 2 (+) | ||
| Increasing BMI (reference category = <25) | ||||||||
| - | 1 | - | - | - | - | 1 (+) | ||
| Obesity | ||||||||
| 1 | 1 | - | 2 | 1 | - | 2 (+) | ||
| Morbid obesity | ||||||||
| - | 1 | - | - | - | - | 2 (+) | ||
| Weight loss | ||||||||
| - | 1 | - | - | 1 | - | 4 (+++) | ||
| Endocrine | ||||||||
| Diabetes (general category and Peskun type two diabetes mellitus (T2DM)) | ||||||||
| - | 1 | - | 5 | 4 | - | 3 (++) | ||
| Diabetes (with complications) | ||||||||
| 1 | - | - | 1 | - | - | 5 (+++) | ||
| Diabetes (without complications) | ||||||||
| 1 | - | - | 1 | - | - | 5 (+++) | ||
| Insulin-dependent diabetes mellitus (IDDM) | ||||||||
| 1 | - | - | 1 | - | - | 5 (+++) | ||
| NIDDM | ||||||||
| 1 | - | - | - | 1 | - | 4 (+++) | ||
| Hypothyroidism | ||||||||
| - | 1 | - | - | 1 | - | 5 (+++) | ||
| Gastrointestinal | ||||||||
| Liver disease | ||||||||
| 1 | - | - | - | 1 | - | 2 (+) | ||
| Haematological | ||||||||
| Anaemia | ||||||||
| - | - | - | 1 | 1 | 1 | 4 (+++) | ||
| Anaemia (blood loss) | ||||||||
| 1 | - | - | - | 1 | - | 4 (+++) | ||
| Anaemia (deficiency) | ||||||||
| 1 | - | - | - | 2 | - | 3 (++) | ||
| Bleeding disorders | ||||||||
| 1 | - | - | 1 | - | - | 3 (++) | ||
| Coagulopathy | ||||||||
| 1 | - | - | - | - | - | 3 (++) | ||
| Anticoagulant therapy | ||||||||
| - | - | - | - | 1 | - | 2 (+) | ||
| Increasing INR | ||||||||
| 1 | - | - | 1 | - | - | 4 (+++) | ||
| Fluid and electrolyte disorder | ||||||||
| 1 | - | - | 1 | - | - | 3 (++) | ||
| Elevated serum blood urea nitrogen (BUN) | ||||||||
| 1 | - | - | 1 | - | - | 4 (+++) | ||
| Hyponatraemia | ||||||||
| - | 1 | - | - | 1 | - | 4 (+++) | ||
| Low albumin | ||||||||
| - | - | - | 1 | - | - | 4 (+++) | ||
| Elevated creatinine | ||||||||
| 1 | - | - | - | - | - | 3 (++) | ||
| Elevated WBC count | ||||||||
| 1 | - | - | - | - | - | 3 (++) | ||
| Reduced haematocrit | ||||||||
| 1 | - | - | - | - | - | 3 (++) | ||
| Low platelets | ||||||||
| 1 | - | - | - | - | - | 3 (++) | ||
| Respiratory | ||||||||
| Chronic obstructive pulmonary disease (COPD) and chronic airways disease (combined) | ||||||||
| - | - | - | 4 | - | - | 3 (++) | ||
| Pulmonary disease | ||||||||
| 1 | - | - | 1 | 1 | - | 4 (+++) | ||
| Smoking | ||||||||
| 1 | 2 | - | 1 | - | - | 3 (++) | ||
| Pulmonary circulation disorder | ||||||||
| - | - | - | 1 | 1 | - | 2 (+) | ||
| Asthma | ||||||||
| - | 1 | - | - | - | - | 1 (+) | ||
| Dyspnoea | ||||||||
| 1 | - | - | - | 1 | - | 3 (++) | ||
| Previous pneumonia | ||||||||
| - | - | - | - | 1 | - | 3 (++) | ||
| Obstructive sleep apnoea | ||||||||
| - | 1 | - | - | - | - | 1 (+) | ||
| Cardiopulmonary disease | ||||||||
| 1 | - | - | - | - | - | 0 (+) | ||
| Psychiatric | ||||||||
| Depression | ||||||||
| 1 | 2 | - | 3 | 1 | - | 5 (+++) | ||
| ‘Other’ mental health condition (other than depression) | ||||||||
| - | - | - | 1 | - | - | 3 (++) | ||
| Bipolar disorder | ||||||||
| - | 1 | - | - | - | - | 1 (+) | ||
| Post-traumatic stress disorder (PTSD) | ||||||||
| - | 1 | - | - | - | - | 1 (+) | ||
| Anxiety disorder | ||||||||
| - | 2 | - | - | - | - | 2 (+) | ||
| Alcohol abuse | ||||||||
| 1 | 2 | - | - | - | - | 3 (++) | ||
| Drug abuse (including general substance abuse designation, and drug/alcohol abuse (combined category in Kurtz)) | ||||||||
| 1 | 1 | - | 2 | - | - | 4 (+++) | ||
| Psychoses | ||||||||
| 1 | - | - | - | - | - | 2 (+) | ||
| Neoplastic | ||||||||
| History of cancer | ||||||||
| 1 | - | - | 2 | 1 | - | 4 (+++) | ||
| Disseminated cancer | ||||||||
| 1 | - | - | 1 | 2 | - | 3 (++) | ||
| Lymphoma | ||||||||
| - | - | - | 2 | - | - | 4 (+++) | ||
| Neurological | ||||||||
| Previous stroke | ||||||||
| - | 1 | - | 1 | - | 1 | 4 (+++) | ||
| Dementia | ||||||||
| - | - | - | 1 | - | - | 4 (+++) | ||
| Other neurological disorder | ||||||||
| 1 | - | - | 2 | 1 | - | 3 (++) | ||
| In-hospital complications | ||||||||
| Deep vein thrombosis | ||||||||
| - | - | - | 1 | - | - | 5 (+++) | ||
| Pulmonary embolism | ||||||||
| - | - | - | 1 | - | - | 5 (+++) | ||
| Any complication | ||||||||
| 1 | - | - | 1 | - | - | 6 (++++) | ||
| Any medical complication | ||||||||
| 1 | - | - | 1 | - | - | 4 (+++) | ||
| Any surgical complication | ||||||||
| 1 | - | - | 1 | - | - | 4 (+++) | ||
| Urinary tract infection | ||||||||
| - | - | - | 1 | - | - | 5 (+++) | ||
| Surgical site infection | ||||||||
| - | - | - | 1 | - | - | 5 (+++) | ||
| Sepsis | ||||||||
| 1 | - | - | - | 1 | - | 4 (+++) | ||
| Cardiac (including cardiac arrest and myocardial infarction) | ||||||||
| - | - | - | 1 | - | - | 4 (+++) | ||
| Pneumonia | ||||||||
| - | - | - | 1 | - | - | 5 (+++) | ||
| Acute renal failure | ||||||||
| - | - | - | 1 | - | - | 5 (+++) | ||
| Cerebrovascular accident (CVA) or transient ischaemic attach (TIA) | ||||||||
| 1 | - | - | - | - | - | 3 (++) | ||
| Renal | ||||||||
| Chronic kidney disease (CKD) | ||||||||
| 1 | - | - | 2 | 1 | - | 5 (+++) | ||
| Dialysis dependence | ||||||||
| - | - | - | 1 | - | - | 4 (++) | ||
| Renal failure–acute, preoperative | ||||||||
| - | - | - | - | 1 | - | 4 (++) | ||
| Renal failure/disease–chronicity unspecified | ||||||||
| 1 | - | - | 5 | - | - | 6 (++++) | ||
| Rheumatological and autoimmune | ||||||||
| Rheumatoid arthritis/collagen vascular diseases | ||||||||
| 1 | - | - | - | - | - | 3 (++) | ||
| Steroid or other immunosuppressant use for chronic condition | ||||||||
| - | - | - | 1 | - | - | 3 (++) | ||
| Other | ||||||||
| Preoperative opioid use | ||||||||
| - | - | - | 2 | 1 | - | 3 (++) | ||
| Post-discharge opioid use | ||||||||
| - | - | - | 1 | - | - | 1 (+) | ||
Overall quality: + very low quality = very little confidence in the effect estimate: true effect likely to be substantially different from the estimate of effect; ++ low quality = confidence in the effect estimate is limited: the true effect may be substantially different from the estimate of the study; +++ moderate quality = moderately confident in the effect estimate: true effect is likely to be close to the estimate of the effect, but there is a possibility that it is substantially different; ++++ high quality = very confident that the true effect lies close to that of the estimate of the effect.
Table 6.
| Meta-analysis | ||||||||
| Prognostic factor | ||||||||
| Preoperative medication use (general) | ||||||||
| - | ||||||||
| - | ||||||||
| - | ||||||||
| 1 | ||||||||
| - | ||||||||
| - | ||||||||
| 3 (++) | ||||||||
| Preoperative medication use (analgesics) | ||||||||
| - | ||||||||
| - | ||||||||
| - | ||||||||
| 1 | ||||||||
| - | ||||||||
| 1 (+) | ||||||||
| Preoperative medication use (anticonvulsants) | ||||||||
| - | ||||||||
| - | ||||||||
| - | ||||||||
| 1 | ||||||||
| - | ||||||||
| - | ||||||||
| 2 (+) | ||||||||
| Preoperative medication use (Serotonin–norepinephrine reuptake inhibitor (SNRIs)) | ||||||||
| - | ||||||||
| - | ||||||||
| - | ||||||||
| - | ||||||||
| 1 | ||||||||
| - | ||||||||
| 2 (+) | ||||||||
| Preoperative medication use (Tricyclic antidepressants (TCAs)) | ||||||||
| - | ||||||||
| - | ||||||||
| - | ||||||||
| - | ||||||||
| 1 | ||||||||
| - | ||||||||
| 2 (+) | ||||||||
| Preoperative medication use (sedatives) | ||||||||
| - | ||||||||
| - | ||||||||
| - | ||||||||
| - | ||||||||
| 1 | ||||||||
| - | ||||||||
| 2 (+) | ||||||||
| Wound class | ||||||||
| 1 | ||||||||
| - | ||||||||
| - | ||||||||
| - | ||||||||
| 2 | ||||||||
| - | ||||||||
| 4 (+++) | ||||||||
Overall quality: + very low quality = very little confidence in the effect estimate: true effect likely to be substantially different from the estimate of effect; ++ low quality = confidence in the effect estimate is limited: the true effect may be substantially different from the estimate of the study; +++ moderate quality = moderately confident in the effect estimate: true effect is likely to be close to the estimate of the effect, but there is a possibility that it is substantially different; ++++ high quality = very confident that the true effect lies close to that of the estimate of the effect.
Table 5.
3.4. Synthesis of Evidence
Table 4, Table 5 and Table 6, and Supplementary File 1 (Tables S8, S16–S18), present the findings for every risk factor identified in the included studies, including high, moderate, low, and very low-quality evidence. A summary of the high and moderate quality evidence for risk factors that correlated with readmission are presented. Forest plots for all meta-analyses are available (Supplementary File 1, Section S19).
3.4.1. Comorbidities
On meta-analysis, risk factors associated with 30-day readmission were: arrhythmias (including atrial fibrillation), anaemia, deficiency anaemias, peripheral vascular disease, liver disease, and coagulopathy. On narrative synthesis, risk factors associated with 30-day readmission were: hypertension, congestive heart failure (CHF), diabetes, elevated preoperative international normalised ratio (INR), elevated serum blood urea nitrogen (BUN), reduced serum albumin, depression, drug abuse, history of cancer, and chronic kidney disease (CKD). On narrative synthesis, increasing comorbidity burden as indicated by Charlson Comorbidity Index, Elishauser Index, and Diagnosis-Related Group roughly correlated with increased readmission risk. This relationship was not observed strongly for American College of Anaesthesiologists (ASA) Classification.
Body mass index (BMI) was categorised in different ways in various studies, but on meta-analysis none of these categories were correlated with readmission. Similarly, when BMI was presented as a continuous variable it did not consistently correlate with readmission. However, when presented in categories, both obesity and morbid obesity did correlate with readmission both on meta-analysis and on narrative synthesis. Note that obesity categories were not clearly defined in these studies which used the labels ‘obesity’ or ‘morbid obesity’. It is possible that these terms were defined in line with the definitions given by the World Health Organization[98], but this was not stated.
3.4.2. Demographics
Supplementary File 1 (Tables S9–S13). When age was analysed as a continuous variable three of seven studies found that older age correlated with readmission risk, one study found that younger age correlated with increased risk and the remaining three studies found no correlation.
3.4.3. Other
Risk factors correlated with increased readmission risk were: male sex, Black race, decreasing income, low socioeconomic status, Medicare insurance (US-based cohort, private insurance as the reference category), dependent functional status, and frailty. Asian race was protective against readmission.
3.4.3. Other
Patients who underwent elective surgery were less likely to be readmitted than those who underwent urgent surgery, providing the best-available estimation of the impact of the urgency of the patient’s condition on readmission risk. A higher number of previous hospital admissions was correlated with increased readmission risk, whereas a higher number of prior knee procedures was protective against readmission.
The following in-hospital complications that occurred during the index admission, were strongly correlated with readmission risk: any complication (combined category), any medical complication, any surgical complication, urinary tract infection (UTI), surgical site infection (SSI), cardiac complication, pneumonia, acute renal failure. The correlation between in-hospital complication and subsequent risk of 30-day readmission was stronger than for any other variable.
3.4.4. Revision-Only Cohorts
Supplementary File 1, Table S8). Similar to that of the primary TKA studies, in-hospital complications were strongly correlated with readmission after discharge after revision TKA. Of interest, Belmont et al. 2016[69] and Courtney et al. 2018[72] reported contrasting findings with respect to the impact of sex on readmission risk, with the former reporting increased risk due to female sex and the latter reporting increased risk due to male sex. Both studies analysed the NSQIP cohort, with Courtney analysing the data from 2012–2016 and Belmont analysing the data from 2011–2012. Unique to this population, revision for infectious aetiology correlated with higher rates of readmission than revision for other indications.
3.4.5. Different Types of Readmission
The focus of this review is on 30-day readmission due to any cause, so the main summary of findings tables comprise studies that analysed all-cause readmission. Three of these studies additionally analysed readmission due to specific causes: D’Apuzzo et al. 2017 [54], Ali et al. 2019 [42], and Rudasil et al. 2019[89] [89]. An in-depth discussion of the differences between risk factor profiles for each of these outcomes is given in the full text articles. One other study, Anthony et al. 2018[47] [47], did not analyse all-cause readmission, instead focusing on readmission due to surgical site infection only. On multivariate logistic regression analysis (OR (95% confidence interval)), risk factors found to be associated with risk of readmission were: age 18–30 (reference category <18: 0.114 (0.02–0.63)), female sex (0.559 (0.53–0.59)), private insurance and Medicaid (reference category Medicare: 0.679 (0.63–0.73) and 1.489 (1.32–1.68), respectively), hypertension (1.189 (1.11–1.27)), obesity (1.182 (1.11–1.26)), and diabetes (1.122 (1.05–1.2)). The results for each of these studies are available in Supplementary File 1 (Tables S12 and S13).
References
- Ethgen, O.; Bruyere, O.; Richy, F.; Dardennes, C.; Reginster, J.Y. Health-related quality of life in total hip and total knee arthroplasty. A qualitative and systematic review of the literature. J. Bone Joint Surg. Am. Vol. 2004, 86-a, 963-974.
- Association, A.O. Annual Report 2017; Australian Orthopaedic Association - South Australian Health and Medical Research Institute; Adelaide, Australia, 2017.
- Kurtz, S.; Ong, K.; Lau, E.; Mowat, F.; Halpern, M. Projections of primary and revision hip and knee arthroplasty in the United States from 2005 to 2030. J. Bone Joint Surg. Am. Vol. 2007, 89, 780–785, doi:10.2106/jbjs.F.00222.
- Rucco, V.; Zanetti, R.; Colonnello, V. Complications after total knee arthroplasty. Eur. J. Phys. Rehabil. Med. 2001, 37, 115.
- Ramkumar, P.N.; Chu, C.; Harris, J.; Athiviraham, A.; Harrington, M.; White, D.; Berger, D.; Naik, A.; Li, L. Causes and rates of unplanned readmissions after elective primary total joint arthroplasty: A systematic review and meta-analysis. Am. J. Orthop. 2015, 44, 397–405.
- Schairer, W.W.; Vail, T.P.; Bozic, K.J. What are the rates and causes of hospital readmission after total knee arthroplasty? Knee. Clin. Orthop. Relat. Res. 2014, 472, 181–187.
- Fischer, C.; Lingsma, H.F.; Marang-van de Mheen, P.J.; Kringos, D.S.; Klazinga, N.S.; Steyerberg, E.W. Is the readmission rate a valid quality indicator? A review of the evidence. PLoS ONE 2014, 9, e112282, doi:10.1371/journal.pone.0112282.
- Joynt, K.E.; Jha, A.K. Thirty-day readmissions--truth and consequences. New Engl. J. Med. 2012, 366, 1366–1369, doi:10.1056/NEJMp1201598.
- Fonarow, G.C. Unintended Harm Associated With the Hospital Readmissions Reduction Program. Jama 2018, 320, 2539–2541, doi:10.1001/jama.2018.19325.
- Hamar, G.B.; Coberley, C.; Pope, J.E.; Cottrill, A.; Verrall, S.; Larkin, S.; Rula, E.Y. Effect of post-hospital discharge telephonic intervention on hospital readmissions in a privately insured population in Australia. Aust. Health Rev. 2018, 42, 241–247.
- ACSQHC. Avoidable Hospital Readmissions: Report on Australian and International Indicators, Their Use and the Efficacy of Interventions to Reduce Readmissions; Australian Commission on Safety and Quality in Health Care: Sydney, Australia, 2019.
- McIlvennan, C.K.; Eapen, Z.J.; Allen, L.A. Hospital readmissions reduction program. Circulation 2015, 131, 1796–1803, doi:10.1161/circulationaha.114.010270.
- Ramaswamy, A.; Marchese, M.; Cole, A.P.; Harmouch, S.; Friedlander, D.; Weissman, J.S.; Lipsitz, S.R.; Haider, A.H.; Kibel, A.S.; Schoenfeld, A.J.; et al. Comparison of Hospital Readmission After Total Hip and Total Knee Arthroplasty vs Spinal Surgery After Implementation of the Hospital Readmissions Reduction Program. JAMA Network Open 2019, 2, e194634.
- Tilbury, C.; Haanstra, T.M.; Leichtenberg, C.S.; Verdegaal, S.H.; Ostelo, R.W.; de Vet, H.C.; Nelissen, R.G.; Vliet Vlieland, T.P. Unfulfilled Expectations After Total Hip and Knee Arthroplasty Surgery: There Is a Need for Better Preoperative Patient Information and Education. J. Arthroplast. 2016, 31, 2139–2145, doi:10.1016/j.arth.2016.02.061.
- Gould, D.; Dowsey, M.; Jo, I.; Choong, P. Patient-related risk factors for unplanned 30-day readmission following total knee arthroplasty: A narrative literature review. ANZ J. Surg. 2020, 22, 22.
- Culliford, D.; Maskell, J.; Judge, A.; Cooper, C.; Prieto-Alhambra, D.; Arden, N.K. Future projections of total hip and knee arthroplasty in the UK: Results from the UK Clinical Practice Research Datalink. Osteoarthr. Cartil. 2015, 23, 594–600, doi:10.1016/j.joca.2014.12.022.
- Ravi, B.; Croxford, R.; Reichmann, W.M.; Losina, E.; Katz, J.N.; Hawker, G.A. The changing demographics of total joint arthroplasty recipients in the United States and Ontario from 2001 to 2007. Best Pract. Res. Clin. Rheumatol. 2012, 26, 637–647, doi:10.1016/j.berh.2012.07.014.
- Goudie, E.B.; Robinson, C.; Walmsley, P.; Brenkel, I. Changing trends in total knee replacement. Eur. J. Orthop. Surg. Traumatol. 2017, 27, 539–544, doi:10.1007/s00590-017-1934-8.
- Huguet, A.; Hayden, J.A.; Stinson, J.; McGrath, P.J.; Chambers, C.T.; Tougas, M.E.; Wozney, L. Judging the quality of evidence in reviews of prognostic factor research: Adapting the GRADE framework. Syst. Rev. 2013, 2, 71.
- Gould, D.; Dowsey, M.; Spelman, T.; Jo, I.; Kabir, W.; Trieu, J.; Choong, P. Patient-related risk factors for unplanned 30-day readmission following total knee arthroplasty: A protocol for a systematic review and meta-analysis. Syst. Rev. 2019, 8, 215, doi:10.1186/s13643-019-1140-3.
- Moher, D.; Liberati, A.; Tetzlaff, J.; Altman, D.G.; Group, P. Preferred reporting items for systematic reviews and meta-analyses: The PRISMA statement. PLoS Med. 2009, 6, e1000097.
- Schardt, C.; Adams, M.B.; Owens, T.; Keitz, S.; Fontelo, P. Utilization of the PICO framework to improve searching PubMed for clinical questions. BMC Med. Inform. Decis. Mak. 2007, 7, 16.
- Pugely, A.J.; Callaghan, J.J.; Martin, C.T.; Cram, P.; Gao, Y. Incidence of and risk factors for 30-day readmission following elective primary total joint arthroplasty: Analysis from the ACS-NSQIP. J. Arthroplast. 2013, 28, 1499–1504, doi:10.1016/j.arth.2013.06.032.
- Viera, A. Odds ratios and risk ratios: what’s the difference and why does it matter? South. Med. J. 2008, 101, 730–734.
- Moola, S.; MZTufanaru, C.; Aromataris, E.; Sears, K.; Sfetcu, R.; Currie, M.; Lisy, K.; Qureshi, R.; Mattis, P.; Mu, P. Chapter 7: Systematic reviews of etiology and risk. In Joanna Briggs Institute Reviewer's Manual; The Joanna Briggs Institute: Adelaide, Australia, 2017.
- Goplen, C.M.; Verbeek, W.; Kang, S.H.; Jones, C.A.; Voaklander, D.C.; Churchill, T.A.; Beaupre, L.A. Preoperative opioid use is associated with worse patient outcomes after total joint arthroplasty: A systematic review and meta-analysis. BMC Musculoskelet. Disord. 2019, 20, 234.
- Detweiler, B.; Kollmorgen, L.; Umberham, B.; Hedin, R.; Vassar, B. Risk of bias and methodological appraisal practices in systematic reviews published in anaesthetic journals: A meta‐epidemiological study. Anaesthesia 2016, 71, 955–968.
- Hanly, R.J.; Marvi, S.K.; Whitehouse, S.L.; Crawford, R.W. Morbid Obesity in Total Knee Arthroplasty: Joint-Specific Variance in Outcomes for Operative Time, Length of Stay, and Readmission. J. Arthroplast. 2017, 32, 2712–2716.
- Abdulla, I.; Mahdavi, S.; Khong, H.; Gill, R.; Powell, J.; Johnston, K.D.; Sharma, R. Does body mass index affect the rate of adverse outcomes in total hip and knee arthroplasty? A retrospective review of a total joint replacement database. Can. J. Surg. 2020, 63, E142–E149.
- Ross, T.D.; Dvorani, E.; Saskin, R.; Khoshbin, A.; Atrey, A.; Ward, S.E. Temporal Trends and Predictors of Thirty-Day Readmissions and Emergency Department Visits Following Total Knee Arthroplasty in Ontario Between 2003 and 2016. J. Arthroplast. 2020, 35, 364–370.
- Peskun, C.; Mayne, I.; Malempati, H.; Kosashvili, Y.; Gross, A.; Backstein, D. Cardiovascular disease predicts complications following bilateral total knee arthroplasty under a single anesthetic. Knee 2012, 19, 580–584.
- Buitrago, G.; Ortiz, J.R.; Camacho, F. Clinical Outcomes, Health Care Costs and Prognostic Factors for Total Knee Arthroplasty: A Multilevel Analysis of a National Cohort Study Using Administrative Claims Data. J. Knee Surg. 2020, 24, 24.
- Jorgensen, C.C.; Kehlet, H.; Lundbeck Foundation Centre for Fast-track, H.; Knee Replacement Collaborative, G. Outcomes in smokers and alcohol users after fast-track hip and knee arthroplasty. Acta Anaesthesiol. Scand. 2013, 57, 631–638.
- Jørgensen, C.C.; Pitter, F.T.; Kehlet, H. Safety aspects of preoperative high-dose glucocorticoid in primary total knee replacement. Br. J. Anaesth. 2017, 119, 267–275.
- Tang, H.; Li, H.; Zhang, S.; Wang, Y.; Qu, X.; Yue, B. Postoperative Complications Causing Readmission in 30 Days after Total Knee Arthroplasty: A Retrospective Nested Case-Control Study of Risk Factors Based on Propensity Score Matching. J. Knee Surg. 2019, 29, 29.
- Tay, K.S.; Cher, E.W.L.; Zhang, K.; Tan, S.B.; Howe, T.S.; Koh, J.S.B. Comorbidities Have a Greater Impact Than Age Alone in the Outcomes of Octogenarian Total Knee Arthroplasty. J. Arthroplast. 2017, 32, 3373–3378.
- Liao, K.M.; Lu, H.Y. Complications after total knee replacement in patients with chronic obstructive pulmonary disease: A nationwide case-control study. Medicine 2016, 95, e4835.
- Kuo, F.C.; Lin, P.C.; Lu, Y.D.; Lee, M.S.; Wang, J.W. Chronic Kidney Disease Is an Independent Risk Factor for Transfusion, Cardiovascular Complication, and Thirty-Day Readmission in Minimally Invasive Total Knee Arthroplasty. J. Arthroplast. 2017, 32, 1630–1634.
- Ali, A.M.; Loeffler, M.D.; Aylin, P.; Bottle, A. Predictors of 30-Day Readmission After Total Knee Arthroplasty: Analysis of 566,323 Procedures in the United Kingdom. J. Arthroplast. 2019, 34, 242–248.e241, .
- Schwarzer, G. meta: An R package for meta-analysis. R News 2007, 7, 40–45.
- Wickham, H.; Wickham, M.H. Package tidyverse. In Easily Install and Load the ‘Tidyverse; World Health Organization; Geneva, Switzerland, 2017.
- Miric, A.; Inacio, M.C.S.; Kelly, M.P.; Namba, R.S. Can Total Knee Arthroplasty Be Safely Performed Among Nonagenarians? An Evaluation of Morbidity and Mortality Within a Total Joint Replacement Registry. J. Arthroplast. 2014, 29, 1635–1638.
- Welsh, R.L.; Graham, J.E.; Karmarkar, A.M.; Leland, N.E.; Baillargeon, J.G.; Wild, D.L.; Ottenbacher, K.J. Effects of Postacute Settings on Readmission Rates and Reasons for Readmission Following Total Knee Arthroplasty. J. Am. Med. Dir. Assoc. 2017, 18, 367.e361–367.e310.
- Kim, S.C.; Jin, Y.; Lee, Y.C.; Lii, J.; Franklin, P.D.; Solomon, D.H.; Franklin, J.M.; Katz, J.N.; Desai, R.J. Association of Preoperative Opioid Use With Mortality and Short-term Safety Outcomes After Total Knee Replacement. JAMA Netw. Open 2019, 2, e198061.
- Kurtz, S.M.; Lau, E.C.; Ong, K.L.; Adler, E.M.; Kolisek, F.R.; Manley, M.T. Which Hospital and Clinical Factors Drive 30- and 90-Day Readmission After TKA? J. Arthroplast. 2016, 31, 2099–2107.
- Anthony, C.A.; Peterson, R.A.; Sewell, D.K.; Polgreen, L.A.; Simmering, J.E.; Callaghan, J.J.; Polgreen, P.M. The Seasonal Variability of Surgical Site Infections in Knee and Hip Arthroplasty. J. Arthroplast. 2018, 33, 510–514.e511.
- Urish, K.L.; Qin, Y.; Li, B.Y.; Borza, T.; Sessine, M.; Kirk, P.; Hollenbeck, B.K.; Helm, J.E.; Lavieri, M.S.; Skolarus, T.A.; et al. Predictors and Cost of Readmission in Total Knee Arthroplasty. J. Arthroplast. 2018, 33, 2759–2763.
- Sodhi, N.; Mont, M.A.; Cleveland Clinic Orthopaedic, A. Does Patient Experience After a Total Knee Arthroplasty Predict Readmission? J. Arthroplast. 2019, 34, 2573–2579.
- Singh, J.A.; Kwoh, C.K.; Richardson, D.; Chen, W.; Ibrahim, S.A. Sex and surgical outcomes and mortality after primary total knee arthroplasty: A risk-adjusted analysis. Arthritis Care Res. 2013, 65, 1095–1102.
- Arroyo, N.S.; White, R.S.; Gaber-Baylis, L.K.; La, M.; Fisher, A.D.; Samaru, M. Racial/ethnic and socioeconomic disparities in total knee arthroplasty 30-and 90-day readmissions: A multi-payer and multistate analysis, 2007–2014. Popul. Health Manag. 2019, 22, 175–185.
- Bullock, D.P.; Sporer, S.M.; Shirreffs, T.G., Jr. Comparison of simultaneous bilateral with unilateral total knee arthroplasty in terms of perioperative complications. J. Bone Jt. Surg. Am. Vol. 2003, 85-A, 1981–1986.
- Charette, R.S.; Sloan, M.; DeAngelis, R.D.; Lee, G.C. Higher Rate of Early Revision Following Primary Total Knee Arthroplasty in Patients Under Age 55: A Cautionary Tale. J. Arthroplast. 2019, 10.1016/j.arth.2019.06.060, doi:10.1016/j.arth.2019.06.060.
- D'Apuzzo, M.; Westrich, G.; Hidaka, C.; Jung Pan, T.; Lyman, S. All-Cause Versus Complication-Specific Readmission Following Total Knee Arthroplasty. J. Bone Jt. Surg. Am. Vol. 2017, 99, 1093–1103.
- Keeney, J.A.; Nam, D.; Johnson, S.R.; Nunley, R.M.; Clohisy, J.C.; Barrack, R.L. Socioeconomically Disadvantaged CMS Beneficiaries Do Not Benefit From the Readmission Reduction Initiatives. J. Arthroplast. 2015, 30, 2082–2085.
- Ramos, N.L.; Karia, R.J.; Hutzler, L.H.; Brandt, A.M.; Slover, J.D.; Bosco, J.A.J.T.J.o.a. The effect of discharge disposition on 30-day readmission rates after total joint arthroplasty. 2014, 29, 674–677.
- Ricciardi, B.F.; Oi, K.K.; Daines, S.B.; Lee, Y.Y.; Joseph, A.D.; Westrich, G.H. Patient and Perioperative Variables Affecting 30-Day Readmission for Surgical Complications After Hip and Knee Arthroplasties: A Matched Cohort Study. J. Arthroplast. 2017, 32, 1074–1079.
- Saucedo, J.M.; Marecek, G.S.; Wanke, T.R.; Lee, J.; Stulberg, S.D.; Puri, L. Understanding readmission after primary total hip and knee arthroplasty: who's at risk? J. Arthroplast. 2014, 29, 256–260.
- Schaeffer, J.F.; Scott, D.J.; Godin, J.A.; Attarian, D.E.; Wellman, S.S.; Mather, R.C., III. The association of ASA class on total knee and total hip arthroplasty readmission rates in an academic hospital. J. Arthroplast. 2015, 30, 723–727.
- Workman, K.K.; Angerett, N.; Lippe, R.; Shin, A.; King, S. Thirty-Day Unplanned Readmission after Total Knee Arthroplasty at a Teaching Community Hospital: Rates, Reasons, and Risk Factors. J. Knee Surg. 2019, 10, 10.
- Siracuse, B.L.; Ippolito, J.A.; Gibson, P.D.; Ohman-Strickland, P.A.; Beebe, K.S. A Preoperative Scale for Determining Surgical Readmission Risk After Total Knee Arthroplasty. J. Bone Jt. Surg. Am. Vol. 2017, 99, e112.
- Weick, J.; Bawa, H.; Dirschl, D.R.; Luu, H.H. Preoperative opioid use is associated with higher readmission and revision rates in total knee and total hip arthroplasty. J. Bone Jt. Surg. Am. Vol. 2018, 100, 1171–1176.
- Kheir, M.M.; Clement, R.C.; Derman, P.B.; Flynn, D.N.; Speck, R.M.; Levin, L.S.; Fleisher, L.A. Are there identifiable risk factors and causes associated with unplanned readmissions following total knee arthroplasty? J. Arthroplast. 2014, 29, 2192–2196.
- Anderson, B.J.; Liu, M.; Cui, X.; Stevens, M.; Arensman, M.A. Adverse Outcomes Associated With Inpatient Administration of Beers List Medications Following Total Knee Replacement. Clin. Ther. 2020, 42, 592–604.e1.
- Mudumbai, S.C.; Chung, P.; Nguyen, N.; Harris, B.; Clark, J.D.; Wagner, T.H.; Giori, N.J.; Stafford, R.S.; Mariano, E.R. Perioperative Opioid Prescribing Patterns and Readmissions After Total Knee Arthroplasty in a National Cohort of Veterans Health Administration Patients. Pain Med. 2019, 21, 595–603.
- Abola, M.V.; Tanenbaum, J.E.; Bomberger, T.T.; Knapik, D.M.; Fitzgerald, S.J.; Wera, G.D. Preoperative Hyponatremia Is Associated with Reoperation and Prolonged Length of Hospital Stay following Total Knee Arthroplasty. J. Knee Surg. 2018, 4, 4, doi:10.1055/s-0038-1641156.
- Alvi, H.M.; Mednick, R.E.; Krishnan, V.; Kwasny, M.J.; Beal, M.D.; Manning, D.W. The Effect of BMI on 30 Day Outcomes Following Total Joint Arthroplasty. J. Arthroplast. 2015, 30, 1113–1117.
- Antoniak, D.T.; Benes, B.J.; Hartman, C.W.; Vokoun, C.W.; Samson, K.K.; Shiffermiller, J.F. Impact of Chronic Kidney Disease in Older Adults Undergoing Hip or Knee Arthroplasty: A Large Database Study. J. Arthroplast.2020, 35, 1214–1221.e5.
- Belmont, P.J., Jr.; Goodman, G.P.; Rodriguez, M.; Bader, J.O.; Waterman, B.R.; Schoenfeld, A.J. Predictors of hospital readmission following revision total knee arthroplasty. Knee Surg. Sports Traumatol. Arthrosc. 2016, 24, 3329–3338.
- Bovonratwet, P.; Tyagi, V.; Ottesen, T.D.; Ondeck, N.T.; Rubin, L.E.; Grauer, J.N. Revision Total Knee Arthroplasty in Octogenarians: An Analysis of 957 Cases. J. Arthroplast. 2018, 33, 178–184.
- Bovonratwet, P.; Fu, M.C.; Tyagi, V.; Gu, A.; Sculco, P.K.; Grauer, J.N. Is Discharge Within a Day of Total Knee Arthroplasty Safe in the Octogenarian Population? J. Arthroplast. 2019, 34, 235–241.
- Bovonratwet, P.; Shen, T.S.; Ast, M.P.; Mayman, D.J.; Haas, S.B.; Su, E.P. Reasons and Risk Factors for 30-Day Readmission After Outpatient Total Knee Arthroplasty: A Review of 3015 Cases. J. Arthroplast. 2020, 35, 2451–2457.
- Courtney, P.M.; Boniello, A.J.; Della Valle, C.J.; Lee, G.C. Risk Adjustment Is Necessary in Value-based Outcomes Models for Infected TKA. Clin. Orthop. 2018, 476, 1940–1948.
- Curtis, G.L.; Chughtai, M.; Khlopas, A.; Newman, J.M.; Sultan, A.A.; Sodhi, N.; Barsoum, W.K.; Higuera, C.A.; Mont, M.A. Perioperative Outcomes and Short-Term Complications Following Total Knee Arthroplasty in Chronically, Immunosuppressed Patients. Surg. Technol. Int. 2018, 32, 263–269.
- Curtis, G.; Hammad, A.; Anis, H.K.; Sodhi, N.; Ehiorobo, J.O.; Higuera, C.A.; Little, B.E.; Mont, M.A.; Darwiche, H.F. Preoperative Functional Status Predicts Increased Morbidity Following Total Knee Arthroplasty. Surg. Technol. Int. 2019, 34, 1.
- George, J.; Piuzzi, N.S.; Ng, M.; Sodhi, N.; Khlopas, A.A.; Mont, M.A. Association Between Body Mass Index and Thirty-Day Complications After Total Knee Arthroplasty. J. Arthroplast. 2018, 33, 865–871.
- Gwam, C.U.; Sultan, A.; Rosas, S.; Sullivan, R.; Seem, M.; Ohanale, C.; Plate, J.F. Dialysis Is Not Associated with Increased Risk of Perioperative Complications in TKA Patients after Adjusting for Pertinent Confounders. J. Knee Surg. 2020, 33, 745–749.
- Hart, A.; Antoniou, J.; Brin, Y.S.; Huk, O.L.; Zukor, D.J.; Bergeron, S.G.; Information, P.E.K.F.C. Simultaneous Bilateral Versus Unilateral Total Knee Arthroplasty: A Comparison of 30-Day Readmission Rates and Major Complications. J. Arthroplast. 2016, 31, 31–35.
- Jauregui, J.J.; Cherian, J.J.; Pierce, T.P.; Elmallah, R.K.; Mont, M.A. Thirty-Day Readmission Rates Comparing Specific Cruciate Retaining and Posterior Stabilizing Knee Arthroplasties to the National Readmission Rates. J. Autom. Inf. Sci. 2015, 25, 307–311.
- Kester, B.S.; Minhas, S.V.; Vigdorchik, J.M.; Schwarzkopf, R. Total Knee Arthroplasty for Posttraumatic Osteoarthritis: Is it Time for a New Classification? J. Arthroplast. 2016, 31, 1649–1653.e1641.
- Lehtonen, E.J.; Hess, M.C.; McGwin, G., Jr.; Shah, A.; Godoy-Santos, A.L.; Naranje, S. Risk Factors for Early Hospital Readmission Following Total Knee Arthroplasty. Acta Ortop 2018, 26, 309–313.
- Lovecchio, F.; Beal, M.; Kwasny, M.; Manning, D. Do patients with insulin-dependent and noninsulin-dependent diabetes have different risks for complications after arthroplasty? Clin. Orthop. Relat. Res. 2014, 472, 3570–3575, doi:10.1007/s11999-014-3891-4.
- Nowak, L.L.; Schemitsch, E.H. Same-day and delayed hospital discharge are associated with worse outcomes following total knee arthroplasty. Bone Jt. J. 2019, 101-B, 70-76.
- Ottesen, T.D.; Zogg, C.K.; Haynes, M.S.; Malpani, R.; Bellamkonda, K.S.; Grauer, J.N. Dialysis Patients Undergoing Total Knee Arthroplasty Have Significantly Increased Odds of Perioperative Adverse Events Independent of Demographic and Comorbidity Factors. J. Arthroplast. 2018, 33, 2827–2834.
- Patel, A.P.; Gronbeck, C.; Chambers, M.; Harrington, M.A.; Halawi, M.J. Gender and Total Joint Arthroplasty: Variable Outcomes by Procedure Type. Arthroplast. Today 2020, 6, 517–520.
- Patterson, J.T.; Tillinghast, K.; Ward, D. Dialysis Dependence Predicts Complications, Intensive Care Unit Care, Length of Stay, and Skilled Nursing Needs in Elective Primary Total Knee and Hip Arthroplasty. J. Arthroplast. 2018, 33, 2263–2267.
- Robinson, J.; Shin, J.I.; Dowdell, J.E.; Moucha, C.S.; Chen, D.D. Impact of Gender on 30-Day Complications After Primary Total Joint Arthroplasty. J. Arthroplast. 2017, 32, 2370–2374, doi:10.1016/j.arth.2017.03.001.
- Roth, A.; Khlopas, A.; George, J.; Churchill, J.L.; Molloy, R.; Mont, M.A.; Piuzzi, N.S.; Higuera, C.A. The Effect of Body Mass Index on 30-day Complications After Revision Total Hip and Knee Arthroplasty. J. Arthroplast. 2019, doi:10.1016/j.arth.2019.02.005.
- Rudasill, S.E.; Liu, J.; Kamath, A.F. Revisiting the International Normalized Ratio (INR) Threshold for Complications in Primary Total Knee Arthroplasty: An Analysis of 21,239 Cases. J. Bone Jt. Surg. Am. Vol. 2019, 101, 514–522.
- Runner, R.P.; Bellamy, J.L.; Vu, C.C.L.; Erens, G.A.; Schenker, M.L.; Guild, G.N., 3rd. Modified Frailty Index Is an Effective Risk Assessment Tool in Primary Total Knee Arthroplasty. J. Arthroplast. 2017, 32, S177–S182.
- Sloan, M.; Sheth, N.P.; Nelson, C.L. Obesity and hypoalbuminaemia are independent risk factors for readmission and reoperation following primary total knee arthroplasty. Bone Jt. J. 2020, 102-B, 31–35.
- Sodhi, N.; Anis, H.K.; Coste, M.; Ehiorobo, J.O.; Chee, A.; Freund, B.; Sultan, A.A.; Moskal, J.T.; Scuderi, G.R.; Mont, M.A. A Nationwide Analysis of Preoperative Planning on Operative Times and Postoperative Complications in Total Knee Arthroplasty. J. Knee Surg. 2019, 32, 1040–1045.
- Suleiman, L.I.; Edelstein, A.I.; Thompson, R.M.; Alvi, H.M.; Kwasny, M.J.; Manning, D.W. Perioperative Outcomes Following Unilateral Versus Bilateral Total Knee Arthroplasty. J. Arthroplast. 2015, 30, 1927–1930.
- Sutton, J.C.; Antoniou, J.; Epure, L.M.; Huk, O.L.; Zukor, D.J.; Bergeron, S.G. Hospital Discharge within 2 Days Following Total Hip or Knee Arthroplasty Does Not Increase Major-Complication and Readmission Rates. J. Bone Jt. Surg. Am. Vol. 2016, 98, 1419–1428.
- Webb, M.L.; Golinvaux, N.S.; Ibe, I.K.; Bovonratwet, P.; Ellman, M.S.; Grauer, J.N. Comparison of Perioperative Adverse Event Rates After Total Knee Arthroplasty in Patients With Diabetes: Insulin Dependence Makes a Difference. J. Arthroplast. 2017, 32, 2947–2951.
- Yohe, N.; Funk, A.; Ciminero, M.; Erez, O.; Saleh, A. Complications and Readmissions After Total Knee Replacement in Octogenarians and Nonagenarians. Geriatr 2018, 9, 2151459318804113.
- Zusmanovich, M.; Kester, B.S.; Schwarzkopf, R. Postoperative Complications of Total Joint Arthroplasty in Obese Patients Stratified by BMI. J. Arthroplast. 2018, 33, 856–864.
- Sterne, J.A.C.; Sutton, A.J.; Ioannidis, J.P.A.; Terrin, N.; Jones, D.R.; Lau, J.; Carpenter, J.; Rücker, G.; Harbord, R.M.; Schmid, C.H.; et al. Recommendations for examining and interpreting funnel plot asymmetry in meta-analyses of randomised controlled trials. BMJ 2011, 343, d4002.
- Organization, W.H. Obesity: Preventing and Managing the Global Epidemic; World Health Organization: Geneva, Switzerland, 2000.
- Organization, W.H. Obesity: Preventing and Managing the Global Epidemic; World Health Organization: Geneva, Switzerland, 2000.