Large-scale food fortification is an effective, sustainable, and scalable intervention to address vitamin and mineral deficiencies, however, pressing gaps exist globally around ensuring the quality of fortified foods. This paper summarizes the global challenges and gaps faced in monitoring the quality of fortified foods, the guidance produced in response to these challenges, where we are today in terms of effective implementation, and what approaches and opportunities may be usefully applied to enhance the quality of fortified foods moving forward.
- fortification
- micronutrients
- micronutrient deficiency
- large-scale food fortification
- monitoring
- regulatory monitoring
- compliance
- fortification quality
- premix reconciliation calculation
1. Introduction
Nutritionally adequate diets continue to be threatened in many parts of the world, including in low-, middle-, and high-income settings. This is due to a myriad of factors, including food systems that do not contain nutritious foods; limited purchasing power of individuals and families to purchase nutritious foods; limited access to nutritious foods and markets [1]; and that food systems don’t make nutritious foods convenient or desirable. These limitations can result in significant deficiencies in essential vitamins and minerals such as iron, folic acid, zinc, vitamin A, and iodine, among others, and have devastating and often irreversible consequences for individual health and national economies [2][3][2,3].
The fortification of food with vitamins and minerals is widely recognized as a cost-effective and sustainable strategy to improve the nutritional health status of populations [4][5][6] [4,5,6] and is a unique health intervention, in that it leverages the expertise and delivery platform of the private food sector, relieving often overburdened healthcare systems. As a result, fortification has the potential to reach very large portions of the population and is an important complement to other nutrition-specific and nutrition-sensitive interventions.
There is strong evidence that food fortification has led to significant positive impacts on nutritional status [7]. A recent systematic review and meta-analysis of large-scale food fortification programs found that, when implemented population-wide, these programs were associated with a 34% reduction in anemia from improved iron stores, a 74% reduction in the odds of goiter due to increased iodine intake, and a 41% reduction in the odds of neural tube defects (NTDs) as a result of increased folate intake [8].
Despite these successes however, food fortification programs, globally, are at risk of not reaching their full potential [9]. Although there are numerous reasons why this is the case, from countries that could benefit from fortification that do not have programs in place to existing programs that are designed, implemented, and operated sub-optimally [9][10][11][12][9,10,11,12], a significant roadblock to effective programming has proven to be collecting and acting upon national fortification monitoring information. Obtaining data (and ensuring that data is of good quality) on whether or not foods are actually fortified according to a country’s national fortification standard (that is whether or not they contain the designated amount of vitamins and minerals) and, subsequently, taking action based on that data to limit the number of non-fortified or under fortified products on the market, has proven to be a near universal challenge for countries implementing large-scale fortification programs [13][14][15][13,14,15].
2. Background on Regulatory Monitoring and Compliance of Food Fortification Programs
Regulatory monitoring of fortified food, in the context of mandatory fortification programs, requires tracking indicators, such as the quality and quantity of fortified food produced and imported over time, to ensure programs stay on track to achieve the desired aim of increasing the intake of essential vitamins and minerals in a population [14]. Regulatory monitoring is the primary means by which compliance with food standards, including fortification standards, is determined [16][17][16,17]. Regulatory monitoring of fortified foods can take place at four different levels:
For wheat flour fortification, 5 countries (Australia, Brazil, Chile, Mexico, and Peru) have “industry compliance data”. Liberia [21] [21] and Senegal [22] also have industry compliance data for wheat flour obtained from authorized government entities, but are not included in the GFDx. Ten countries (Afghanistan, Brazil, Burkina Faso, Indonesia, Kazakhstan, Malawi, Nepal, South Africa, Tanzania, and Uganda) have “market and HH data” while 81 countries have data as reported by “expert opinion”.
For maize flour, 2 countries (Brazil and Mexico) have “industry compliance data”, 5 countries (Malawi, Mexico, South Africa, Tanzania, Uganda) have “market or HH data”, and 16 countries (Brazil, Burundi, Costa Rica, El Salvador, Guatemala, Kenya, Malawi, Mozambique, Nigeria, Rwanda, South Africa, Tanzania, Uganda, United States, Venezuela, and Zimbabwe) have “expert opinion” data.
For cooking oil, no countries have data obtained from “industry compliance data” or “expert opinion”. Nine countries (Bangladesh, Burkina Faso, Liberia, Malawi, Mozambique, Nigeria, Pakistan, Tanzania, and Uganda) have “market or HH data”.
For rice, no countries have “industry compliance”, one country has “market or HH data” (Papua New Guinea) and 6 countries have “expert opinion” data (Costa Rica, Nicaragua, Panama, Philippines, Solomon Islands, and the United States).
For salt, 7 countries have “industry compliance data” (Bangladesh, Colombia, Nigeria, Peru, Thailand, Uganda, and Uzbekistan), 23 countries have “market or HH data” (Afghanistan, Bosnia and Herzegovina, Burkina Faso, Cambodia, Eswatini, Ethiopia, Georgia, Indonesia, Kazakhstan, Kenya, Lao PDR, Lebanon, Liberia, Malawi, Morocco, Nepal, Papua New Guinea, Tajikistan, Tanzania, Tunisia, Uganda, Uzbekistan, and Zambia), and 4 countries (Colombia, Macedonia, Mexico, and Zimbabwe) have “expert opinion” data. Table 1 outlines countries with “compliance data” by staple food or condiment and how this data was collected.
Table 1. Data from GFDx (unless otherwise indicated) outlining countries with mandatory or voluntary fortification programs in place that have “compliance data”, defined as industry compliance data obtained by authorized government entities on production volumes, market share, or samples and facilities monitored, and the methods used to obtain the data.
| Country | Timeframe | Staple Food/Condiment | Reported Compliance Range | Methods |
|---|---|---|---|---|
| Australia | 2010–2011 | Wheat flour | Unspecified | “Mills were audited by food control authorities to determine if they had quality assurance procedures in place and one wheat flour sample was taken per mill and analyzed in a lab for folic acid. All mills had quality assurance procedures in place and were deemed to be in compliance with the standard including five mills whose folic acid levels in samples were outside of the uncertainty range.” This was likely due to the challenges reliably detecting small quantities of this nutrient. |
| Brazil | 2006, 2007, 2010, 2011, 2012 | Wheat flour | 73–93% | “Wheat flour samples from mills were analyzed quantitatively for iron.” |
| 2006, 2008, 2010, 2011, 2012 | Maize flour | 16–100% | “Maize flour samples from mills were analyzed quantitatively for iron.” | |
| Chile | 2007–2014 (excluding 2013) | Wheat flour | 10–90% | “Flour samples were taken from national millers and imports four times a year. Samples were measured for thiamin, riboflavin, folic acid, and iron levels.” |
| Mexico | 2010–2017 | Wheat flour | 70–100% | “Government report of samples taken from mills. Samples measured for iron, folic acid, and zinc levels. Results reflect the lowest proportion of samples that met nutrient levels in the fortification standards.” |
| 2010–2017 | Maize flour | Not included | “Data obtained from a government report of samples taken from mills. The method is not detailed. Results reflect proportion of samples that met folic acid levels in the standard.” | |
| Peru | 2009–2017 | Wheat flour | 50–100% | “Government inspectors took flour samples from mills. Thiamine, riboflavin, niacin, folic acid, and iron levels were measured. Results reported use production volumes to generate the percent of flour compliant based on laboratory analyses. Premix reconciliation calculations were completed in a subset of mills.” |
| Liberia * | 2014–2020 | Wheat flour | 23–100% | Government inspectors take wheat flour samples from mills, import sites, and markets and test for iron using iCheck equipment. |
| 2014–2020 | Cooking oil | 6–83% | Government inspectors take cooking oil samples from import sites and markets and test for vitamin A using iCheck equipment. | |
| Salt | 21–100% | Government inspectors take salt samples from import sites and market and use the titration method to determine iodine content. | ||
| Senegal ** | 2018–2019 | Wheat flour | 90% | Wheat flour samples from mills are quantitatively analyzed at the control laboratory of the Ministry of Commerce. |
| Bangladesh | 2006–2018 | Salt | 79–97% | “Based on samples collected from production and tested for iodine.” |
| Colombia | 2014–2015 | Salt | 60–62% | “Based on samples collected at production level and tested by an authorized national lab for iodine and fluoride levels.” |
| Lack of reliance on industry audits in place of quantitative testing | Nigeria | 2011–2019 | Salt | |
| Need for food inspectors to consider laboratory analysis in combination with additional critical information, including information obtained from mill or factory inspections | ||||
| Lack of cost-effective and field-friendly tools to ensure quality to assist with effective enforcement of fortification legislation; cost and availability of reagents | ||||
| Quantitative testing of multiple micronutrients as opposed to one market nutrient and/or testing of micronutrients that are considerably difficult to measure because they are labile, added in minute quantities, or have a wide margin of error leading to high investment of lab resources and often unreliable results but often results that industry must respond to | ||||
| Budget | Need for improved regulatory agency financing | |||
| Limited national budget allocations for fortification | ||||
| Human Resources | Need for improved regulatory agency capacity | |||
| Lack of trained inspectors and analysts (for product sampling and laboratory testing) | ||||
| Limited personnel for legal action | ||||
| Lack of motivation at the implementing local government level | ||||
| Corruption among inspection personnel | ||||
| Delay in getting results to millers | ||||
| Data collection | Over-reliance on monitoring at the retail level in place of producer or import level | |||
| Lack of a centralized data collection mechanisms for collected data | ||||
| Need to simply the process of regulatory monitoring data collection for inspectors | ||||
| Fragmented system for collecting data/agency/inspector overlap | ||||
| Relationship between public and private sectors | Lack of trust between government and industry |
Table 3. Challenges faced by industry (food producers) (from the perspective of food producers, government inspectors, and external stakeholders) ensuring the quality production of fortified foods categorized by ‘challenge type’ [9][13][14][15][23][24][25][26][9,13,14,15,23,24,25,26].
| Challenge Type | Industry (Food Producer) | |||
|---|---|---|---|---|
| Regulations | Need for clear regulations that identify the roles and responsibilities of stakeholders and how they should collaborate | |||
| Enforcement | Competition with non-compliant producers | |||
| Lack of realistic, meaningful, and consistent enforcement (incentives and penalties) | ||||
| Laboratory | Poor laboratory capacity | |||
| Lack of locally available reagents | ||||
| Equipment | Lack of fortification equipment that is locally available, accessible, and affordable | |||
| Premix | High price of premix | |||
| Poor quality premix | ||||
| Lack of duty-free premix | ||||
| Budget | Lack of internal budgets that include fortification | |||
| Human Resources | Lack of training | |||
| Need for training on internal monitoring with a special focus on process control | ||||
| 67–98% | ||||
| “Based on quantitative tests of samples taken from production level. In 2018–2019, the USI/IDD Taskforce was set up in response to the decline in the compliance level of salt iodization at the household level in 2013. The Standards Organization of Nigeria (SON) authorized the release of the annual compliance data since the Taskforce started monitoring at the factory level. | Data reported are the aggregate of onsite sampling assessment data collected by staff of SON during unscheduled monthly visits (January–December every year) to the two salt processing companies currently in operation.” | |||
| Peru | 2009–2010 | Salt | 41–59% | “Based on samples collected.” |
| Thailand | 2011–2018 | Salt | 13–92% | “Based on sample collection data from the Thai Food and Drug Administration (FDA).” |
| Uganda | 2018 | Salt | 79% |
-
Internally at food production facilities—here food producers are expected to put in place internal quality assurance and quality control protocols that allow for regular checking and adjusting of the fortification production process, which should be built into already-existing food safety and quality measures, such as Hazard Analysis Critical Control Point (HACCP) and Good Manufacturing Practices (GMP) measures;
-
Externally by government food control agencies who are expected to verify that food producers have appropriate quality assurance and quality control measures in place that are well documented via technical audits and, occasionally, qualitative or quantitative end product tests. (Technical audits compliment the internal monitoring procedures that food manufacturers regularly implement and track. During an audit, an inspector will verify the production procedures and ensure documentation of the procedures are in place by observing the fortification process, conducting critical location checks (e.g., inside the feeder and inside the premix storage area), confirming that quality assurance and quality control protocols are established and followed, and reviewing records that document internal monitoring practices [18]. Verification of procedures and documentation is generally a more effective way of ensuring the end product is of adequate quality than end product tests.);
-
At the import level by government customs or food control agencies, who are expected to check to be sure fortified foods imported into the country meet national standards—this can include verifying certificates of analysis and, occasionally, conducting qualitative or quantitative tests; and
-
At the market level by government food control agencies, who are expected to verify fortified products’ packaging and labelling; this may occasionally include qualitative or quantitative testing [19] to gauge fortification program performance.
At the market level by government food control agencies, who are expected to verify fortified products’ packaging and labelling; this may occasionally include qualitative or quantitative testing [19] to gauge fortification program performance.
Throughout this paper, the terms “fortification quality” and “fortification compliance” will be used interchangeably.
Data collected through regulatory monitoring activities is vital to understanding how compliance with fortification requirements is being achieved, and if and where adjustments need to be made to ensure the program can deliver its intended nutritional benefits. This has proven, however, to be one of the most difficult and complicated pieces of a fortification program to implement and sustain. There is little value in measuring the health impact of fortification programs if food producers are not able to determine whether foods are fortified at levels stipulated in the national standard, or if government inspectors are not able to confirm this data from food producers. Therefore, having a complete and comprehensive understanding of on-the-ground constraints related to monitoring the quality of fortification programs is vital. How to ensure monitoring requirements and expectations are in line with what can realistically be carried out is outlined below. The design of such programs and the stakeholders that should be involved is not the subject of this paper.
2.1. Current Status of National Fortification Program Rates of Compliance
The Global Fortification Data Exchange (GFDx) is an online resource that aggregates and visualizes data on five commonly fortified foods: maize flour, wheat flour, oil, rice, and salt. All data in the GFDx comes from reports from countries and national programs.
GFDx [20] [20] uses three categories of fortification quality information: compliance, quality, and expert opinion. “Compliance” data refers to industry compliance data obtained by authorized government entities on production volumes, market share, or samples and facilities monitored. “Quality” data is proxy data for estimating fortification quality obtained from market or household (HH) samples analyzed by non-governmental entities. “Expert opinion” data is proxy data for estimating fortification quality based on an individual’s belief or understanding of what may exist in the country. The more reliable means of obtaining fortification monitoring data would come from what GFDx describes as “compliance” data since it is based on information at the point of production. To avoid confusion with the general use of the term quality throughout this paper, the GFDx “quality” category will be referred to as “market and HH data”. The data presented below was obtained from the GFDx on 28 October 2020 and includes countries that have mandatory or voluntary fortification programs in place.
| “Samples collected from production and tested for iodine content.” |
| Uzbekistan |
| 2004 and 2014 |
| Salt |
| 39–75% |
| “Data source unknown.” |
Source: Global Fortification Data Exchange. Accessed on 28 October 2020. (http://www.fortificationdata.org) [20]; * Source: Mambu, S. (National Standards Laboratory, Monrovia, Liberia). Personal communication, 2020 [21]; ** Source: Ndao, I. (Nutrition International, Dakar, Senegal). Personal communication, 2020 [22].
Table 1 illustrates that only a limited number of countries (a total of 14) have data on fortification compliance obtained by authorized government entities. Although there may be limitations to this data, namely countries with data that may not be included in the GFDx database that do, in fact, have compliance data, it points to an alarming trend globally.
Rates of compliance, as reported in GFDx, ranged from 10–100% across all foods required to be fortified, pointing to a second problem of high variability in actual fortification compliance of the foods. Osendarp et al. also report that a review of external quality assurance activities from 25 countries, supported by the Global Alliance for Improved Nutrition (GAIN), found the percentage of foods meeting national standards ranged from 18% to 97%, with an average of 45% to 50% [13][23][13,23]. A study published in 2020, by Mkambula et al. [9], talks about the “quality gap” that exists in fortification programs. This gap refers to the difference between the proportion of households consuming a fortified food and those consuming a food fortified in accordance with the relevant national fortification standards. Data obtained by Mkambula et al. (2020) from 16 wheat flour surveys, 8 maize flour surveys, 14 oil and ghee surveys, and 21 salt surveys from multiple countries showed that of the 15% of households consuming fortifiable (i.e., industrially processed) wheat flour, 5% were adequately fortified; of the 22% of households consuming fortifiable maize flour, 3% were adequately fortified; of the 31% of households consuming fortifiable oil and ghee, 14% were adequately fortified; and of the 65% of households consuming fortifiable salt, 1% was adequately fortified. “Adequately fortified” for foods other than salt in the above study was estimated based on results where available in individual survey reports [9]. However, caution should be taken when interpreting these results, which are looking at adequately fortified products at the household level. Since there is a need to have data from point of production to infer compliance, this may over-estimate the quality gap due to potential fortificant losses in the food as it makes its way from the point of production to the market or household level because of varying storage and environmental conditions, and not as a result of industry non-compliance.
Taken collectively, the information presented above does not necessarily infer food producers globally are fortifying foods inaccurately. It demonstrates that quality compliance data is hard to come by and, of the data that does exist, performance varies greatly with a trend towards poor performance. Without a national picture of compliance, there is no way to know whether or not fortified foods actually contain the correct amounts of vitamins and minerals per the national standard. Such a scenario risks programs being implemented ineffectively, wasting scarce resources, and jeopardizing their potential nutritional impact. Ideally, this picture of program performance would come from government monitoring data obtained from industry and not from outside development agencies for the sake of program ownership and sustainability. Although in lieu of government ability to collect this information, it is useful to have external stakeholder support to make timely program performance adjustments. The section below outlines challenges related to why this scenario of limited data and poor performance might exist.
2.2. Documented Challenges Collecting and Acting Upon Regulatory Monitoring Data
Numerous studies have documented challenges that government inspectors and food producers face when collecting and acting upon data that ensures adherence to fortification standards.
Table 2 and Table 3 attempt to summarize what we know from 7 studies and 1 workshop between 2013 and 2020 [9][13][14][15][23][24][25][26][9,13,14,15,23,24,25,26]. Table 2 presents challenges faced by government inspectors collecting and using (e.g., collating, analyzing, reporting out on, and acting upon) regulatory monitoring information, while Table 3 presents challenges faced by industries trying to comply with national standards (both from an industry perspective and a government perspective).
Table 2. Challenges faced by government regulatory agencies (from the perspective of government delegates themselves, food producers, and external stakeholders) when monitoring food fortification categorized by ‘challenge type’ [9][13][14][15][23][24][25][26][9,13,14,15,23,24,25,26].
| Challenge Type | Government Regulatory Agency Challenges |
|---|---|
| Regulations/Government Structure | Need for clear regulations that identify the roles and responsibilities of stakeholders and how they should collaborate |
| Regulations related to monitoring, inspection, and enforcement are often fragmented and not appropriately embedded within legal frameworks, leading to a lack of (or weak) enforcement | |
| Need for improved regulatory agency structure | |
| Poor government coordination | |
| Need for better harmonization and integration of fortification efforts vertically into food safety mechanisms as a subset of food control within the appropriate national entities | |
| Lack of clear specifications and objective assignment of enforcement mechanisms and penalties in the legal framework | |
| Ongoing reorganization of regulatory agencies | |
| Fragmented system for collecting data/agency/inspector overlap | |
| Enforcement | Low priority and capacity for enforcement |
| Lack of willingness on the part of government inspectors to take on the “political risk” of enforcement (e.g., using penalties was seen as politically risky due to perceived or real resistance from interest groups or mill associations) and often lead to penalties that were not serve enough to encourage adequate fortification | |
| Laboratory/Testing/Equipment | Laboratory capacity constraints, both in terms of trained analysts and local availability/cost of equipment and reagents |
| Both regulators and industry have an over-reliance on end-product quantitative testing and lab results, which have a high margin of error and are time consuming to conduct | |
| Lack of awareness of standards | |
| Delay in results to millers | |
| Relationship between public and private sectors | Need for communication between sectors (e.g., industry and regulatory agency) |
| Lack of trust between government and industry | |
| Consumers | Lack of product market demand |
| Lack of accountability to consumers | |
| Other | Lack of an effective business model for fortification |
| Purposeful under-fortification |
Table 2 and Table 3 also include findings from a Smarter Futures’ Fortification Monitoring ‘Challenge’ Workshop that took place virtually between August and October 2020 and that involved ten countries (Cameroon, Cote d’Ivoire, Ghana, Kenya, Mozambique, Nigeria, Senegal, South Africa, Tanzania, and Uganda). Teams from each country were asked to outline (a) their specific fortification monitoring challenges from the perspective of both industry and government and (b) how they might address these specific challenges using existing human and financial resources at their disposal. In other words, the solutions they were asked to propose to address their regulatory monitoring challenges could not include anything that required further inputs or resources. The goal was to spur creative thinking around how this data might be obtained in more effective and realistic ways today. The hope was that the teams would leverage multiple tools and methods that currently exist to address their challenges.
Unfortunately, most of the solutions obtained from country teams revolved around the need for additional training and additional funding. It is unclear whether the team responses were due to a lack of understanding of the question being asked, a lack of awareness of the tools and methods that currently exist to address their challenges, resistance internally to move away from more traditional means of collecting fortification quality data, or otherwise. This more nuanced understanding was not obtained from the workshop participants.
2.3. Global Resources to Address Pressing Monitoring Challenges
There has been much effort over the years to provide resources to address the identified fortification monitoring challenges. Several resources have recently been developed at both the international and country level, with the goal of improving fortification program compliance. These include but are not limited to the 2018 Regulatory Monitoring of National Food Fortification Programs: A Policy Guidance Document, FortifyMIS, PalmaTrack, and the Micronutrient Fortification Index, each profiled below.
2.3.1. Policy Guidance Document
In 2018, the Global Alliance for Improved Nutrition (GAIN) and Project Healthy Children (PHC) led the creation of Regulatory Monitoring of National Food Fortification Programs: A Policy Guidance Document [18]. The document was generated in response to recommendations that came out of the September 2015 Global Summit on Food Fortification, which culminated in the Arusha Statement on Food Fortification [27]. Among other things, the Statement set forth five recommendations for fortification in low- and middle-income countries, the second being to improve oversight (regulatory monitoring) and enforcement of food fortification regulations and standards. As a result, a regulatory monitoring working group was established to identify enabling factors that facilitate consistent regulatory monitoring practices and industry compliance. An outcome of the group’s efforts was the Regulatory Monitoring Policy Guidance Document.
The document proposes a standardized systems-based approach for determining compliance built upon a foundation of realistic, feasible food fortification standards. It addresses common challenges faced by government regulatory agencies that are designated to monitor the fortification program and by food manufacturers as they seek to fortify appropriately. The document aims to reflect a consensus among fortification stakeholders, and to serve as a resource for those responsible for food fortification policy development and implementation. It is particularly aimed at those working in countries that have struggled to carry out regulatory monitoring activities on a consistent basis, and where the lack of compliance with fortification regulations and standards is an ongoing issue [18]. In addition to GAIN and PHC, the document was endorsed by the Iodine Global Network (IGN), the Food Fortification Initiative (FFI), and Technoserve. The text box below summarizes the highlighted recommendations from the policy guidance document.
Highlighted recommendations from the 2018 Regulatory Monitoring of National Food Fortification Programs: A Policy Guidance Document [18]
-
Implement a standardized, realistic systems-based approach to determine compliance, emphasizing the process of fortification over regular testing of fortified food samples.
-
Develop a comprehensive audit checklist that covers food quality, food safety, and food fortification.
-
Use the premix reconciliation calculation to determine whether the manufacturing (fortification) process is sufficiently adding micronutrients to foods. This equation compares whether the amount of premix used correlates appropriately to the amount of fortified food produced over a set time period. Premix reconciliation is one task conducted during an audit at a food production site.
-
Within the country’s fortification standards, express each micronutrient specification as a target value encompassed by actionable limits.
-
Analyze composite samples of fortified foods quantitatively only periodically and as a means to validate the findings of an audit.
-
Implement a user-friendly, computerized management information system (MIS) to make the process of data collection, collation, analysis, interpretation, and results dissemination more efficient and effective.
-
Establish incentives that appeal to the food industry in addition to meaningful and enforceable penalties that drive consistent compliance among food manufacturers.
-
Involve non-traditional stakeholders in monitoring fortification programs at the commercial and household levels to extend resources and expand public engagement in the initiative.
2.3.2. FortifyMIS
FortifyMISis an online data collection and aggregation approach for fortification monitoring developed by Project Healthy Children (PHC) and the Global Alliance for Improved Nutrition (GAIN). The Management Information System (MIS) provides an improved means for food producers and government inspectors to monitor the quality of fortified products while providing decision makers with timely information to improve program performance. The MIS can be used offline in the field and allows for strict confidentiality of information by users. Users include food producers, government inspectors, program managers, and laboratory staff, each with their own set of unique user and viewing privileges. The goals of FortifyMIS are to (1) simplify the process of compliance data collection for national-level food inspectors and food producers and (2) improve how food control agencies are informed of implementation challenges [28].
FortifyMIS can be used on computers, tablets, and handheld mobile devices. It allows for automatic tracking of fortified food quality and safety data using customizable digital forms, real-time dashboards, and tailored data reporting methods. The platform aims to reduce the time and cost of monitoring and improve overall program performance by quickly tracking the quality of foods and identifying where improvements are needed. One of the biggest challenges, outlined above, that the MIS addresses is the need for a central database to collate collected information, and the need to streamline data collection for regulatory inspectors. FortifyMIS is currently being piloted in Bangladesh, Mozambique, Nigeria, Pakistan, and Tanzania. Examples of data outputs from the MIS are provided in Figure 1 and Figure 2 with producer and brand data intentionally hidden for confidentiality.
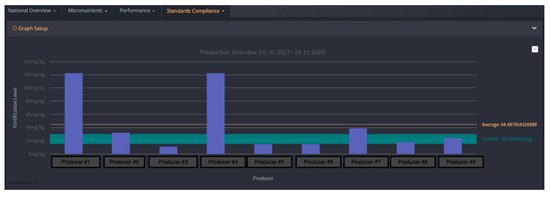
Figure 1. FortifyMIS dashboard data that displays how compliant cooking oil producers are to the national vitamin A standard over a select period of time compared to the national standard shown by the green horizontal bar (including minimum (15 mg/kg) and maximum (30 mg/kg) levels as designated in the national cooking oil fortification standard). Average oil fortification is 44 mg/kg; 6 producers are considered compliant since they fall above the minimum of 15 mg/kg. These data were collected by regulatory inspectors and can be viewed by program managers. Producer information has been masked for confidentiality.
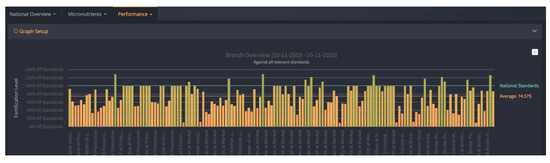
Figure 2. FortifyMIS dashboard data that displays brand performance for cooking oil against the national standard for vitamin A and indicates what percent of the standard is met across all data collection points (producer level, border points, and market level). Brand information has been masked for confidentiality.
2.3.3. PalmATrack
Developed in 2018 by Millhouse, a supplier of vitamin A palmitate and fortified sugar for food industries in Africa, PalmATrack is an online platform designed to capture live production data from sugar industries. It is a platform that empowers mills, laboratories, governments, and related agencies in assessing vitamin A quality in line with government fortification regulations. PalmATrack was developed to track and display vitamin A iCheck results, which provide nutrient levels in fortified foods. This is a key indicator to inform industry about regulatory compliance with fortification standards. Users include laboratory staff, mill staff, and government, each with their own set of data viewing privileges. PalmATrack allows for remote monitoring so Millhouse can view progress and anticipate bottlenecks to support their partner industries. PalmATrack is supporting monitoring within sugar production facilities in Mozambique, Zimbabwe, and Malawi, with plans to scale to the maize industry throughout Africa [29]. Figure 3 illustrates an example PalmATrack dashboard as viewed by industry for the month of January. This industry user has two sugar production facilities (Sunsweet Station and White Station) that are displayed across the top of the graph.
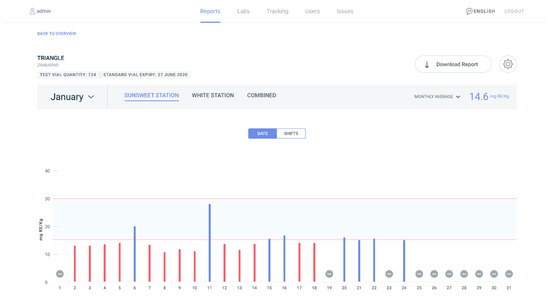
Figure 3. PalmATrack industry dashboard for the month of January for one sugar producer that has two production facilities (Sunsweet Station and White Station). The graph displays iCheck test results for vitamin A in the sugar. The x axis displays the days of the month and the y axis displays the test results for vitamin A in milligrams of Retinal Equivalent (RE) per kilogram. Red bars indicate test results that are below the national standard and blue bars indicate test results that within the national standard. Dashes indicate no test results for that day.
2.3.4. Micronutrient Fortification Index
With the goal of seeking a cost-effective strategy that provides a commercial incentive for processors to comply with food fortification standards in Nigeria, Technoserve’s Strengthening African Processors of Fortified Foods (SAPFF) program conceptualized and developed the Micronutrient Fortification Index (MFI). MFI supports existing regulatory systems with an industry-driven initiative that effectively differentiates between compliant and non-compliant companies by the extent to which they meet industry benchmarks, including compliance, informed by Nigerian standards. At the core of the MIF are three weighted components which feed into a score: a self-assessment, product testing, and external verification of the self-assessment. Companies’ overall scores are presented on a dashboard, which is updated annually to show progress and gaps, ultimately contributing to an industry-wide platform emphasizing quality standards as a key performance indicator [30].
Although these resources address many of the challenges outlined in Table 2 and Table 3, their use and rollout across country programs has been limited.