Mitochondria produce adenosine triphosphate (ATP) while also generating high amounts of reactive oxygen species (ROS) derived from oxygen metabolism. ROS are small but highly reactive molecules that can be detrimental if unregulated. While normally functioning mitochondria produce molecules that counteract ROS production, an imbalance between the amount of ROS produced in the mitochondria and the capacity of the cell to counteract them leads to oxidative stress and ultimately to mitochondrial dysfunction. This dysfunction impairs cellular functions through reduced ATP output and/or increased oxidative stress. Mitochondrial dysfunction may also lead to poor oocyte quality and embryo development, ultimately affecting pregnancy outcomes. Improving mitochondrial function through antioxidant supplementation may enhance reproductive performance. Recent studies suggest that antioxidants may treat infertility by restoring mitochondrial function and promoting mitochondrial biogenesis. Antioxidant properties of coenzyme-Q10, resveratrol, melatonin and several vitamins have been evaluated in the human oocyte, although their direct action on mitochondrial function has yet to be elucidated.
- mitochondrial function,antioxidants,oxidative stress,ROS,oocyte quality,embryo quality,oxygen metabolism
1. Introduction
Mitochondria produce the energy required by cells to carry out all cellular processes. Energy is generated in the form of adenosine triphosphate (ATP) through oxidative phosphorylation, a process that takes place in the inner mitochondrial membrane under aerobic conditions. Along this membrane, electrons from the controlled oxidation of nicotinamide adenine dinucleotide (NADH) or flavin adenine dinucleotide (FADH2), both products of the citric acid cycle, travel through several enzymatic complexes forming the electron transport chain (ETC). The movement of electrons throughout the ETC is coupled with the transfer of protons across the membrane into the intermembrane space, generating an electrochemical proton gradient over the inner mitochondrial membrane that is harnessed by F1-F0 ATPase to phosphorylate adenosine diphosphate (ADP) into ATP [1] (Figure 1).
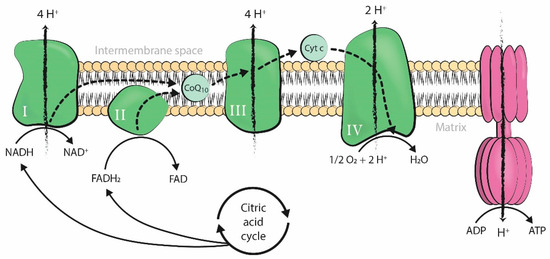
Figure 1.
2
2
2
Mitochondrial respiration is a form of aerobic metabolism and uses oxygen to produce energy, with oxygen as the ultimate electron acceptor of the electron flow system of the mitochondrial ETC. However, mitochondrial electron flow may become uncoupled at several sites along the chain, resulting in unpaired single electrons that react with oxygen or other electron acceptors and generate free radicals. When these electrons react with oxygen, the resulting free radicals are referred to as reactive oxygen species (ROS). These include the superoxide anion (O2•−), which forms hydrogen peroxide (H2O2) and can further react to form the hydroxyl radical (HO•). Unrelated to respiration, there is also a large source of H2O2 in the outer mitochondrial membrane due to monoamine oxidase catalytic activity [1][2][1,2].
Physiological levels of ROS are required for normal cellular function [3]. However, ROS are also highly reactive molecules that can damage mitochondrial components, initiate degradative processes, deregulate essential cellular functions, and initiate many pathological conditions if generated uncontrollably [1]. Therefore, many organisms have developed a system of antioxidant defense, in which mitochondria play a major role as antioxidant producers, allowing them to maintain balanced levels of oxidants and antioxidants [3]. An antioxidant is any substance that delays the oxidation of lipids, carbohydrates, proteins, or DNA by directly scavenging ROS or by indirectly up-regulating antioxidant defenses or inhibiting ROS production. There are many different endogenous and exogenous sources of antioxidants [3][4][3,4], but the first line of defense is also the main ROS producer in the cell: the mitochondria.
Antioxidants counteract the high levels of ROS derived from mitochondrial metabolism, reducing damage to the cell. However, an imbalance between the amount of antioxidants and ROS produced, in favor of the latter, leads to oxidative stress [3]. Oxidative stress generates lipid peroxidation [5], as well as RNA, DNA, and protein oxidation, which in turn leads to their selective enzymatic degradation by nucleases and proteases [2]. On the one hand, lipid peroxidation affects the integrity of cell membranes [5]. On the other hand, nuclear DNA degradation induces the onset of apoptosis [6] and occurs at the same time as the release of mitochondrial cytochrome c (Cyt c) [2], which is also responsible for the initiation of programmed cell death [7]. Oxidative stress may also interfere with essential mitochondrial functions within the cell by promoting the inactivation of enzymes from the mitochondrial ETC [8] and by increasing mtDNA mutations. In fact, mitochondrial DNA is prone to mutations because it lacks protective histones and is in close proximity to the inner mitochondrial membrane [9]. Finally, oxidative stress has also been related to telomere shortening and senescence [10].
Oxidative stress can be caused by, or be the cause of, mitochondrial dysfunction (MD). MD reduces the production of ATP and synthesis of antioxidant molecules, creating a cycle in which ROS-induced mitochondrial damage results in higher oxidant production and further mitochondrial impairment [11]. MD is involved in the pathogenesis of many neurodegenerative and cardiovascular diseases, such as Alzheimer'’s disease and atherosclerosis [12][13][12,13]. In the reproductive field, MD is related to a decline in oocyte quality [14]. Mitochondria are essential organelles involved in meiotic spindle assembly, proper segregation of chromosomes, maturation, fertilization, and embryo development [15]. Therefore, MD may affect the quality and DNA content of oocytes, embryo development, and pregnancy outcome. The consequences of MD are not limited to the short-term, as oxidative stress exposure during the gestational period is related to long-lasting cardiovascular effects [16].
Regardless of origin, oxidative stress and MD are triggered by both intrinsic and extrinsic factors. Intrinsic factors include biological age [11][17][11,17], endometriosis [18], polycystic ovarian syndrome (PCOS) [19], and premature ovarian insufficiency (POI) [20]. Extrinsic factors include environmental exposure to ROS inducers or producers, such as diet, professional exposure, and assisted reproduction treatment (ART) techniques [21]. Some of these factors are modifiable and, therefore, offer opportunities for intervention.
ROS are natural products of sperm, oocyte, and embryo metabolism. However, gamete manipulation during ART procedures increases ROS either through indirect intracellular ROS production in response to external stressors or through direct exogenous ROS production by environmental factors. The risk of oxidative stress development is higher in vitro than in vivo, although it remains unclear to what extent ART is responsible for higher levels of oxidative stress [21]. Despite recent advancements in ART techniques [22][23][24][25][22,23,24,25], the in vitro fertilization (IVF) setting does not recreate the conditions of natural fertilization, which includes tight physiological regulation of oxidative stress by antioxidants. Oxygen concentration, temperature variation, high light exposure, culture media composition, and cryopreservation methods are environmental sources of oxidative stress in the IVF laboratory [21], implicating the need for antioxidant supplementation in the IVF setting. Indeed, human IVF culture media are supplemented with combinations of molecules with antioxidant properties, including human serum albumin, ethylenediaminetetraacetic acid, folic acid, ascorbic acid, and pantothenic acid (vitamin B5), among others [25].
Antioxidants are endogenous to organisms, but it is uncertain if supplementation of these substances can improve oocyte mitochondrial function. Although several supplementary antioxidant molecules have shown promising results [26][27][28][26,27,28], two recent Cochrane reviews described low-quality evidence about the positive effects of oral antioxidant treatment in live birth and clinical pregnancy rates in women attending an infertility clinic [29][30][29,30]. In this entry we focus on the role of coenzyme-Q10, resveratrol, melatonin and several vitamins. Figure 2 presents a graphic representation of their antioxidant properties.
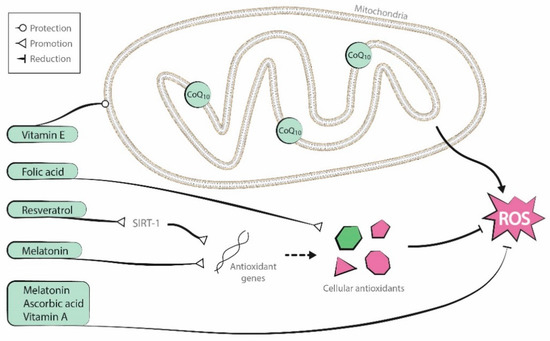
Figure 2. Antioxidant properties of the molecules reviewed (coenzyme-Q10, resveratrol, melatonin, and vitamins A, B, C, and E).
2. Antioxidant Supplementation in Reproduction
Antioxidant treatment in the reproductive field can be carried out either by oral supplementation before infertility treatment or by culture media supplementation during ART. Oral supplementation attempts to improve gamete quality in vivo, while culture media supplementation attempts to do so in vitro. The latter approach can also be used to improve the in vitro maturation (IVM) process and to counteract high ROS production within the IVF setting.
Antioxidant supplementation is generally described in the literature as being applied to the male [31]. In this review, we discuss the use of antioxidants to improve oocyte and embryo quality, both in vivo and in vitro. We focus on mitochondrial function because its enhancement may be the main mechanism by which antioxidants manage to improve gamete quality. However, although mitochondrial function has been restored by different antioxidant molecules in many other tissues [32][33][34][35][32,33,34,35], this direct association has not yet been demonstrated in the human oocyte. A summary of the main evidence regarding the current utility of each of the antioxidants described is presented in Table 1, while a more extensive summary of the results of the discussed human studies is presented in Table 2.
Table 1. Brief summary of evidence from published studies on the utility of the antioxidants reviewed. Only human studies are summarized. A green tick means that at least one study found beneficial effects on oocyte/embryo quality; a red cross means that the studies reviewed did not find any beneficial effects; a question mark means that the antioxidant effect has not been studied in that scenario.
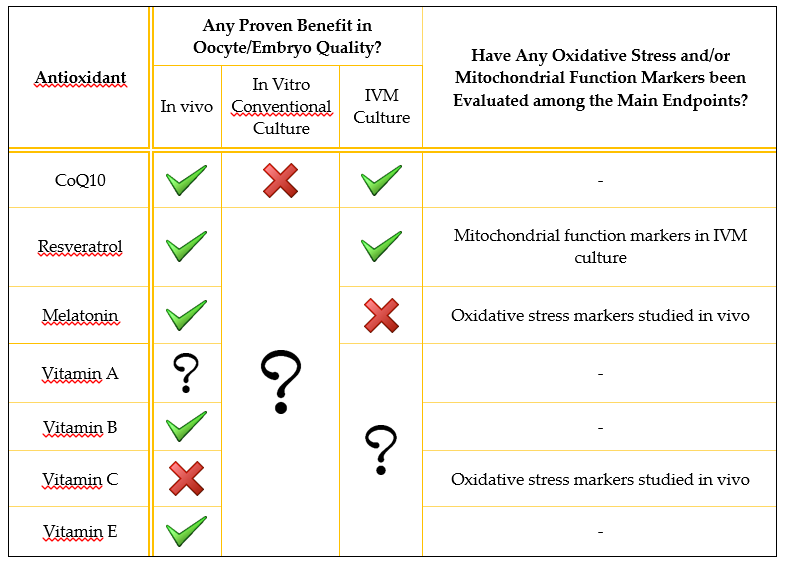
Table 2. Summary of clinical trials conducted to evaluate antioxidant supplementation protocols in vitro and in vivo to improve oocyte quality. p-values > 0.05 are presented as p = NS (non-significant). Gr.: group. RCT: randomized controlled trial. y.o.: years old. CPR: clinical pregnancy rate. MR: miscarriage rate. LBR: live birth rate. GV: germinal vesicle. OR: odds ratio. CI: confidence interval. IVM: in vitro maturation. hCG: human chorionic gonadotropin. MII: metaphase II. IVF: in vitro fertilization.
Antioxidant | Authors | Type of Study | In Vitro/In Vivo | Intervention | Primary Endpoint | Condition | Treatment Groups (n) | Findings | ||||||||||||||||||||||||||||||||||||||||||||||||||||||||||||||||||||||
CoQ10 | Bentov et al., 2014 [26] |
| RCT | In vivo | 600 mg/day for 2 months until the day of oocyte retrieval. | Double blinded. | Number of euploid embryos per retrieval | IVF patients 35-43 y.o. | Study gr.: 17 | Control gr: 22 | Lower aneuploidy rate in the CoQ10 group (46.5% vs. 62.8% in the control group; p = NS). Premature termination of the study. | |||||||||||||||||||||||||||||||||||||||||||||||||||||||||||||||||||
El Refaeey et al., 2014 [36] | [50] |
RCT | In vivo | 60 mg three times per day from day 2 of cycle until the day of ovulation induction. | Blinded. | Number of follicles >14 and ≥18 mm | CC-resistant PCOS | Study gr.: 51 | Control gr.: 50 | In the treatment group, higher number of follicles >14 mm (1.94 ± 0.25 vs. 0.13 ± 0.29; p < 0.05) and of follicles ≥18 mm (1.85 ± 0.27 vs. 1.30 ± 0.32; p < 0.001). | ||||||||||||||||||||||||||||||||||||||||||||||||||||||||||||||||||||
Xu et al., 2018 [37] | [48] |
RCT | In vivo | 600 mg/day for 60 days before the initiation of ovarian stimulation | Number of high-quality day-3 embryos | Poor ovarian response patients <35 y.o. | Study gr.: 76 | Control gr.: 93 | Higher mean number of good quality day-3 embryos in the CoQ10 group (1 vs. 0 in the control group; p = 0.03). | Secondary endpoints: | - Higher ovarian response in the CoQ10 group (4 vs. 2 mean retrieved oocytes; p = 0.002). | - Higher fertilization rate in the CoQ10 treatment group (67.5% vs. 45.1%; p = 0.001). | - No significant differences in CPR, MR, and LBR. |
| ||||||||||||||||||||||||||||||||||||||||||||||||||||||||||||||||
Ma et al., 2020 [38] | [53] |
RCT | In vitro | IVM medium supplemented with 50 mmol/L for 24 h | Oocyte maturation and postmeiotic aneuploidy rates | IVM of GV from patients ≥38 y.o. and patients ≤30 y.o. | 45 patients ≥38 y.o. | Study gr.: 46GV | Control gr.: 46GV | 18 patients ≤30 y.o. | Study gr.: 35GV | Control gr.: 39GV | Patients ≥38 y.o.: | - Higher maturation rate in the CoQ10 group (82.6% vs. 63.0%; p = 0.035). | - Reduced postmeiotic aneuploidy rate in the CoQ10 group (36.8% vs. 65.5%; p = 0.02). | Patients ≤30 y.o.: | - Similar maturation rates (80.0% in the CoQ10 group vs. 76.9% in the control group; p =
0.8). | - Similar postmeiotic aneuploidy rates (28.6% in the CoQ10 group vs. 30.0% in the control group; p =
0.9). | ||||||||||||||||||||||||||||||||||||||||||||||||||||||||||||
CoQ10 | Kile et al., 2020 [39] | [54] |
RCT | Preliminary results (ASRM Congress 2020) | In vitro | Mitoquinol addition to the culture media from fertilization and throughout embryo development | Effect on embryo development | Advanced maternal age (≥35 y.o.) women | 11 patients | Study gr: 66 embryos | Control gr: 143 embryos | No differences between control and Mitoquinol treatment in day 5 (18% in control group vs. 20% in the study group) or total (48% vs. 45%) good quality blastocyst development per zygote, total blastocyst development (63% vs. 62%) and euploidy rates (33% vs. 30%); p = NS. | ||||||||||||||||||||||||||||||||||||||||||||||||||||||||||||||||||
Resveratrol | Liu et al., 2018 [40] | [68] |
RCT | In vitro | IVM medium supplemented with 1.0 µm for 24 and 36 h | Maturation rates after 24 and 36 h, mitochondrial immunofluores-cence intensity, and proportion of matured oocytes with an abnormal spindle morphology and irregular chromosomal arrangement | IVM of GV from patients 38-45 y.o. | 64 patients | Study gr.: 38GV | Control gr.: 37GV | - Increased maturation rates of the resveratrol group after 24 h (55.3% vs. 37.84% in the control group; p < 0.05) and 36 h (71.1% vs. 51.35%; p < 0.05) of IVM culture. | - Increased mitochondrial immunofluorescence intensity in the resveratrol group (53.0% vs. 31.1%, p < 0.05). | - Reduced proportion of abnormal spindle morphology and irregular chromosomal arrangement in the resveratrol group ( p < 0.05). | |||||||||||||||||||||||||||||||||||||||||||||||||||||||||||||||||
Bahramrezaie et al., 2019 [41] | [78] |
RCT | In vivo | 800 mg/day for 40 days until the day of oocyte retrieval. | Triple blinded. | Levels of VEGF expression in granulosa cells | Infertile PCOS patients 18-40 y.o. | Study gr.: 30 | Control gr.: 31 | - Reduced VEGF expression in the resveratrol group (p = 0.0001). | Secondary endpoints: | - No differences between both groups in the number of mature oocytes and cleavage and fertilization rates ( p = NS). | - Higher high-quality oocyte rate (81.9% vs. 69.1%; p = 0.002) and high-quality embryo rate in the resveratrol group (89.8% vs. 78.8%; p = 0.024). | |||||||||||||||||||||||||||||||||||||||||||||||||||||||||||||||||
Resveratrol | Ochiai et al., 2019 [27] | Retrospective | In vivo | 200 mg/day during the IVF cycle. | Pregnancy outcomes (CPR and MR) | IVF patients | Study gr.: 204 cycles/102 women | Control gr.:7073 cycles/2958 women | Decreased CPR [10.8% vs. 21.5%; p = 0.0005 (Adjusted OR 95% CI 0.539, 0.341–0.853] and increased MR [52.4% vs. 21.8%; p = 0.0022 (Adjusted OR 95% CI 2.602, 1.070–6.325] after resveratrol supplementation. |
| ||||||||||||||||||||||||||||||||||||||||||||||||||||||||||||||||||||
Melatonin | Takasaki et al., 2003 [42] | [90] |
Prospective cohort study with an intrapatient retrospective comparison | In vivo | 1 or 3 mg/day from the fifth day of the previous cycle until the day of ovulation induction | To compare oocyte quality between the previous and current IVF cycles | Women with a previous IVF failure due to poor oocyte quality | Study gr. (1 mg): 13 | Control gr.: previous cycle data. | Study gr. (3 mg): 23 | Control gr.: previous cycle data. | - Reduced number of degenerated oocytes in the 3 mg group (p < 0.05) vs. the control group. | - Tendency toward an increased fertilization rate in the 3 mg group. | - No differences in the numbers of retrieved and mature oocytes between the 3 mg and the control group. | - No differences in the number of retrieved, mature, degenerated, and fertilized oocytes between the 1 mg and control group. | |||||||||||||||||||||||||||||||||||||||||||||||||||||||||||||||
Tamura et al., 2008 [43] | [91] |
Prospective cohort study with a retrospective comparison in the same population | In vivo | 3 mg/day from the fifth day of the previous cycle until the day of oocyte retrieval | To compare fertilization rates between the previous and current IVF cycles | Women with a previous IVF failure due to low fertilization rate (≤50%) | Study gr.: 56 | Control gr.: previous cycle data | Placebo gr.: 59 | Control gr.: previous cycle data | Increased fertilization rate in the melatonin group (29.8 points compared to the previous IVF cycle; p < 0.01), while there were no differences in the placebo group (1.9 points compared to the previous IVF cycle; p > 0.01). | |||||||||||||||||||||||||||||||||||||||||||||||||||||||||||||||||||
Eryilmaz et al., 2011 [28] | RCT | In vivo | 3 mg/day from the third or fifth day of the previous cycle until the day of oocyte retrieval | Oocyte quality | IVF patients | Study gr.: 30 | Control gr.: 30 | - Increased number of mature oocytes (9.0 vs. 4.4; p = 0.0001) in the treated group. | Secondary endpoints: | - Increased number of retrieved oocytes (11.5 vs. 6.9; p = 0.0001) in the treated group. | ||||||||||||||||||||||||||||||||||||||||||||||||||||||||||||||||||||
Batıoğlu et al., 2012 [44] | [92] |
RCT | In vivo | 3 mg/day during the IVF cycle | Number of MII oocytes | IVF patients | Study gr.: 40 | Control gr.: 45 | - No differences in the mean number of MII oocytes retrieved (12.0 in the study vs. 10.9 in the control gr.; p = 0.139). | - Higher percentage of MII oocytes/retrieved in the treated group (81.9% in the study vs. 75.8% in the control gr.; p = 0.034). |
| |||||||||||||||||||||||||||||||||||||||||||||||||||||||||||||||||||
Melatonin | Kim et al., 2013 [45] | [100] |
RCT | In vitro | IVM medium supplemented with 10 µmol/L for 24 and 48 h | Maturation rates | IVM of GV from PCOS patients with or without hCG priming during unstimula-ted cycles | Study gr.: 62 | (41 non-hCG primed, 21 hCG primed) | Control gr.: 49 | (25 non-hCG primed, 24 hCG primed) | - In the non-hCG priming gr., there were no differences in the maturation rate between melatonin treatment and the control gr. after 24 h (40.0% vs. 40.0%; p = NS) and 48 h (62.5% vs. 60.3%; p = NS) of maturation. | - In the hCG priming gr., there were no differences in the maturation rate between melatonin treatment and control gr. after 24 h (51.3% vs. 44.9%; p = NS) and 48 h (59.8% vs. 54.8%; p = NS) of maturation. | |||||||||||||||||||||||||||||||||||||||||||||||||||||||||||||||||
Fernando et al., 2018 [46] | [96] |
RCT | In vivo | 2/4/8 mg/twice per day during ovarian stimulation. | Double blind. | CPR | IVF patients | Study gr. (2 mg): 41 | Study gr. (4 mg): 39 | Study gr. (8 mg): 40 | Control gr.: 40 | - No differences in CPR (15% in the control group vs. 26.8 in the 2 mg group; 15.4 in the 4 mg group; 22.5 in the 8 mg group; p = 0.5). | Secondary endpoints: | - No differences in the total oocyte number ( p = 0.8), number of MII oocytes (p = 0.4), number of fertilized oocytes (p = 0.6) and the number (p = 0.6) or quality (p = 0.9) of embryos between any of the three treatment groups and the control group. | ||||||||||||||||||||||||||||||||||||||||||||||||||||||||||||||||
Espino et al., 2019 [47] | [97] |
RCT | In vivo | 3 or 6 mg/day from the onset of ovarian stimulation until the day of oocyte retrieval | - TAC, SOD, and LPO as antioxidant markers in the follicular fluid. | - 8-OHdG as oxidative stress marker in the follicular fluid. | - IVF success. | IVF patients with unexplained infertility | Study gr. (placebo): 10 | Study gr. (3 mg): 10 | Study gr. (6 mg): 10 | Non-randomized control gr. (fertile women): 10 | - Restored concentrations of TAC, SOD, LPO, and 8-OHdG in the follicular fluid of the study gr. to levels found in fertile women (except for SOD levels in the 3 mg study gr.). | - Improved MII oocyte rate (83.6% in the 3 mg gr. vs. 81.9 in the fertile gr., p = NS, and in comparison to 70.6 in the no-treatment gr., p < 0.05). | - Improved MII oocyte rate (76.2% in the 6 mg gr., vs. 81.9% in the fertile gr. and 70.6% in the no-treatment gr.; p = NS). | - Increased number of transferable embryos (5.1 in the 3 mg gr. and 4.6 in the 6 mg gr.; vs. 2.3 in the fertile gr., p < 0.05, and 2.0 in the no-treatment gr., p < 0.05). |
| |||||||||||||||||||||||||||||||||||||||||||||||||||||||||||||
Folic acid | Gaskins et al., 2014 [48] | [138] |
Prospective cohort | In vivo | Validated food frequency questionnaire, with specific data about supplemental folic acid intake | To assess the relationship between pregnancy outcomes (implantation rate, CPR, and LBR) and supplemental folate intake | Infertile IVF patients | Total n: 232 | Quartile 1 (Q1) | Folic acid <400 µg/day): 51 | Quartile 4 (Q4) | Folic acid >800 µg/day): 60 | - Higher implantation rates [Adjusted mean; A.m., 95% CI 0.67 (0.56,0.77) vs. 0.43 (0.31, 0.55)], CPR [A.m., 95% CI 0.62 (0.51, 0.73) vs. 0.41 (0.29, 0.53)], and LBR [A.m., 95% CI 0.55 (0.43, 0.66) vs. 0.35 (0.24, 0.48)], in the Q4 in comparison to Q1 (p < 0.05). | - Positive linear relationship between supplemental folate and LBR up to 1200 µg/day, without evidence of additional benefit with higher intakes. |
| |||||||||||||||||||||||||||||||||||||||||||||||||||||||||||||||
Murto et al., 2014 [49] | [140] |
Longitudinal cohort study | In vivo | Serum folate determinations (folate status) and folic acid supplement questionnaires (folic acid intake) | CPR and LBR | IVF patients with unexplained infertility | Total n: 180 | [Serum folate] | ≥22.5 nmol/L: 78/180 | <22.5 nmol/L: 89/180 | No data: 13 |
| Folic acid supplements intake | Users: 137/180 | Non-users: 42/180 | No data: 1/180 | Folate status: | - No statistically significant differences regarding CPR [35.9% when serum folate ≥22.5 nmol/L vs. 34.8%; OR 95% CI 0.954 (0.505–1.802)] and LBR [28.2% when serum folate ≥22.5 nmol/L vs. 27.0%; OR 95% CI 0.940 (0.476–1.855)]. | Folic acid intake: | - No statistically significant differences regarding CPR [32.8% users vs. 35.7% non-users; OR 95% CI 1.003 (0.515–1.953)] and LBR [24.1% users vs. 31.0% non-users; OR 95% CI 1.366 (0.677–2.757)]. |
| |||||||||||||||||||||||||||||||||||||||||||||||||||||||||
Ascorbic acid | Griesinger et al., 2002 [50] | [145] |
RCT | In vivo | 1/5/10 g/day from the day of oocyte retrieval and during the luteal phase (14 days). | Double blind. | Implantation rate and CPR | Infertile IVF patients | Study group (1g): 172 | Study group (5g): 153 | Study group (10g): 136 | Control gr.:158 | - Implantation rate was 10.0% in the 1 g group, 12.36% in the 5 g group, 10.3% in the 10 g group, and 14.8% in the control group (p = 0.186). | - CPR was 22% in the 1 g group, 24% in the 5 g group, 21% in the 10 g group, and 28% in the control group ( p = 0.186). | ||||||||||||||||||||||||||||||||||||||||||||||||||||||||||||||||
Ascorbic acid | Crha et al., 2003 [51] | [144] |
Prospective cohort | In vivo | 500 mg/day during ovarian stimulation | Number of pregnancies | Infertile IVF patients | Study gr.: 38 | Control gr.: 38 | No significant difference in the number of pregnancies (34.2% vs. 23.7% in the control group; p = NS). | ||||||||||||||||||||||||||||||||||||||||||||||||||||||||||||||||||||
Lu et al., 2018 [52] | [146] |
RCT | In vivo | 1000 mg/day from 2 months before IVF treatment until 2 weeks after embryo transfer | - Serum and follicular fluid levels of ascorbic acid. | - Levels of oxidative stress markers | Endometriosis patients | Study gr.: 137 | Placebo gr.: 108 | - Higher serum and follicular fluid levels of ascorbic acid (levels not shown; p < 0.05) in the study group. | - No difference in oxidative stress markers after treatment. | |||||||||||||||||||||||||||||||||||||||||||||||||||||||||||||||||||
Vitamin E |
| Bahadori et al., 2017 [53] | [155] |
| Observational |
| In vivo |
| Serum and follicular fluid vitamin E determination |
| To assess the relationship between serum and follicular fluid vitamin E levels and oocyte maturation and embryo quality |
| IVF patients with a history of vitamin E supplementa-tion |
| Total n: 50 | Follicular fluid ranges (mg/dL) | 0.35-1 | 1-1.5 | 1.5-2 | 2-7.4 |
|
|
| Serum ranges (mg/dL) 1-5 | 5-10 | 10-15 | 15-20 | Follicular fluid: | - Vitamin E levels within the ranges of 0.35-1 mg/dL and 1.5-2 mg/dL were related to higher oocyte maturation rates (89.2% and 84.9%, respectively, vs. 69.6% in 1-1.5 mg/dL and 76.7% in 2-7.4 mg/dL ranges; p = 0.002). | - No significant relationship between vitamin E levels and embryo quality was observed. |
| Serum: | - Vitamin E levels between 10 and 15 mg/dL were correlated with a higher proportion of high-quality embryos (87.5% vs. 46.2 in 1-5 mg/dL, 54.9% in 5-10 mg/dL, 42.9% in 15-20 mg/dL; p =
0.007). | - No significant relationship between vitamin E levels and oocyte maturation was observed. | A higher proportion of MII oocytes in women with vitamin E supplementation (87.4% vs.77% in women without supplementation; p =
0.010). | |||||||||||||||||||||||||||||||||||||||||||
Antioxidants in combination | Fatemi et al., 2017 [54] | [156] |
RCT | In vivo | Vitamin E (400 mg/day) and Vitamin D (50,000 IU/one in two weeks) for 8 weeks. | Double blinded. | Implantation rate, pregnancy rate, and CPR | PCOS infertile women | Study gr.: 44 | Control gr.: 46 |
| Higher implantation (35.1% vs. 8.6%; p < 0.001), pregnancy (69.0% vs. 25.8%; p < 0.001), and CPR (62.1% vs. 22.6%; p = 0.002) in the treated group. |
| |||||||||||||||||||||||||||||||||||||||||||||||||||||||||||||||||
Ozkaya et al., 2011 [55] | [160] |
RCT | In vivo | Vitamins A,B,C,D, E, H; calcium; folic acid; iron; nicotinic acid; magnesium; phosphor; copper; manganese; zinc | For 45 days before serum and follicular fluid collection | Follicular fluid and serum antioxidant capacity | IVF patients | Study gr.: 26 | Placebo gr.: 30 | - Higher serum and follicular fluid antioxidant capacity were observed in the treated group. | - Higher serum vitamins C (61.6 µmol/L vs. 57.9 µmol/L in the control group; p < 0.05) and A (2.3 µmol/L vs. 1.5 µmol/L; p < 0.01); and higher follicular fluid glutathione (0.4 µmol/L vs. 0.2 µmol/L; p < 0.01) and vitamin C (84.5 µmol/L vs. 52.7 µmol/L; p < 0.01) and E (8.3 µmol/L vs. 5.0 µmol/L; p < 0.001) concentrations. | |||||||||||||||||||||||||||||||||||||||||||||||||||||||||||||||||||
Youssef et al., 2014 [56] | [159] |
RCT | In vivo |
| Vitamins A, E, C | Zinc | Molybdenum | Selenium | Biotin | Bioflavonoid | Number of MII oocytes | IVF patients with unexplained infertility | Study group: 112 | Control group: 106 | No difference in the mean number of MII oocytes between the treated (12.7) and the control group (13.2); p = 0.7. |
3. Conclusions
Antioxidants are molecules that are easily obtained from natural sources. Their mechanisms of action are diverse, but they typically enhance mitochondrial function or directly scavenge free radicals, which in turn protects mitochondria and other cellular components from oxidative stress. Given the crucial role of mitochondrial activity in oocyte maturation, fertilization, and embryo development, antioxidants may improve ART outcomes by improving oocyte quality.
In ART, antioxidant supplementation can be prescribed as an oral pre-treatment or as an adjuvant in the media during in vitro culture, although the extent of its effects have not been fully elucidated. Indeed, the majority of studies described throughout this review evaluate the indirect consequences of antioxidant supplementation on oocyte quality, evidenced by endpoints such as oocyte maturation, aneuploidy, and pregnancy rates, which may or may not be related to improved mitochondrial function. Although the direct relationship between antioxidant support and improved mitochondrial function is likely, further studies are needed to fully evaluate the consequence of antioxidant treatment on specific mitochondrial parameters, such as mitochondrial membrane potential, morphology, and distribution, as well as oxidative stress markers. In addition, there is no consensus on the optimal dose and duration of treatment, so further evaluation of these parameters is necessary before clinical application of antioxidant strategies.
Although antioxidant therapy is a promising and safe therapy, well-designed human clinical trials are needed before it is incorporated into routine clinical practice. The population that can benefit from their use must also be clearly defined, and their short- and long-term safety must be evaluated. Further, the mechanisms of each antioxidant'’s action at the molecular level and the administration protocol must be clearly defined.