Contactless structural monitoring has in recent years seen a growing number of applications in civil engineering. Indeed, the elimination of physical installations of sensors is very attractive, especially for structures that might not be easily or safely accessible, yet requiring the experimental evaluation of their conditions, for example following extreme events such as strong earthquakes, explosions, and floods. Among contactless technologies, vision-based monitoring is possibly the solution that has attracted most of the interest of civil engineers, given that the advantages of contactless monitoring can be potentially obtained thorough simple and low-cost consumer-grade instrumentations.
- experimental modal analysis
- operational modal analysis
- structural monitoring
- structural vibrations
- vision-based monitoring
- experimental modal analysis,operational modal analysis,structural monitoring,structural vibrations,vision-based monitoring
1. Brief Overview of Vision-Based Monitoring Systems
1.1. Monitoring Process
A vision-based system could consist of a set of video cameras connected to a computer installed with software having real-time processing capacity of the acquired images, or could be made by a set of video cameras whose recordings are only acquired during monitoring and later processed. Depending on the distance between the cameras and the structure to be monitored, appropriate lenses must be selected to obtain images with adequate resolution, indispensable to track the motion of the selected targets with sufficient accuracy, e.g., [1][2][3][4]. Lighting lamps could be added for conducting measurements in positions with scarce illumination or even at night.
A vision-based system could consist of a set of video cameras connected to a computer installed with software having real-time processing capacity of the acquired images, or could be made by a set of video cameras whose recordings are only acquired during monitoring and later processed. Depending on the distance between the cameras and the structure to be monitored, appropriate lenses must be selected to obtain images with adequate resolution, indispensable to track the motion of the selected targets with sufficient accuracy, e.g., [65,66,71,73]. Lighting lamps could be added for conducting measurements in positions with scarce illumination or even at night.
The monitoring process roughly consists of the following phases: (1) installation, i.e., the video cameras equipped with the selected lenses are placed on tripods in the most convenient locations, connected to the computer and synchronized; for each video camera the targets to be tracked are set (depending on post-processing procedures, they could be, for example, applied markers or existing textures in the structure surface); (2) calibration, i.e., the relationship between the pixel coordinates and the physical coordinates is obtained, usually based on known physical dimension on the object surface and its corresponding image dimension in pixels; and (3) video acquisition and processing, i.e., the videos are recorded and the motion of each target is tracked in the image sequences; as a result, the displacement time history is given as output. A schematic representation of this simple flowchart is depicted in
, with the sources of errors and uncertainties discussed in the following paragraph.
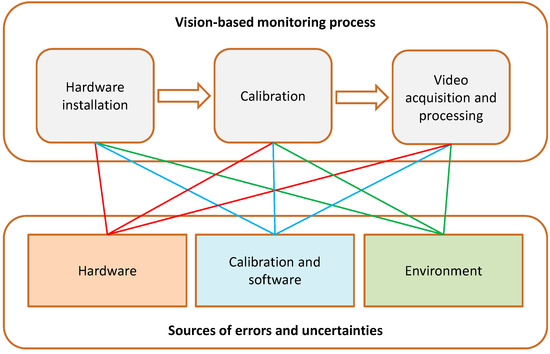
Figure 1. Diagram of the vision-based monitoring and relations with the sources of errors and uncertainties.
1.2. Errors and Uncertainties
Differently from other measurement approaches where the accuracy of the employed sensors/systems is provided by their manufacturers and generally remains stable within assigned operational conditions during a given calibration time span, the accuracy of vision-based systems cannot be related solely to the technical specifications of the video cameras. The accuracy determination in vision-based monitoring is a rather complex problem as it depends on a multifaceted combination and interaction of different parameters. The sources of errors and uncertainties in vision-based monitoring can be subdivided in three groups: (1) intrinsic to the monitoring hardware, e.g., optical distortions and aberrations in the lenses, limitations in the resolution, and performance of the sensor of the video camera; (2) relevant to the software and calibration/synchronization process, e.g., limitations in the motion tracking algorithm, synchronization lags among cameras, and round-offs in camera calibration; and (3) environmental, e.g., influence of the location where the camera is installed, vibrations induced in the camera-tripod system, variable ambient light, and non-uniform air refraction due to variable temperatures between installed cameras and the structure being monitored. These sources inevitably influence each other, for example, the resolution of the hardware influences the precision that can be achieved in the calibration, which is in turn influenced by the environmental conditions. The scheme depicted in
summarizes the possible interactions between the three phases of the vision-based monitoring process and the sources of errors and uncertainties.
Investment can be made in the hardware (high quality cameras and lenses), in up-to-date software, in efforts to access the most favorable locations for camera installation, and in accurate controls of the calibration and synchronization. Nevertheless, the variability of the environmental parameters might still jeopardize the quality of the results; this is a concern especially for long-term field monitoring as required in structural health monitoring, which faces large variations in ambient light, temperature, humidity, wind, and other possible interferences inducing vibrations in the cameras. As a consequence, these sources of errors and uncertainties have a larger impact on vision-based monitoring as compared to the case of conventional monitoring procedures when sensors are in direct contact with the object being monitored.
2. Recent Field Applications of Vision-Based Vibration Monitoring in Civil Engineering
2.1. General Overview
Many published works presenting applications of vision-based monitoring in civil engineering can be found in the technical literature. Contributions (only refereed journal articles are here considered) can be organized in three areas of monitoring applications: (1) measurements of displacements and strains under static and quasi-static loadings [5][6][7][8][9][10][11][12][13][14][15][16][17][18][19][20][21][22][23][24][25][26][27]; (2) measurements of displacement time histories in prototypes or small-scale structures in controlled environmental conditions, typically in a laboratory, [28][29][30][31][32][33][34][35][36][37][38][39][40][41][42][43][44][45][46][47][48][49][50][51][52][53][54][55][56][57][58][59]; (3) field measurements of displacement time histories in full scale structures [60][61][62][63][64][65][66][67][68][69][70][71][72][73][74][75][76][77][78][79][80][81][82][83][84][85][86][87][88][89][90][91][92][93][94][95][96][97]; (4) development of sensors using vision-based techniques [98][99][100][101][102][103][104]; and (5) field measurements of moving components, as in the case of wind turbines, e.g., [105][106][107][108]. Such a subdivision is made regardless of the adopted vision-based techniques and image processing algorithms. It should be remarked that overlaps exist between these monitoring applications, as in some cases, there are publications that, prior to field testing, illustrate preliminary laboratory validations. Hence, the proposed subdivision should be considered on the basis of the main contribution provided.
Many published works presenting applications of vision-based monitoring in civil engineering can be found in the technical literature. Contributions (only refereed journal articles are here considered) can be organized in three areas of monitoring applications: (1) measurements of displacements and strains under static and quasi-static loadings [108,109,110,111,112,113,114,115,116,117,118,119,120,121,122,123,124,125,126,127,128,129,130]; (2) measurements of displacement time histories in prototypes or small-scale structures in controlled environmental conditions, typically in a laboratory, [131,132,133,134,135,136,137,138,139,140,141,142,143,144,145,146,147,148,149,150,151,152,153,154,155,156,157,158,159,160,161,162]; (3) field measurements of displacement time histories in full scale structures [163,164,165,166,167,168,169,170,171,172,173,174,175,176,177,178,179,180,181,182,183,184,185,186,187,188,189,190,191,192,193,194,195,196,197,198,199,200]; (4) development of sensors using vision-based techniques [201,202,203,204,205,206,207]; and (5) field measurements of moving components, as in the case of wind turbines, e.g., [208,209,210,211]. Such a subdivision is made regardless of the adopted vision-based techniques and image processing algorithms. It should be remarked that overlaps exist between these monitoring applications, as in some cases, there are publications that, prior to field testing, illustrate preliminary laboratory validations. Hence, the proposed subdivision should be considered on the basis of the main contribution provided.
Attention in this review article is given to the analysis of recent results obtained in vibration (displacement time histories) monitoring of civil engineering structures and infrastructures in the field, as documented in refereed journal articles published in the last four years [80][81][82][83][84][85][86][87][88][89][90][91][92][93][94][95][96][97]. The results presented are subdivided into six structural groups: steel bridges, steel footbridges, steel structures for sport stadiums, reinforced concrete structures, masonry structures, and timber footbridge. For each field study, a short description of the monitored structure is provided, with a summary of the main information and conclusions provided in the publication. A list of the considered applications is reported in
Attention in this review article is given to the analysis of recent results obtained in vibration (displacement time histories) monitoring of civil engineering structures and infrastructures in the field, as documented in refereed journal articles published in the last four years [183,184,185,186,187,188,189,190,191,192,193,194,195,196,197,198,199,200]. The results presented are subdivided into six structural groups: steel bridges, steel footbridges, steel structures for sport stadiums, reinforced concrete structures, masonry structures, and timber footbridge. For each field study, a short description of the monitored structure is provided, with a summary of the main information and conclusions provided in the publication. A list of the considered applications is reported in
; it is observed that half of them are in the U.S.A. and that bridges/footbridges are the most recurring structures.
Table 1.
Recent field applications of vision-based vibration monitoring in civil engineering.
| Group | Structure | Country | Authors and Reference |
|---|
Table 2.
Essential information on adopted hardware, video processing, loading conditions during monitoring, and comparison with other monitoring technologies.
| Reference | Camera, Pixel Resolution, and Frame Rate (FPS) | Video Processing Algorithm | Loading Condition during Monitoring | Comparisons with Other Monitoring Technologies | ||||
|---|---|---|---|---|---|---|---|---|
| Steel bridges | Suspension bridge | U.S.A. | Feng and Feng [84] | |||||
| [84][187] | Point Grey, 1280 × 1024, 10 | [ | 187] | |||||
| Template mat. | Passage of subway trains | No direct, GPS, and radar | Truss with vertical lift | U.S.A. | Chen et al. [86 | |||
| [86][189] | ] | [189] | ||||||
| Point Grey, 800 × 600, 30 | Optical flow | Lift impact, normal traffic | Accelerom., strain gauges | Skew girder | U.K. | Xu et al. [91][194] | ||
| [91][194] | Go Pro, 1920 × 1080, 25 Imetrum, 2048 × 1088, 30 |
Template mat. Imetrum [109][87] | Passage of trains | Low cost and high-end vision-based, accelerometers | Steel footbridges | Cable-stayed bridge | U.K. | Xu et al. [90][193] |
| Suspension bridge | ||||||||
| [90][193] | Go Pro, 1920 × 1080, 30 | Template mat. | Crowd of pedestrians | Wireless accelerometers | North Ireland | |||
| [93][196] | Lydon et al. | [93] | Go Pro, 1920 × 1080, 25[196] | |||||
| Template mat. | Crowd of pedestrians | Accelerometers | Suspension bridge | U.S.A. | ||||
| [94][197] | Hoskere et al. | [94][197] | ||||||
| DJI 3840 × 2160, 30 | Optical flow | Walk, running, jumping | Accelerometers | Vertical truss frames | U.S.A. | |||
| [96][199] | Dong et al. | [96][199] | ||||||
| Low cost, 1920 × 1080, 60 | Feature mat. | Walk, running, jumping | Accelerometers | Steel structures for sport stadiums | ||||
| [81 | Grandstands | ][82U.S.A. | ][95][184,185,198]Khuc and Catbas [81][82][184[95],185 | Canon, N/A, 30 and 60,198] | ||||
| Feature mat. | Superstructure cables | U.S.A. | Feng et al. [83][186] | |||||
| Reinforced concrete structures | Deck on arch footbridge | U.S.A. | Shariati and Schumacher [80][183] | |||||
| Five-story building | U.S.A. | Harvey and Elisha [87][190] | ||||||
| Crowd during game | Accelerom., displ. transd. | |||||||
| [83][186] | Point Grey, 1280 × 1024, 50 | Template mat. | Operational, shaken | Load cell | ||||
| [80][183] | Canon, N/A, 60 | Motion magn. | Pedestrian jumping | No direct, vision-based | ||||
| [87][190] | N/A, 1056 × 720, 25 | Feature mat. | Outdoor shake table | Accelerometers | Beam-slab bridge | North Ireland | ||
| [93][196] | Lydon et al. | [93][196] | ||||||
| Go Pro, 1920 × 1080, 25 | Template mat. | Normal vehicular traffic | No direct, integr. fiber optics | Masonry structures | Heritage ruins and arch bridge | |||
| [ | Italy | 88][191] | Fioriti et al. [88 | N/A] | Motion magn.[191] | |||
| Tram vibrations, wind | Velocimeters | Arch bridge | U.K. | |||||
| [89][ | Acikgoz et al. | [89][192] | ||||||
| 192] | Imetrum, N/A, 50 | Imetrum [109][87] | Passage of trains | Fiber optics | Arch bridge | Australia | ||
| [92][195] | Dhanasekar et al. | [92][195] | ||||||
| Sony, 1936 × 1216, 50 | Dantec | [110][85] | Passage of trains | No direct, numerical | Timber footbridge | Deck-stiffened arch | Greece | Fradelos et al. [97][200] |
For each reference, some essential information on the adopted hardware is provided in
, alongside video processing (optical flow, template matching, feature matching, motion magnification, and proprietary commercial software), loading condition during monitoring, as well as comparisons with monitoring using other technologies. In this way,
and
are supposed to serve as a guide to the following paragraphs, each dedicated to one of the six structural groups, presented in the same order used in the tables.
It is anticipated that comparisons in all cases provided good correlations between vision-based monitoring and the other considered technologies, with one exception being the steel footbridge (vertical truss frames) tested by Dong et al. [96], where differences between accelerometers and vision-based measurements were not negligible. It should be remarked that, in four cases, no direct comparisons were made: Shariati and Schumacher [80], as well as Feng and Feng [84], compared the magnitudes of the measurements to those obtained in previous tests, concluding that such comparisons were favorable; in Dhanasekar et al. [92], the outcomes of the experimental monitoring were satisfactory compared with numerical simulations in terms of magnitude of the monitored structural parameters; and in Lydon et al. [93], vision-based monitoring was part of an integrated monitoring system that included fiber optics with the objectives to complement the two systems.
It is anticipated that comparisons in all cases provided good correlations between vision-based monitoring and the other considered technologies, with one exception being the steel footbridge (vertical truss frames) tested by Dong et al. [199], where differences between accelerometers and vision-based measurements were not negligible. It should be remarked that, in four cases, no direct comparisons were made: Shariati and Schumacher [183], as well as Feng and Feng [187], compared the magnitudes of the measurements to those obtained in previous tests, concluding that such comparisons were favorable; in Dhanasekar et al. [195], the outcomes of the experimental monitoring were satisfactory compared with numerical simulations in terms of magnitude of the monitored structural parameters; and in Lydon et al. [196], vision-based monitoring was part of an integrated monitoring system that included fiber optics with the objectives to complement the two systems.
2.2. Steel Bridges
Feng and Feng [84] presented the outcomes of vision-based field monitoring of the Manhattan Bridge (New York, NY, USA) using a single camera for remote real-time displacement measurements at one single point and simultaneously at multiple points. The Manhattan Bridge, opened to traffic in 1909, is a suspension bridge spanning the East River in New York City, connecting Manhattan and Brooklyn; the main span is 448 m long; the deck is 36.5 m wide, including seven lanes in total and four subway lanes. The camera was placed on stable stone steps around 300 m away from the bridge mid-span and the video recording was made using a frame rate of 10 FPS. The known dimensions (7.2 m) of the vertical trusses were used for camera calibration. Displacement responses at one single point at the mid-span region were measured during the passage of subway trains, having estimated the scale factor as 20.5 mm/pixel. The authors commented that the dynamic displacement response was similar to that measured by GPS and interferometric radar systems in previous studies. Then, by zooming out the lens to obtain a large field of view (FOV), i.e., the area that is visible in the image, three points at the mid-span region were selected and a scaling factor of about 36 mm/pixel was estimated. The authors commented that such measures displayed more fluctuations, especially for small displacement amplitudes, as a consequence of the larger FOV, determining a decreased measurement resolution compared with the single point case. In addition, the authors studied the influence of the camera vibration during the field measurements. Such a test was conducted by looking at a building in the background and tracking its apparent motion; the camera motion was estimated with the assumption that the building was not moving. The authors concluded that, compared with the bridge displacement, the camera motion was insignificant.
Feng and Feng [187] presented the outcomes of vision-based field monitoring of the Manhattan Bridge (New York, NY, USA) using a single camera for remote real-time displacement measurements at one single point and simultaneously at multiple points. The Manhattan Bridge, opened to traffic in 1909, is a suspension bridge spanning the East River in New York City, connecting Manhattan and Brooklyn; the main span is 448 m long; the deck is 36.5 m wide, including seven lanes in total and four subway lanes. The camera was placed on stable stone steps around 300 m away from the bridge mid-span and the video recording was made using a frame rate of 10 FPS. The known dimensions (7.2 m) of the vertical trusses were used for camera calibration. Displacement responses at one single point at the mid-span region were measured during the passage of subway trains, having estimated the scale factor as 20.5 mm/pixel. The authors commented that the dynamic displacement response was similar to that measured by GPS and interferometric radar systems in previous studies. Then, by zooming out the lens to obtain a large field of view (FOV), i.e., the area that is visible in the image, three points at the mid-span region were selected and a scaling factor of about 36 mm/pixel was estimated. The authors commented that such measures displayed more fluctuations, especially for small displacement amplitudes, as a consequence of the larger FOV, determining a decreased measurement resolution compared with the single point case. In addition, the authors studied the influence of the camera vibration during the field measurements. Such a test was conducted by looking at a building in the background and tracking its apparent motion; the camera motion was estimated with the assumption that the building was not moving. The authors concluded that, compared with the bridge displacement, the camera motion was insignificant.
2.3. Steel Footbridges
Xu et al. [90] illustrated the activities for field vision-based monitoring of the Baker Bridge, a cable-stayed footbridge spanning 109 m over the A379 dual-carriageway in Exeter (UK). The bridge provides cyclist and pedestrian access to the Sandy Park Stadium and experiences heavy pedestrian traffic on match days. The bridge comprises a single A-shaped tower that supports the continuous steel deck over a simple support at the pylon cross-beam and via seven pairs of stay cables. Because of the range of frequencies of its first vibration modes, the bridge is prone to noticeable vibration response owing to pedestrian traffic. A consumer-grade camera was mounted on the top of a tripod at the central reservation of the A379 carriageway below and approximately 55.30 m from the bridge tower. Video recording was done at 30 FPS. Camera calibration was set using the known structural dimensions from the as-built drawings, using a narrow FOV setting. Four triaxial wireless accelerometers were installed in the bridge deck to validate the results obtained from processing the images acquired by the video camera. The monitoring of the bridge included periods when large crowds of spectators crossed the deck. The results in terms of identified modal frequencies of the bridge deck as obtained from vision-based monitoring accurately matched those obtained for the contact accelerometers. In addition, measurements of cable vibration using the vision-based system were performed and compared to the results from two triaxial wireless accelerometers installed on the cables. The authors concluded that the vision-based system works better to capture the lower modal frequencies of cables, whereas the accelerometers provide reliable estimations of higher frequency modes. However, the multipoint deformation data obtained using the vision system proved to be effective for tracking cable dynamic properties at the same time as bridge deformation, allowing for the effect of varying load on cable tensions to be observed. In this way, a powerful diagnostic capability for larger cable-supported structures was achieved.
Xu et al. [193] illustrated the activities for field vision-based monitoring of the Baker Bridge, a cable-stayed footbridge spanning 109 m over the A379 dual-carriageway in Exeter (UK). The bridge provides cyclist and pedestrian access to the Sandy Park Stadium and experiences heavy pedestrian traffic on match days. The bridge comprises a single A-shaped tower that supports the continuous steel deck over a simple support at the pylon cross-beam and via seven pairs of stay cables. Because of the range of frequencies of its first vibration modes, the bridge is prone to noticeable vibration response owing to pedestrian traffic. A consumer-grade camera was mounted on the top of a tripod at the central reservation of the A379 carriageway below and approximately 55.30 m from the bridge tower. Video recording was done at 30 FPS. Camera calibration was set using the known structural dimensions from the as-built drawings, using a narrow FOV setting. Four triaxial wireless accelerometers were installed in the bridge deck to validate the results obtained from processing the images acquired by the video camera. The monitoring of the bridge included periods when large crowds of spectators crossed the deck. The results in terms of identified modal frequencies of the bridge deck as obtained from vision-based monitoring accurately matched those obtained for the contact accelerometers. In addition, measurements of cable vibration using the vision-based system were performed and compared to the results from two triaxial wireless accelerometers installed on the cables. The authors concluded that the vision-based system works better to capture the lower modal frequencies of cables, whereas the accelerometers provide reliable estimations of higher frequency modes. However, the multipoint deformation data obtained using the vision system proved to be effective for tracking cable dynamic properties at the same time as bridge deformation, allowing for the effect of varying load on cable tensions to be observed. In this way, a powerful diagnostic capability for larger cable-supported structures was achieved.
2.4. Steel Structures for Sport Stadiums
Khuc and Catbas [81][82][95] illustrated a campaign of field vision-based monitoring of the steel superstructures of a football stadium in the USA with approximately 45,000 seating capacity that exhibited considerable vibration levels, especially at the sections of the highly active local team supporters. The vision-based method and framework as implemented by the authors was verified under different experimental conditions including altering light conditions, different camera locations (distances and angles), and camera frame rates (30 and 60 FPS). Specifically, a beam under the grandstand was selected for monitoring predetermined measurement points. A displacement potentiometer and an accelerometer were installed for comparative purposes. The contact sensors and camera recorded the structural vibrations synchronously during periods of intense crowd motion throughout football games. The authors concluded that the results from vision-based measurements were consistent with those from contact measurements and the first three operational modal frequencies under a human jumping load were almost the same. In addition, the authors commented that, although quite accurate results for defined measurement ranges and conditions could be achieved through a completely non-contact vision-based implementation with low-cost hardware, some issues such as data storage requirement for clips and images, processing time for image data, and limitation for horizontal displacement measurement needed to be addressed in future developments.
Khuc and Catbas [184,185,198] illustrated a campaign of field vision-based monitoring of the steel superstructures of a football stadium in the USA with approximately 45,000 seating capacity that exhibited considerable vibration levels, especially at the sections of the highly active local team supporters. The vision-based method and framework as implemented by the authors was verified under different experimental conditions including altering light conditions, different camera locations (distances and angles), and camera frame rates (30 and 60 FPS). Specifically, a beam under the grandstand was selected for monitoring predetermined measurement points. A displacement potentiometer and an accelerometer were installed for comparative purposes. The contact sensors and camera recorded the structural vibrations synchronously during periods of intense crowd motion throughout football games. The authors concluded that the results from vision-based measurements were consistent with those from contact measurements and the first three operational modal frequencies under a human jumping load were almost the same. In addition, the authors commented that, although quite accurate results for defined measurement ranges and conditions could be achieved through a completely non-contact vision-based implementation with low-cost hardware, some issues such as data storage requirement for clips and images, processing time for image data, and limitation for horizontal displacement measurement needed to be addressed in future developments.
2.5. Reinforced Concrete Structures
Shariati and Schumacher [80] documented the field vision-based monitoring of the Streicker Bridge, a footbridge in the Princeton University campus (New Jersey, USA) with a straight main deck section supported by a steel truss system underneath and four curved ramps leading up to the straight sections. Structurally, the main span is a deck-stiffened arch and the legs are curved continuous girders supported by steel columns. The legs are horizontally curved and the shape of the main span follows this curvature. The arch and columns are weathering steel, while the main deck and legs are made of reinforced post-tensioned concrete. A consumer-grade camera with a zoom lens was used to acquire a 60 FPS video of one of the ramps while a number of volunteers jumped up and down on it. A target mounted on the edge of the bridge slab was used to track displacement time histories. Such a target was set up by a research team from Columbia University that also investigated the same footbridge with their own video-based monitoring system [99] a few years earlier. In addition, the Streicker Bridge was equipped with two fiber-optic sensing technologies, i.e., discrete long-gauge sensing, based on fiber Bragg-Gratings, and truly-distributed sensing, based on Brillouin optical time domain analysis; both sensors were embedded in concrete during the construction. The natural frequencies obtained by the authors in their tests were found to be the same as those measured by the fiber-optic measurement system and by the other vision-based method in [99]. In addition to the frequency contents, the two vision-based measurements gave comparable amplitude of displacements, showing the replicability of the obtained results.
Shariati and Schumacher [183] documented the field vision-based monitoring of the Streicker Bridge, a footbridge in the Princeton University campus (New Jersey, USA) with a straight main deck section supported by a steel truss system underneath and four curved ramps leading up to the straight sections. Structurally, the main span is a deck-stiffened arch and the legs are curved continuous girders supported by steel columns. The legs are horizontally curved and the shape of the main span follows this curvature. The arch and columns are weathering steel, while the main deck and legs are made of reinforced post-tensioned concrete. A consumer-grade camera with a zoom lens was used to acquire a 60 FPS video of one of the ramps while a number of volunteers jumped up and down on it. A target mounted on the edge of the bridge slab was used to track displacement time histories. Such a target was set up by a research team from Columbia University that also investigated the same footbridge with their own video-based monitoring system [202] a few years earlier. In addition, the Streicker Bridge was equipped with two fiber-optic sensing technologies, i.e., discrete long-gauge sensing, based on fiber Bragg-Gratings, and truly-distributed sensing, based on Brillouin optical time domain analysis; both sensors were embedded in concrete during the construction. The natural frequencies obtained by the authors in their tests were found to be the same as those measured by the fiber-optic measurement system and by the other vision-based method in [202]. In addition to the frequency contents, the two vision-based measurements gave comparable amplitude of displacements, showing the replicability of the obtained results.
2.6. Masonry Structures
Fioriti et al. [88] presented monitoring of two cultural heritage constructions in Italy, i.e., the temple of Minerva Medica, a ruined nymphaeum of the ancient Imperial Rome, and Ponte delle Torri in Spoleto, an aqueduct and pedestrian bridge with multiple arches having a total length of 230 m and piers of height up to 80 m, completed in the Middle Ages and possibly built over Roman ruins. The Minerva Medica ruins are very close to a tramway producing strong vibrations whose effects were clearly evident in the video taken using a low-cost consumer grade camera at a distance of 9 m. Modal analysis by motion magnification of the field video recordings was performed and compared to the results obtained through conventional contact velocimeters; the differences were limited to just a few percentage points. Satisfactory results were also achieved for the Ponte delle Torri, despite the small level of structural excitation due to the wind action and the low resolution of the adopted video cameras. The authors commented that such results constituted a remarkable starting point for future experimentations and improvements. Indeed, monitoring the ambient vibration of a massive multiple-arch masonry structure under normal conditions through vision-based monitoring appears to be a major successful case study, considering the oppositions often found in installing contact sensors in cultural heritage.
Fioriti et al. [191] presented monitoring of two cultural heritage constructions in Italy, i.e., the temple of Minerva Medica, a ruined nymphaeum of the ancient Imperial Rome, and Ponte delle Torri in Spoleto, an aqueduct and pedestrian bridge with multiple arches having a total length of 230 m and piers of height up to 80 m, completed in the Middle Ages and possibly built over Roman ruins. The Minerva Medica ruins are very close to a tramway producing strong vibrations whose effects were clearly evident in the video taken using a low-cost consumer grade camera at a distance of 9 m. Modal analysis by motion magnification of the field video recordings was performed and compared to the results obtained through conventional contact velocimeters; the differences were limited to just a few percentage points. Satisfactory results were also achieved for the Ponte delle Torri, despite the small level of structural excitation due to the wind action and the low resolution of the adopted video cameras. The authors commented that such results constituted a remarkable starting point for future experimentations and improvements. Indeed, monitoring the ambient vibration of a massive multiple-arch masonry structure under normal conditions through vision-based monitoring appears to be a major successful case study, considering the oppositions often found in installing contact sensors in cultural heritage.
2.7. Timber Footbridge
Fradelos et al. [97] illustrated the field vision-based monitoring of the Kanellopoulos timber arch footbridge (Patras, Greece), 30 m long and 2.9 m wide, made of glulam wood and metallic elements. The omission of X-bracing below the deck and poor construction of the metal X-bracing at its roof made the footbridge prone to lateral oscillations. The bridge was monitored using satellite systems, robotic theodolites, and accelerometers. Videos were made during testing using common low-cost cameras without the initial intention for vision-based monitoring. Such video recordings were later examined and used to try to estimate the dynamic horizontal deflections of specific points of the footbridge. It was shown that the analysis of low-cost video images using a simple approximate technique permitted the reconstruction of the movements of the bridge and the computation of some of its structural characteristics. This result was possible under ideal conditions: the movement was two-dimensional, displacements of the selected target points were characterized by a signal exceeding the pixel resolution, the camera was in a fixed position and the video image covered stable points defining a reference system, and structural elements near the selected target points allowed to scale the photo in the two examined axes. As a result, the first lateral natural frequency of the footbridge obtained from video processing differed by less than 2% from that estimated using accelerometers and geodetic sensors.
Fradelos et al. [200] illustrated the field vision-based monitoring of the Kanellopoulos timber arch footbridge (Patras, Greece), 30 m long and 2.9 m wide, made of glulam wood and metallic elements. The omission of X-bracing below the deck and poor construction of the metal X-bracing at its roof made the footbridge prone to lateral oscillations. The bridge was monitored using satellite systems, robotic theodolites, and accelerometers. Videos were made during testing using common low-cost cameras without the initial intention for vision-based monitoring. Such video recordings were later examined and used to try to estimate the dynamic horizontal deflections of specific points of the footbridge. It was shown that the analysis of low-cost video images using a simple approximate technique permitted the reconstruction of the movements of the bridge and the computation of some of its structural characteristics. This result was possible under ideal conditions: the movement was two-dimensional, displacements of the selected target points were characterized by a signal exceeding the pixel resolution, the camera was in a fixed position and the video image covered stable points defining a reference system, and structural elements near the selected target points allowed to scale the photo in the two examined axes. As a result, the first lateral natural frequency of the footbridge obtained from video processing differed by less than 2% from that estimated using accelerometers and geodetic sensors.