BIO-Argo float (chlorophyll a (Chl-a), temperature, and salinity profiles) and remote sensing data (Chl-a, photosynthetic available radiation (PAR), and wind) located south of the Kuroshio current near Shikoku from September 2018 to May 2019 were used to study phytoplankton bloom and their mechanisms of development in open oceans.
- remote sensing data
- phytoplankton bloom
1. Introduction
Chlorophyll a (Chl-a) concentration is affected by the changes in intracellular pigment levels driven by light and nutrients. Recently, satellite-estimated phytoplankton carbon has been used as an indicator of phytoplankton biomass [1][2][3]. The modulation of phytoplankton blooms in spring promote the annual cycle of phytoplankton in large regions of the world’s oceans, which has a dramatic effect on both high trophic levels and carbon export [4][5][6]. Due to the challenges in the long-term investigation of phytoplankton dynamics, a more accurate understanding of the mechanism that triggers these blooms in open oceans is needed [7].
The mechanism that triggers blooms has been an important issue since the early work of Riley [8] and Sverdrup [9]; however, the conclusions are still uncertain and reconciliation between different theories is lacking. At present, there are three major explanations for bloom initiations: the critical depth hypothesis (CDH) [9], critical turbulence hypothesis (CTH) [10], and dilution-recoupling hypothesis (DRH) [11][12]. The mechanism of the spring bloom was initially explained using CDH [9]. According to this theory, strong ocean convection and turbulence can deepen the mixing layer in winter, which can carry abundant nutrients into the mixed layer, thus increasing the phytoplankton concentrations. When spring arrives, the stratification of the interior ocean strengthens due to the warming of surface waters. As a result, the mixed layer depth becomes shallower than the critical depth, so the phytoplankton increases significantly under conditions of abundant carbon storage and light seen during spring. Alternatively, the CTH theory suggests that at the end of winter, wind and net cooling decrease, which may weaken the intensity of turbulent mixing in the ocean upper layer, and thus, the residence time of phytoplankton increases in the euphotic layer [10]. This can promote the propagation of phytoplankton and induce phytoplankton blooms. Finally, the DRH theory proposed by Behrenfeld [11] is an ecological-based framework. In this framework, the decoupling of phytoplankton growth and loss rates is the main factor controlling the bloom. The dilution that occurs during winter deep mixing disturbs predator-prey interactions [11][13]. The above hypotheses suggest that bloom dynamics is closely related to detailed physical and biological processes [9][10][11][12] and, therefore, it is necessary to identify these mechanisms to fully understand the bloom dynamics.
Shikoku Basin is an oligotrophic subtropical ocean [14], where nutrients in the euphotic zone are supplied by vertical convection only in winter [15]. Therefore, ocean high primary productivity may occur in winter and spring. Large changes in the winter and spring biomass of phytoplankton and macroplankton can be observed over the year, which can be attributed to atmospheric forcing factors, and physical and biological processes [15]. In addition, eddies and other mesoscale circulation features, such as those located south of the Kuroshio current near Shikoku, can be found throughout the ocean. Downwelling anticyclone eddies can significantly affect the biogeochemical properties in open ocean waters. For example, nitrate can be transferred and enriched, and driven downward by anticyclone eddies [5][16]. In this work, we use BIO-Argo float and satellite observations to study the winter-spring bloom triggering mechanism and the development of blooms, and the physical and biological processes south of Shikoku.
2. Distribution of Chl-a Concentration
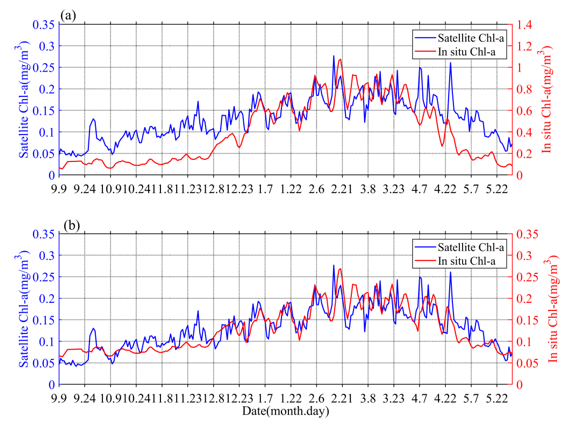
The obtained values of surface Chl-a based on BIO-Argo correlated well (RPearson = 0.65, Rcrit = 0.12 (alpha = 0.05, n = 263)) with the satellite-derived daily Chl-a over the sampling site (Figure 21a). However, the values were somewhat different in magnitude. The BIO-Argo observations may be overestimated and may represent the same change trend with satellite-derived daily Chl-a. Chl-a was further corrected based on match-up satellite-derived daily Chl-a using an exponential function (Chl-a = 0.2534 * Chl-a argo 0.49) [17]; the result (RPearson = 0.81, Rcrit = 0.12 (alpha = 0.05, n = 263)) is shown in Figure 2b. In the following content, our research is mainly based on BIO-Argo float observations (temperature, salinity, corrected Chl-a).
Figure 21. The time series (a) of original surface Chl-a in situ data (red) and satellite observations (blue), the time series (b) of corrected surface Chl-a in situ data (red) and satellite observations (blue).
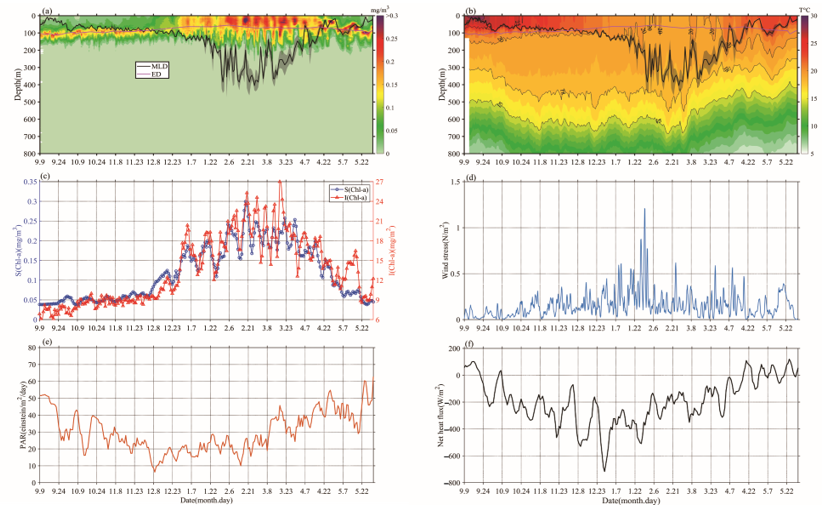
Chl-a concentrations’ seasonal cycles of variable amplitude were found; in Figure 3a, Chl-a peaks typically range from 0.15 to 0.35 mg/m3 in winter-spring. This order of magnitude was similar to that of Rumyantseva et al. [18]. When the Chl-a concentration first reaches 0.15 mg/m3, the bloom starts each year and can last for up to 24 days. The variations of Chl-a south of the Kuroshio current to the south of Shikoku (Figures 1 and 3), at a water depth of 800 m, clearly display seasonal cycles of blooms (>0.15 mg/m3) from September 2018 to May 2019, with high Chl-a in winter and spring. The peak (i.e., blooming in winter and spring) of Chl-a (Figure 3c) typically appears in December–May. There were seasonal variations evident in the magnitude of Chl-a concentration. The phytoplankton bloom (Chl-a >0.15 mg/m3) first appeared at the end of December; that is, one month after the initial increase in surface Chl-a (caused by the erosion of the deep chlorophyll maximum) and the bloom decayed in April–May. During the period before the coming of winter, S (Chl-a) and I (Chl-a) were approximately 0.05 mg/m3 and 9 mg/m2, respectively (Figure 3c), and then increased gradually to 0.3 mg/m3 and 27 mg/m2, respectively, with the mixed layer deepening in winter-spring. Compared with the average of Chl-a and Zmixed (0.13 mg/m3 and 105 m), higher (lower) Chl-a generally correspond to a deeper (shallower) mixed layer. Notably, Chl-a in May was lower than before the winter-spring blooms.
Figure 32. The variations of (a) Chl-a concentration (mg/m3) and (b) temperature, overlaid lines represent mixed layer depth (MLD; ± std; black) and daily euphotic depth (ED; red), (c) Bio-Argo mean surface Chl-a concentration, calculated as an average value between 0 and 20 m (blue), Bio-Argo integrated Chl-a inventory (red), (d) daily wind stress, (e) surface photosynthetic available radiation (PAR), and (f) net heat flux.
3. Distribution of Ocean Conditions during Winter-Spring Blooms
The mixed layer gradually deepened from the end of September until mid-February, and then became deeper than Zeu and remained consistent, until a rapid transition to the shallow seasonal stratification was observed at the end of March (Figure 3a). During this blooming period, a lower SST (Sea Surface Temperature) coincided with the bloom, Zeu, and PAR reduced slightly, and the surface net heat flux was mainly negative (Figure 3b,e,f). Surface wind stress was stronger in winter and early spring, and generally positive trends of S (Chl-a) and I (Chl-a) were present at that time, which is consistent with gradually increasing surface heat flux and PAR (Figure 3c,e,f) [18].
References
- Mao, Z.; Mao, Z.; Jamet, C.; Linderman, M.A.; Wang, Y.; Chen, X. Seasonal Cycles of Phytoplankton Expressed by Sine Equations Using the Daily Climatology from Satellite-Retrieved Chlorophyll-a Concentration (1997–2019) Over Global Ocean. Remote Sens. 2020, 12, 2662, doi:10.3390/rs12162662.
- Behrenfeld, M.J.; Boss, E. Beam attenuation and chlorophyll concentration as alternative optical indices of phytoplankton biomass. Mar. Res. 2006, 64, 431–451, doi:10.1357/002224006778189563.
- Behrenfeld, M.J.; Boss, E.; Siegel, D.A.; Shea, D.M. Carbon‐based ocean productivity and phytoplankton physiology from space. Biogeochem. Cycles 2005, 19, doi:10.1029/2004gb002299.
- Kodama, T.; Wagawa, T.; Ohshimo, S.; Morimoto, H.; Iguchi, N.; Fukudome, K.-I.; Goto, T.; Takahashi, M.; Yasuda, T. Improvement in recruitment of Japanese sardine with delays of the spring phytoplankton bloom in the Sea of Japan. Oceanogr. 2018, 27, 289–301, doi:10.1111/fog.12252.
- Omand, M.M.; D’Asaro, E.A.; Lee, C.M.; Perry, M.J.; Briggs, N.; Cetinić, I.; Mahadevan, A. Eddy-driven subduction exports particulate organic carbon from the spring bloom. Science 2015, 348, 222–225, doi:10.1126/science.1260062.
- Koeller, P.; Fuentes-Yaco, C.; Platt, T.; Sathyendranath, S.; Richards, A.; Ouellet, P.; Orr, D.; Skúladóttir, U.; Wieland, K.; Savard, L.; et al. Basin-scale coherence in phenology of shrimps and phytoplankton in the North Atlantic Ocean. Science 2009, 324, 791–793, doi:10.1126/science.1170987.
- Lehahn, Y.; D’Ovidio, F.; Koren, I. A satellite-based Lagrangian view on phytoplankton dynamics. Rev. Mar. Sci. 2018, 10, 99–119, doi:10.1146/annurev-marine-121916-063204.
- Riley, G. The relationship of vertical turbulence and spring diatom flowering. Mar. Res. 1942, 5, 67–87.
- Sverdrup, H.U. On conditions for the vernal blooming of phytoplankton. ICES J. Mar. Sci. 1953, 18, 287–295, doi:10.1093/icesjms/18.3.287.
- Taylor, J.R.; Ferrari, R. Shutdown of turbulent convection as a new criterion for the onset of spring phytoplankton blooms. Oceanogr. 2011, 56, 2293–2307, doi:10.4319/lo.2011.56.6.2293.
- Behrenfeld, M.J. Abandoning Sverdrup’s critical depth hypothesis on phytoplankton blooms. Ecology 2010, 91, 977–989, doi:10.1890/09-1207.1.
- Behrenfeld, M.J.; Boss, E.S. Resurrecting the ecological underpinnings of ocean plankton blooms. Rev. Mar. Sci. 2014, 6, 167–194, doi:10.1146/annurev-marine-052913-021325.
- Behrenfeld, M.J.; Doney, S.C.; Lima, I.; Boss, E.S.; Siegel, D.A. Annual cycles of ecological disturbance and recovery underlying the subarctic Atlantic spring plankton bloom. Biogeochem. Cycles 2013, 27, 526–540, doi:10.1002/gbc.20050.
- I Goes, J.; Gomes, H.D.R.; Limsakul, A.; Balch, W.M.; Saino, T. El Niño related interannual variations in biological production in the North Pacific as evidenced by satellite and ship data. Oceanogr. 2001, 49, 211–225, doi:10.1016/s0079-6611(01)00023-4.
- Limsakul, A.; Saino, T.; Midorikawa, T.; I Goes, J. Temporal variations in lower trophic level biological environments in the northwestern North Pacific Subtropical Gyre from 1950 to 1997. Oceanogr. 2001, 49, 129–149, doi:10.1016/s0079-6611(01)00019-2.
- Guo, M.; Chai, F.; Xiu, P.; Li, S.; Rao, S. Impacts of mesoscale eddies in the South China Sea on biogeochemical cycles. Ocean Dyn. 2015, 65, 1335–1352, doi:10.1007/s10236-015-0867-1.
- Xing, X.; Wells, M.L.; Chen, S.; Lin, S.; Chai, F. Enhanced winter carbon export observed by BGC-Argo in the Northwest Pacific Ocean. Geophys. Res. Lett. 2020, 47, e2020GL089847.
- Rumyantseva, A.; Henson, S.A.; Martin, A.; Thompson, A.F.; Damerell, G.M.; Kaiser, J.; Heywood, K.J. Phytoplankton spring bloom initiation: The impact of atmospheric forcing and light in the temperate North Atlantic Ocean. Prog. Oceanogr. 2019, 178, 102202.


