Sleep is vital for one’s general well-being, but is often neglected, which has led to an increase in sleep disorders worldwide. Indicators of sleep disorders, such as sleep interruptions, extreme daytime drowsiness, or snoring, can be detected with sleep analysis. However, sleep analysis relies on visuals conducted by experts, and is susceptible to inter- and intra-observer variabilities. One way to overcome these limitations is to support experts with a programmed diagnostic tool (PDT) based on artificial intelligence for timely detection of sleep disturbances. Artificial intelligence technology, such as deep learning (DL), ensures that data are fully utilized with low to no information loss during training.
- sleep disorder,obstructive sleep disorder,overnight polysomnogram,EEG,EMG,ECG,HRV signals,deep learning
1. Introduction
Sleep is crucial for the maintenance and regulation of various biological functions at a molecular level [1], which helps humans to restore physical and mental wellbeing and proper brain function during the day [2]. There are two primary types of sleep: non-rapid eye movement (NREM) and rapid eye movement (REM) sleep. NREM sleep comprises four stages, after which, it continues into the REM sleep stage. NREM and REM sleep stages are connected and cyclically alternated through the sleep process wherein unbalanced cycling or the absence of sleep stages give rise to sleep disorders [3]. Unfortunately, sleep disorders, which lead to poor sleep quality, are often neglected [4]. Stranges et al. [4] [4] highlighted that sleep-related problems is a looming global health issue. In their study, datasets from the World Health Organization (WHO) and International Network for the Demographic Evaluation of Populations and Their Health (INDEPTH) were used to investigate the prevalence of sleep problems in low-income countries. It was reported that 16.6% of the adult population, which amounts to approximately 150 million, have sleep problems and current trends indicate that this figure will increase to 260 million by 2030.
To date, it is mandatory that sleep stage scoring is done manually by human experts [5][6][5,6]. However, human experts have limited capacity to handle slow changes in background electroencephalography (EEG) and learn the different rules to score sleep stages for various polysomnogram (PSG) recordings [6]. Furthermore, evaluations by human experts are prone to inter- and intra-observer variabilities that can negatively affect the quality of sleep stage scoring [7]. Other important factors affecting sleep stage scoring are patient convenience and diagnosis cost. As such, a sleep lab is a highly controlled environment that requires dedicated facilities and highly trained personnel. Hence, sleep labs tend to be in urban centers and patients must travel there to spend one or multiple nights in the facility. These factors make sleep labs inconvenient for patients and the cost per diagnosis is high. Other diagnostic methods, such as portable monitoring devices for sleep stages, exhibit some advantages, such as enhancing access to patients, low cost, and user-friendliness. However, these advantages are outweighed by several disadvantages, such as having diagnostic limitations, failure of device, reliability concerns, and underestimating the apnea/hypopnea index, amongst others [8]. To improve the situation requires a fundamental change in the sleep stage scoring process. We need machines to replace the labor carried out by human experts. This can only be done with systems that understand sleep stages in much of the same way as human experts do. Deep learning (DL) is hailed as a method to mechanize knowledge work, such as sleep stage scoring. However, before we join and adopt this technology, it is prudent to investigate both capabilities and limitations of current DL methods.
2. Sleep Stages Classification Using DL Models
2.1. Different Stages of Sleep
According to Rechtschaffen and Kales (R and K) [9][51], humans can experience six discrete stages during sleep: (1) wakefulness (W), (2) rapid eye movement (REM) sleep, and (3) four stages of non-REM (NREM) sleep (S1 to S4) [10][52]. Based on the sleep electroencephalogram (EEG) characteristics, W occurs when the brain is most active, which is represented by high frequency of alpha rhythms. In the NREM sleep, these alpha rhythms eventually diminish when entering the S1 wherein theta rhythm dominates instead. In the S2, sleep spindles and occasional K-complex waveform will appear. The K-complex waveform usually lasts for approximately 1 to 2 s. The S3 sleep occurs when low frequency delta rhythms appear intermittently and eventually, they dominate in the S4 sleep. Finally, REM sleep usually follows after the S4 sleep. In the REM sleep, theta rhythms resurface again, but unlike in the S1 sleep, theta rhythms are accompanied with EEG flattening [10][52]. Following the guidelines from American Academy of Sleep Medicine (AASM), the S3 and S4 sleep stages can be merged into one sleep stage S3, because of the similarity in their characteristics [11][21]. Since the delta rhythms are the slowest EEG waves, S3 and S4 sleep stages are known as Slow Wave Sleep (SWS) or the deep sleep. Thus, most sleep classification studies are based on five: W, S1, S2, S3, and REM sleep stages, instead of six (Figure 15).
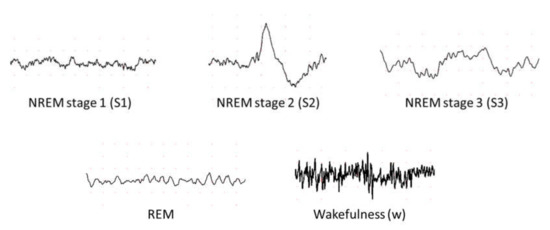
Figure 15.
Examples of electroencephalography (EEG) signals in different sleep stages.
2.2. Sleep Databases
Eight main sleep databases have been used for automated sleep stage classifications. Five of the databases are free to download from PhysioNet [12][53], namely the Sleep-EDF [13][54], the expanded Sleep-EDF [13][54], the St. Vincent’s University Hospital/University College Dublin Sleep Apnea Database (UCD) [12][53], the Sleep Heart Health Study (SHHS) [14][15][55,56], and the Massachusetts Institute of Technology-Beth Israel Hospital (MIT-BIH) [16][57] database. The ISRUC-Sleep datasets [17][58] can be downloaded from the official websites. Permission is required to obtain the sleep datasets from the Montreal Archive of Sleep Studies (MASS) [18][59].
The PSG recordings, in most of the sleep databases, are scored according to R and K rules [9][51], wherein scoring is done based on wakefulness, NREM sleep and REM sleep. NREM sleep is then subdivided into four stages (S1 to S4). Exceptions are ISRUC and MASS which follow the AASM guideline and partition the recordings into five sleep stages instead of six [11][21].
2.3. DL Techniques Used in Automatic Sleep Stage Classification
The development of a program diagnostic tool (PDT) for automatic sleep stage classification using DL techniques is shown in Figure 26. First, PSG recordings have to be pre-processed to achieve standardization or normalization. Depending on the requirement and architecture of the proposed DL model, additional steps to convert the PSG recordings into the right input format is required; for example, converting one-dimensional (1D) signals into a two-dimensional (2D) format to train 2D-CNN models. Subsequently, the pre-processed signals are split into training, validation, and testing sets. The training set is used to train the model, the validation set is to fine-tune the model, and the testing set is used to evaluate the model’s performance. A well-trained model can accurately classify PSG recordings into the five sleep stages.
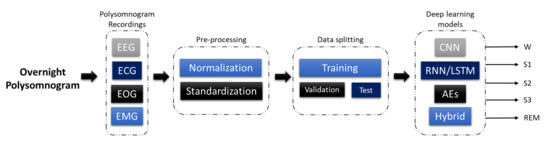
Figure 26.
Programmed diagnostic tool (PDT) block diagram with DL for automated sleep stage classification.
Figure 37 illustrates the number of times each sleep database had been used by studies for automated sleep stage classification using DL techniques, from 2010 to 2020. The DL methods and accuracy obtained from the respective sleep databases are summarized as follows: Sleep-EDF (Table 1), expanded Sleep-EDF (Table 2), MASS (Table 3), MIT-BIH, and SHHS (Table 4), and studies that used the remaining two sleep databases (ISRUC and UCD) and private datasets are listed in Table 5. With the exception of three studies [19][20][21][60,61,62], which classified sleep into four stages, all automated sleep stage classification studies, in Table 1, Table 2, Table 3, Table 4 and Table 5, followed the AASM guidelines [11][21] and classified sleep into five stages. In studies with sleep databases following the R and K rules [9][51], (i.e., Sleep-EDF, expanded Sleep-EDF, UCD, SHHS, and MIT-BIH), the S3 and S4 stages were often combined manually before pre-processing the PSG signals.
Table 1. Summary of automated sleep stage classification approaches with DL applied to PSG recordings in Sleep-EDF dataset.
| Author | Signals | Samples | Approach | Tools/Programming Languages | Accuracy (%) |
|---|
| Author | Signals | Samples | Approach | Tools/Programming Languages | Accuracy (%) |
|---|
Table 3. Summary of automated sleep stages classification approaches with DL applied to PSG recordings in Montreal Archive of Sleep Studies (MASS) dataset.
| Author | Signals | Samples | Approach | Tools/Programming Languages | Accuracy (%) |
|---|
| Zhu et al. [22] [63] 2020 | EEG | 15,188 | attention CNN |
| Wang et al. | |||
| − | |||
| [36] 2018 | EEG | − | |
| 93.7 | |||
| C-CNN | |||
| 82.5 | |||
Table 4. Summary of automated sleep stage classification approaches with DL applied to PSG recordings in Sleep Heart Health Study (SHHS) and Massachusetts Institute of Technology-Beth Israel Hospital (MIT-BIH) datasets.
| Database | Author | Signals | Samples |
|---|
Table 5. Summary of automated sleep stage classification approaches with DL applied to PSG recordings in ISRUC, Massachusetts General Hospital (MGH), and University College Dublin Sleep Apnea Database (UCD) datasets.
| Database | Author | Signals | Approach | Tools/Programming Languages | Accuracy (%) |
|---|---|---|---|---|---|
| Samples | Approach | Tools/Programming Languages | Accuracy (%) |
| − | |||
| − | |||
| Wang et al. [78] 2018 | EEG | − | C-CNN |
| MIT-BIH | Zhang et al. [44] [86] 2020 | EEG | − |
| ISRUC | Cui et al. | − | [49] | Orthogonal CNN | − | ||||||||
| [91 | − | 87.6 | |||||||||||
| ] | 2018 | EEG | |||||||||||
| Wang et al. [36] 2018 | |||||||||||||
| Seo et al. [29] [70] 2020 | EEG | 57,395 | CRNN | PyTorch | −86.5 | CNN | − | 92.2 | |||||
| Qureshi et al. [23] [64] 2019 | EEG | ||||||||||||
| EEG | |||||||||||||
| Supratak et al. [31 | |||||||||||||
| − | |||||||||||||
| ] | 41,900 | [72] | CNN | 2017 | Zhang et al. [45] [87] 2018EEG− | ||||||||
| RNN-biLSTM | − | ||||||||||||
| EEG | 92.5 | ||||||||||||
| − | |||||||||||||
| Wang et al. [78] 2018 | EEG | − | RNN-biLSTM | 58,600 | − | CUCNN | |||||||
| Yang et al. [50 | MATLAB | Yildirim et al. [24] | |||||||||||
| 91.2 | |||||||||||||
| − | − | ||||||||||||
| CNN-BiLSTM | TensorFlow | 86.2 | 87.2 | [65] 2019 | EEG | 15,188 | 1D-CNN | Keras | |||||
| Fernandez-Blanco et al. | |||||||||||||
| 90.8 | |||||||||||||
| [37] 2020 | |||||||||||||
| Fernandez-Blanco et al. [ | |||||||||||||
| EEG | |||||||||||||
| 79 | |||||||||||||
| − | |||||||||||||
| ] 2020 | EEG | − | |||||||||||
| CNN | |||||||||||||
| ] | |||||||||||||
| − | 92.7 | ||||||||||||
| CNN | SHHS | Sors et al. [46]− | 92.7 | ||||||||||
| Phan et al. [32] [ | [88] 2018 | EEG | 5793 | CNN | − | 87.0 | |||||||
| [92] 2018 | EEG | − | CNN-LSTM | − | − | 73] 2019 | EEG | − | Multi-task CNN | TensorFlow | 78.6 | ||
| UCD | Zhang et al. [44] [86] 2020 | EEG | − | Orthogonal CNN | − | 88.4 | Hsu et al. [25] [66] 2013 | EEG | |||||
| Yildirim et al. [24] 2019 | |||||||||||||
| Seo et al. | |||||||||||||
| EEG | 127,512 | 1D-CNN | Keras | 90.5 | |||||||||
| Yildirim et al. [65] 2019 | 2880 | Elman RNN | − | 87.2 | |||||||||
| EEG | 127,512 | 1D-CNN | Keras | [29] [70] 2020 | |||||||||
| Zhang et al. [45] [87 | EEG | ] 5,421,338 | 2018 | EEG | −CRNN | Michielli et al. [26] [67] 2019 | EEG | 10,280 | RNN-LSTM | MATLAB | 86.7 | ||
| 90.5 | |||||||||||||
| Dong et al. [41] [83] 2018 | EOG F4 | − | MNN RNN-LSTM | Theano | 85.9 | PyTorch | 86.7 | ||||||
| Jadhav et al. [38] 2020 | |||||||||||||
| CUCNNDong et al. [41] [83 | |||||||||||||
| EEG | 62,177 | CNN | − | 83.3 | |||||||||
| Jadhav et al. [80] 2020 | EEG | ] | Fernández-Varela et al. 62,177 | CNN | 2018− | 83.3 | |||||||
| EOG Fp2 | − | MNN RNN-LSTM | [47] [89] 2019 | EEG + EOG + EMG | 1,209,971 | 1D-CNNTheano | 83.4 | − | 78.0 | Wei et al. [27] [68] 2017 | EEG | ||
| Zhu et al. | |||||||||||||
| − | |||||||||||||
| [ | |||||||||||||
| CNN | − | ||||||||||||
| 22] 2020 | EEG | 42,269 | attention CNN | ||||||||||
| Chambon et al. | |||||||||||||
| − | |||||||||||||
| [42] | 84.5 | ||||||||||||
| 82.8 | |||||||||||||
| Zhu et al. [63] 2020 | [84EEG | ] 42,269 | attention CNN | 2018− | 82.8 | ||||||||
| EEG/EOG + EMG | − | 2D-CNN | Keras | − | |||||||||
| Zhang et al. [48] [90] 2019 | EEG + EOG + EMG | 5793 | CNN-LSTM | − | − | Mousavi et al. [28] [69] 2019 | |||||||
| Mousavi et al. | |||||||||||||
| EEG | |||||||||||||
| [28] | |||||||||||||
| 42,308 | |||||||||||||
| 2019 | EEG | ||||||||||||
| CNN-BiRNN | TensorFlow | 84.3 | |||||||||||
| 222,479 | 1D-CNN | TensorFlow | 80.0 | ||||||||||
| Mousavi et al. [69] 2019 | EEG | ||||||||||||
| SHHS | Li et al. [19] [60] 2018 | ECG HRV | 400,547 | CNN | MATLAB | 65.9 | Phan et al. [32] [73] 2019 | EEG + EOG + EMG | |||||
| MATLAB | 87.0 | ||||||||||||
| Yuan et al. [51] [93] 2019 | Multivariate PSG signals | 287,840 | Hybrid CNN | PyTorch | 74.2 | ||||||||
| Private datasets | Zhang et al. [30] [71] 2020 | EEG | 264,736 | CNN | − | 96.0 | 222,479 | ||||||
| Phan et al. | 1D-CNN | [ | TensorFlow | 80.0 | |||||||||
| 43] [85] 2019 | EEG + EOG + EMG | − | Hierarchical RNN | TensorFlow | 87.1 | ||||||||
| Biswal et al. [52] [94] 2018 | PSG signals | 10,000 | RCNN | PyTorch | 87.5 | Seo et al. [29] [70] 2020 | EEG | 42,308 | CRNN | PyTorch | |||
| Tsinalis et al. | |||||||||||||
| 83.9 | |||||||||||||
| [39] 2016 | EEG | − | 2D-CNN | Lasagne + Theano | 74.0 | ||||||||
| Tsinalis et al. [81] 2016 | EEG | − | 2D-CNN | Lasagne + Theano | 74.0 | MIT-BIH | Zhang et al. [30] [71] 2020 | ||||||
| Biswal et al. [53] [95] 2017 | Li et al. | − | [Multi-task CNN | TensorFlow | 83.6 | ||||||||
| 19 | ] [60] 2018 | ECG HRV | EEG2829 | CNN | MATLAB | 75.4 | 10,000 | RCNN | TensorFlow | 85.7 | EEG | Phan et al. [− | 32]CNN |
| Yildirim et al. [24 | |||||||||||||
| − | 83.6 | ||||||||||||
| ] 2019 | |||||||||||||
| ] 2019 | |||||||||||||
| EOG | 127,512 | ||||||||||||
| [ | |||||||||||||
| 1D-CNN | |||||||||||||
| 73EOG | 127,512 | 1D-CNN | |||||||||||
| Keras | 88.8 | ||||||||||||
| Yildirim et al. [65 | ] 2019 | EEG + EOG | − | Multi-task CNN | |||||||||
| Tripathy et al. [20] [61] 2018 | EEG + HRV | Keras | 7500 | DNN AutoencoderTensorFlow88.8 | MATLAB | 73.7 | Supratak et al. [31] [72] 2017 | EEG | 41,950 | CNN-BiLSTM | |||
| TensorFlow | |||||||||||||
| Yildirim et al. | |||||||||||||
| 82.0 | |||||||||||||
| Class = 4 | |||||||||||||
| [24] 2019 | EEG + EOG | 127,512 | 1D-CNN | Keras | 91.0 | ||||||||
| Yildirim et al. [65] 2019 | EEG + EOG | ||||||||||||
| Radha et al. [21 | 127,512 | ] [62] 20191D-CNN | Keras | 91.0 | ECG HRV | 541,214 | LSTM | − | 77.0 | Phan et al. [32] [73] 2019 | EEG | ||
| Sokolovsky et al. [ | |||||||||||||
| − | |||||||||||||
| 40] 2019 | |||||||||||||
| Multi-task CNN | |||||||||||||
| 81.0 | |||||||||||||
| Sokolovsky et al. [82] 2019 | |||||||||||||
| EEG + EOG | − | CNN | |||||||||||
| EEG + EOG | − | TensorFlow | CNN | ||||||||||
| TensorFlow + Keras | |||||||||||||
| 81.9 | |||||||||||||
| TensorFlow + Keras | 81.0 | Vilamala et al. [33] [74] 2017 | EEG | − | CNN | − | 81.3 | ||||||
| Phan et al. [34] [75] 2018 | EEG | − | 1-max CNN | − | 79.8 | ||||||||
| Phan et al. [34] [76] 2018 | EEG | − | Attentional RNN | − | 79.1 | ||||||||
| Yildirim et al. [24] [65] 2019 | EOG | 15,188 | 1D-CNN | Keras | 89.8 | ||||||||
| Yildirim et al. [24] [65] 2019 | EEG + EOG | 15,188 | 1D-CNN | Keras | Xu et al. [35] [77] 2020 | PSG signals | − | DNN | − | 86.1 | |||
| Phan et al. [32] [73] 2019 | EEG + EOG | − | Multi-task CNN | TensorFlow | 82.3 |
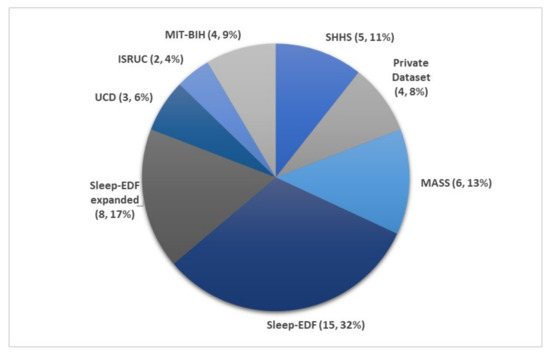
Figure 37. Pie chart representation of the frequency in which each sleep database was used in automated sleep stage classification studies. The total number of studies was 47, as listed in Table 1, Table 2, Table 3, Table 4 and Table 5. * Summary statistics: using various databases for sleep stage classification.
Figure 48 shows the number of times PSG recordings such as EEG, EOG, EMG, and ECG signals were used for sleep stage classification studies. It is not surprising that EEG signal was the most popular input for DL models. The characteristic waves and description of each sleep stages are often based on EEG characteristics (i.e., alpha waves, theta waves, delta waves, etc.); Figure 15.
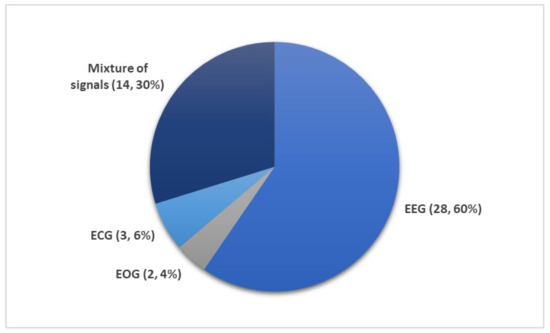
Figure 48. Different subsets of PSG recordings used to train DL models for automated sleep stage classification as listed in Table 1, Table 2, Table 3, Table 4 and Table 5. Of the 36 studies, the mixture of signals (electrooculogram (EOG), electromyogram (EMG), and electroencephalography (EEG)) was employed 14 times while EEG signals were used 28 times. Only a small fraction (five studies) employed ECG or EOG time series. * Summary statistics: using EEG versus EEG + additional signals.
Nonetheless, other signals within the PSG recordings are indispensable, because they provide additional information on biological aspects of sleep that may not be manifested in EEG recordings. Since REM sleep is characterized by the movement of eyes and loss in muscle tone of the body core, EOG, and EMG signals may provide key information to separate the REM sleep stage from the other stages. It was shown that some of the REM sleep stages could be overlooked in single-channel EEG input [54][27]. Therefore, a combination of signals, comprising of EOG, EMG, and EEG, are second in terms of frequency of use after single-channel EEG inputs (Figure 48).
Although ECG is an important sleep parameter [55][96], it is not common to use raw ECG signals as a direct input for DL models. As seen in Table 4, heart rate variability (HRV) parameters derived from ECG signals, were used to train the DL models instead. There are only three studies that employed HRV parameters, and these studies classified sleep into four stages instead of five: wakefulness (W), light sleep (S1 and S2), deep sleep (S3 and S4), and REM sleep. Li et al. [19][60] proposed a 3-layer CNN model. They used a cardiorespiratory coupling (CRC) spectrogram, which was derived from ECG and HRV. Besides alternations in physiological signals, there are other changes in body system changes in some individuals such as cardiovascular [56][97], respiratory [57][98], or blood flow in the brain [58][99]. Hence, the CRC picks up the cardiovascular and respiratory changes. Their model achieved an overall accuracy of 65.9% and 75.4% for SHHS and MIT-BIH respectively, as seen in Table 4. Tripathy et al. [20][61] combined EEG and HRV features as input to an AE model. During testing, the model achieved an overall accuracy of 73.7%. Radha et al. [21][62] published the only study that was based on ECG signals from a private dataset that was collected as part of the European Union SIESTA project [59] [100] as shown in Table 5. Likewise, they converted ECG signals into HRV and used the HRV features to train an LSTM model, which achieved an accuracy of 77.0%.
3. Conclusions
Sleep disorders are a pressing global issue and the most dangerous sleep disorder is obstructive sleep apnea, which can lead to cardiovascular diseases, if left untreated. Hence, efficient, and accurate diagnostic tools are required for early interventions. In this work, we reviewed 36 studies that employed programmed diagnostic tools with the DL models as the backbone, analyzing overnight polysomnogram recordings to classify sleep stages. Presently, CNN models can offer higher performance in classifying sleep stages, especially with EEG signals. Hence, they are consistently and favourably used by researchers to classify sleep stages as compared to the other machine learning models and physiological signals. Moreover, employing 1D-CNN models is advantageous, because they yield high classification results on EEG signals. However, EEG signals alone may not be sufficient to achieve robust classifications. To achieve robustness and high accuracy one could develop a system that takes advantage of both automated processing and human expert analysis for the interpretation of EEG, EOG, and EMG signals when classifying sleep stages. Therefore, in this review, we highlighted that future studies should focus on classifying sleep stages using all or a combination of these signals. Furthermore, other DL models, such as RNN/LSTM and hybrid models, should also be explored as their full potential has yet to be realized. Future studies could focus on the compatibility and applicability of the DL models in mobile and real time applications. Lastly, more research in developing DL models to detect sleep microstructures is required, as these are often undetected in sleep stage scoring.