Genetic analysis of admixed populations raises special concerns with regard to study design and data processing, particularly to avoid population stratification biases. The point mutation responsible for sickle cell anaemia codes for a variant hemoglobin, sickle hemoglobin or HbS, whose presence drives the pathophysiology of disease.
- Genetics
- Sickle cell anemia
- Genomic variants
- Genomic analysis
- Admixed populations
- Genetic comparison
- USA and Brazil
Please note: Below is an entry draft based on your previous paper, which is wrirren tightly around the entry title. Since it may not be very comprehensive, we kindly invite you to modify it (both title and content can be replaced) according to your extensive expertise. We believe this entry would be beneficial to generate more views for your work. In addition, no worry about the entry format, we will correct it and add references after the entry is online (you can also send a word file to us, and we will help you with submitting).
1. Introduction
Sickle cell anaemia (SCA) is caused by homozygosity for a point mutation in the beta-globin gene (HBB) on chromosome 11. SCA was the first monogenic disease to be described in humans1 [1] and manifestations are caused by red blood cells damaged by HbS [2]2. Five RFLP-assessed haplotypes, named after the locations where they occur more frequently (Benin, Central Africa Republic or CAR, Cameroon, Senegal and Arab-Indian), are classically used to classify the HBB cluster. High fetal haemoglobin (HbF) levels are associated with the Senegal and Arab-Indian haplotypes, compared to the Benin, CAR and Cameroon haplotypes [3]3. Individuals with CAR haplotypes tend to present the lowest HbF levels, while individuals with the Benin haplotype usually have intermediate HbF production levels [4]4. Despite the fact that the protective effect of HbF may vary according to its distribution amongst erythrocytes, as shown by severe SCA cases carrying the Arab-Indian haploytpe [5]5, these findings have motivated abundant characterization of diverse SCA populations worldwide regarding HBB haplotypes.
Some effort has been made to describe genetic diversity and structure among SCA patients [6][7][8][9]6,7,8,9. Nonetheless, aspects regarding the effect of European ancestry10 [10] and fine genetic structure on the SCA mutation locus remain elusive. Large association studies have been mostly conducted on SCA patients from the US (SUS). Other studies, such as those conducted in Brazilian SCA patients (SBR), rely frequently on findings from studies of the SUS population. The US and Brazil have the highest prevalence of new-borns with SCA on the American continent, estimated to be 4,351 and 2,978, respectively, in 2010 [11]11 and are divergent in demographic history regarding migration and admixture.
2. Discussion
In the present study, we compared SCA patients from the US and Brazil through the analysis of population structure at two levels, by genome-wide analysis and by further exploring the mutation-harbouring chromosome. At the genomic level, the cohorts showed substantial differences with respect to ancestry. We found the Brazilian cohort to be more admixed (Fig. 1 and Table 1) and more likely to have greater European and Amerindian ancestries, while the US sample has a more prominent African background. Brazilian ancestral proportions concur with a previous report on a sickle cell disease sample analysed on the continental ancestries level [8]8.
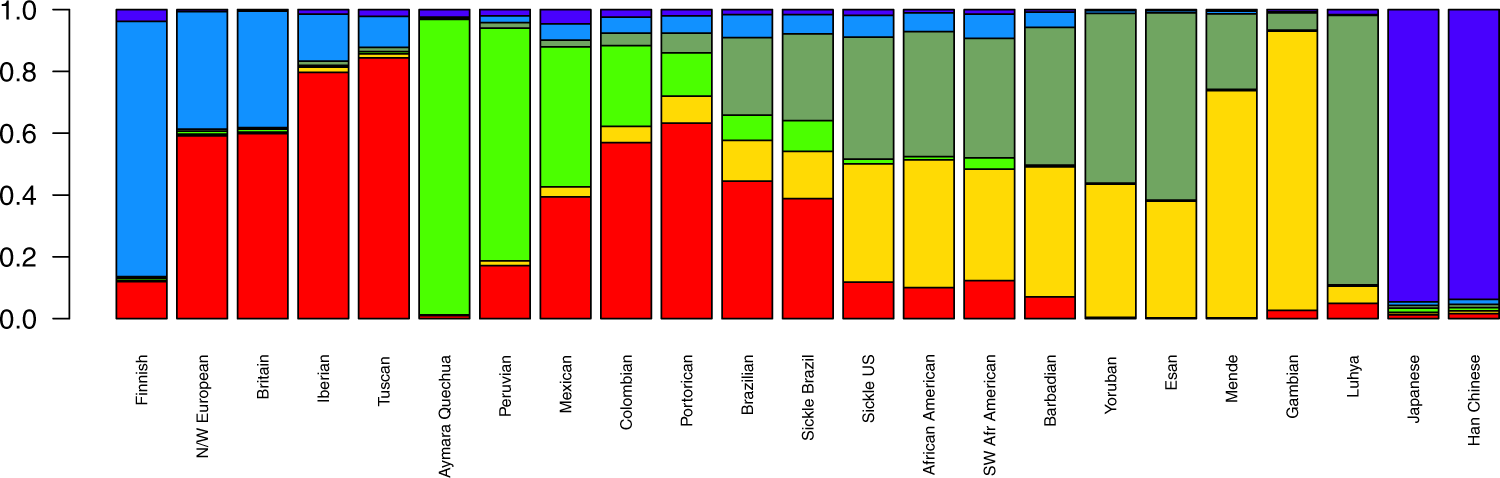
Figure 1. Mean ancestral components inferred by ADMIXTURE analysis. This analysis was performed using 155,820 SNPs across the genome. K = 6 had the lowest cross-validation error and thus was selected to represent ancestral components. Each bar represents a population in x-axis, while y-axis depicts mean proportional ancestry for each population. N/W: North and West; SW: Southwest; Sickle: sickle cell anaemia.
Table 1. Mean (±standard deviation) ancestry proportions for sickle cell anaemia patients from the US and Brazil. Genome-wide and chromosome 11 ancestry proportions as inferred by ADMIXTURE (at K = 6) and SABER+, respectively. Here East is considered Bantu and West is Mandinka/Mende people (Mandé group).
|
Africa |
Europe |
America |
||||
|---|---|---|---|---|---|---|
|
East |
West |
North |
South |
|||
|
Genomic ancestry |
Sickle Cell US |
39.4% (±8%) |
38.3% (±8%) |
7% (±4%) |
12% (±6%) |
1.5% (±1%) |
|
Sickle Cell Brazil |
28% (±10%) |
15.3% (±6%) |
6.3% (±4%) |
39% (±12%) |
10% (±4%) |
|
|
Chr. 11 ancestry |
Sickle Cell US |
76% (±6%) |
18.3% (±4%) |
5.7% (±4%) |
||
|
Sickle Cell Brazil |
44% (±10%) |
39.3% (±8%) |
16.7% (±6%) |
|||
By subdividing ancestry origins further to the subcontinental scale, the North American cohort had a pattern of within-Africa ancestry consistent with reports of genetic relatedness to Yorubans [9][12]9,15. In a large study, Tishkoff et al. examined four African American populations along with 181 global populations and concluded that the former have ancestry predominantly from West-Africa (approx. 71%), followed by Europe (approx. 13%), other African regions (approx. 8%) and America (approx. 4%) [13]16. They also described the African Americans to have a 45% Bantu mean ancestry and 22% non-Bantu (Mandinka ethnolinguistic group) mean ancestry, emphasizing that the diaspora encompassed a broad region in Africa, ranging from Senegambia in the west all the way to Angola, in the south [13]16. Our data are consistent with these findings for both the SUS population and non-affected African descendants from the US, which are nearly identical in ancestral composition.
Brazilian affected and unaffected subjects, on the other hand, are somewhat discernible by both PCA and ADMIXTURE plots, although we assert that the non-affected sample was not controlled for skin pigmentation and was rather collected at random. More importantly, Brazilian HbAA were all collected in São Paulo, while the SCA group has also subjects from Pernambuco. Still, this differentiation is markedly small (FST = 0.001) and advocates for a higher admix rate in the Brazilian SCA cohort compared to the US cohort analysed. The former has two-thirds of its African heritage traced to the East-African Bantu population, and the other one-third to West-African non-Bantu populations. Although Brazilian predominance of Bantu composition is consistent with reported migration records, the SUS group shows a net contribution that is greater than what we observed for Brazilians. This might reflect the Bantu expansion, one of the major demographic movements in history of mankind, thought to have started around five thousand years ago, when Bantu-speaking people from Nigeria/Cameroon spread East and South, a migration probably prompted by agriculture [14]17.
Unlike the SCA population from the US (see Solovieff et al. [9]9), Brazilian SCA has only been briefly described in terms of genetic structure and ancestry[8]8, and to the best of our knowledge, to date no subcontinental ancestry has ever been evaluated in this population. Kehdy et al. evaluated 6,487 subjects from the general populations of Northeast, Southeast and South Brazil, finding them to display two distinct within-Africa ancestry components: non-Bantu Western and Bantu Eastern and that the former was more prominent in Northeast Brazil, while the latter is more prominent in the South-eastern/Southern areas. Nonetheless, Bantu only accounted for an average of 36% in Southeastern people and 44% in Southern Brazilians, while we found Brazilians, irrespective of disease status, to share 65% of their African heritage traced to Bantu on average. This might be due to the different regional origins of the recruited subjects and/or other methodological and analytical aspects, although both are in agreement with historiographical data, which states that enslaved Yoruban people arrived in large numbers in the Northeast port of Salvador, whereas the Mozambican Bantu slaves disembarked largely in Rio de Janeiro ports, in South-eastern Brazil [15]18. Also, Hudson'’s FST on genomic markers confirms that our sample of SCA from Brazil is slightly closer to Bantu than to non-Bantu populations. SCA individuals from the US display a more even sub-continental African composition and greater proximity to the African populations evaluated here, indicating assortative mating may have had great impact on the US cohort. It is noteworthy that the FST values also show that the two affected cohorts are closer to each other than they are to European populations, and that the SBR cohort is closer also to its US counterpart than to any African population surveyed.
We found that chromosome 11 haplotype ancestries in SCA cohorts generally correspond to the genome-wide ancestry proportions we found in the previous analysis. Moreover, inferred HBB haplotypes agreed with the expected distribution: CAR prevails in SBR, while in SUS the Benin haplotype predominates. The HBB haplotypes were firstly believed to indicate five distinct HbS mutation events, but a recent report favours the hypothesis of a single origin of the HbS allele in Africa approximately 7,300 years ago [16]19, while another study, taking population structure, demography, overdominance and balanced selection into account, estimated the origin of HbS mutation to have taken place approximately 22,000 years ago in the ancestors of African agriculturalists [17]20. By evaluating 20 haplotypes containing the HbS in the 1,000 Genomes Project and in Qatar subjects, Shriner and Rotimi identified three clusters resulting from two split events. The first occurred on the ancestral haplotype and accounts for the CAR, Cameroon and Indian-Arab haplotypes, while the second gave rise to two clusters, one accounting for the Senegal and the other accounting for the Benin haplotypes[16]19. The authors proposed that HbS had a single origin in the Sahara or in West-Central Africa, and a population diverged in present-day Cameroon, carrying the first cluster east and south as part of the Bantu expansion, while a separate migration wave headed north and west to present-day Senegal and the Gambia, giving rise to the Senegal and Benin haplotypes[16]19.
Moreover, we propose that the divergence on the chromosome 11 is due to a recent selection event in the SBR population. We tested the genotyping rate for this range and found no missing data for either population, and the proportions of HBB haplotypes are in agreement with those reported for both cohorts [18]21. Selection-suggestive signals seem to agree on a 100 kb region, as evaluated by LD, haplotype pattern, FST, iHS and XP-EHH (Figs 2 and 3), ranging from chromosome 11:5.4 Mb to 5.5 Mb. This range comprises the LCR, a regulatory element well known for modulating the expression of gamma-globin. Low iHS values in the Brazilian patients overlap with a region also known to harbour an olfactory receptor cluster that has been associated with HbF production [19]22. Additionally, we detected markers significantly associated with HbF in a group of 68 Brazilian patients after correcting for age, sex and hydroxyurea treatment (Fig. 3d). This finding supports the hypothesis of a selection event driven by an HbF modulating variant. Our data seem to be consistent with those of the study by Creary et al. [10]10, who reported an association between European ancestry and the proportion of erythrocytes containing HbF. Another study, from Leonardo et al. evaluated variants in 244 sickle cell patients and found rs9399137 in the HMIP-2 locus, a relatively common European polymorphism, significantly associated with HbF levels [20]23. The relationship between European background and clinical outcome is, therefore, far from established.
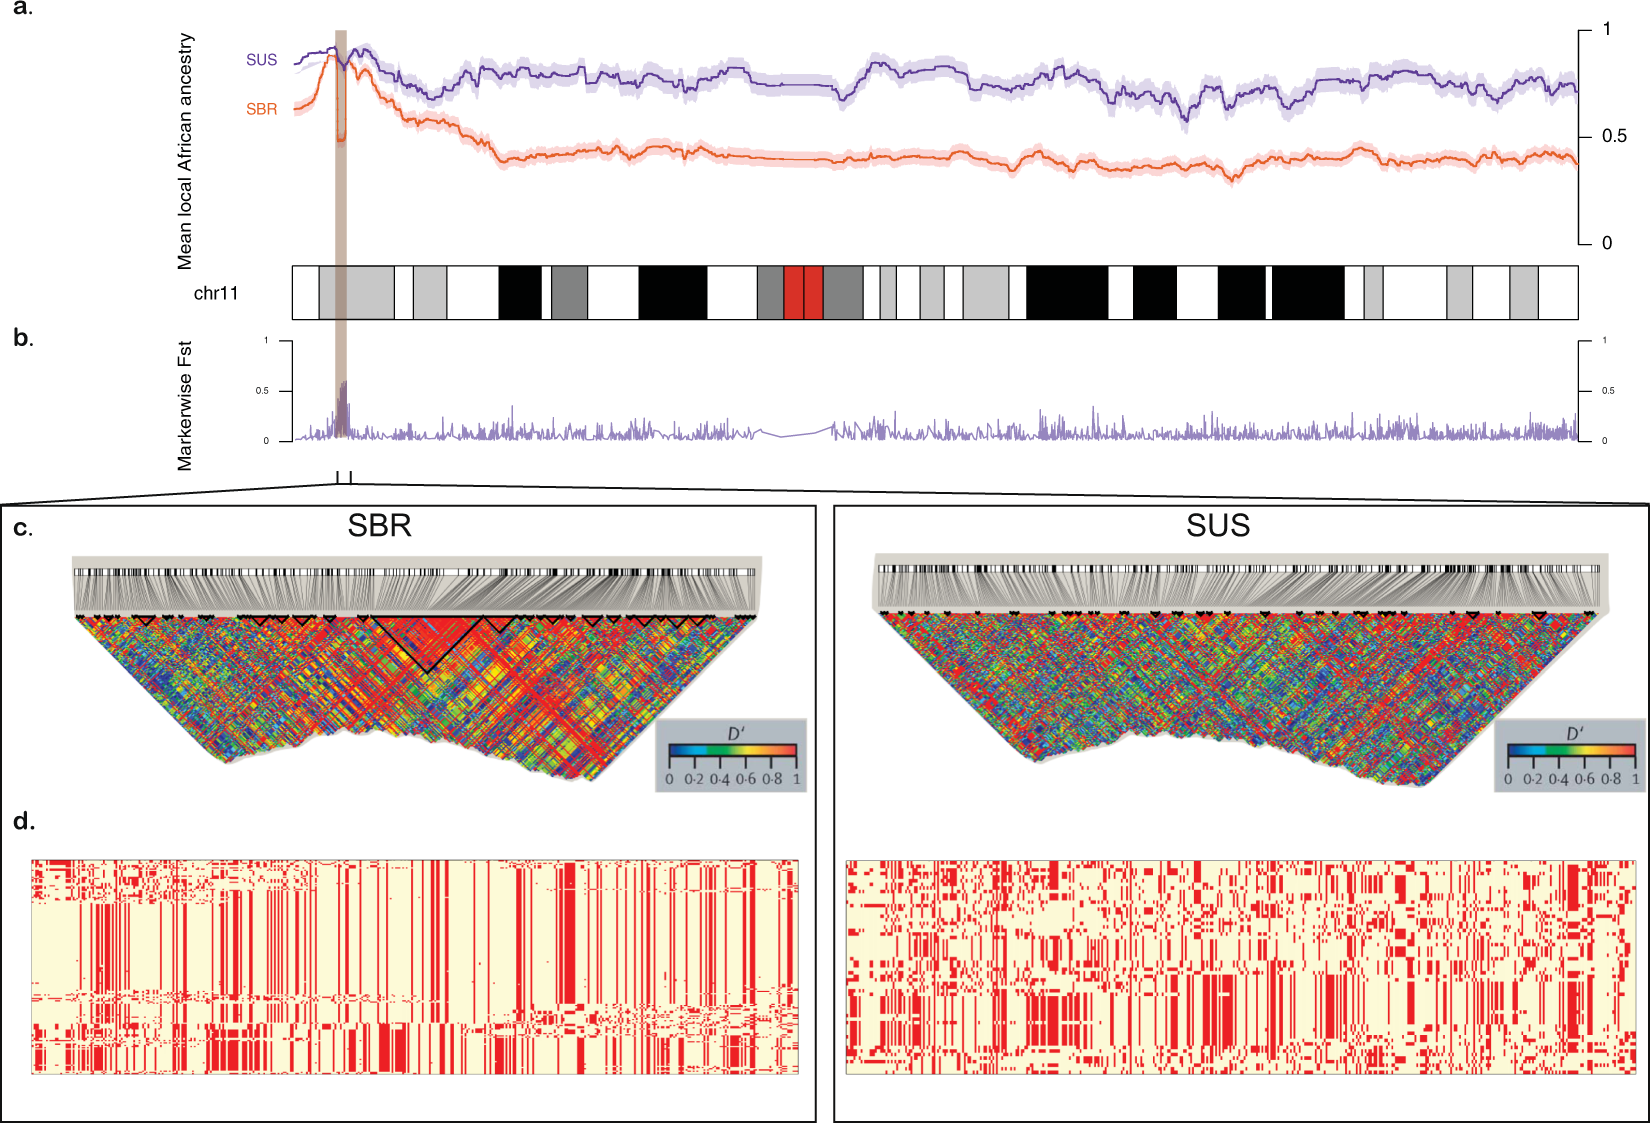
Figure 2. Comparison between Brazilian (SBR) and American (SUS) sickle cell anaemia patients on chromosome 11. (a) Diagram of the chromosome 11 (27,188 SNPs). Higher panel: x-axis represents physical position, y-axis is local mean African component inferred by SABER+; shades denote standard errors. (b) FST values for each marker showing high differentiation on the HBB cluster region (highlighted), also a site where SBR shows a drop in mean African ancestry. (c) Linkage disequilibrium in GOLD heat map generated by Haploview for SBR (left) and SUS (right) cohorts. (d) Phased haplotypes diagram along the highlighted area (chromosome 11:4.5–5.7 Mb) for SBR (left) and SUS (right).
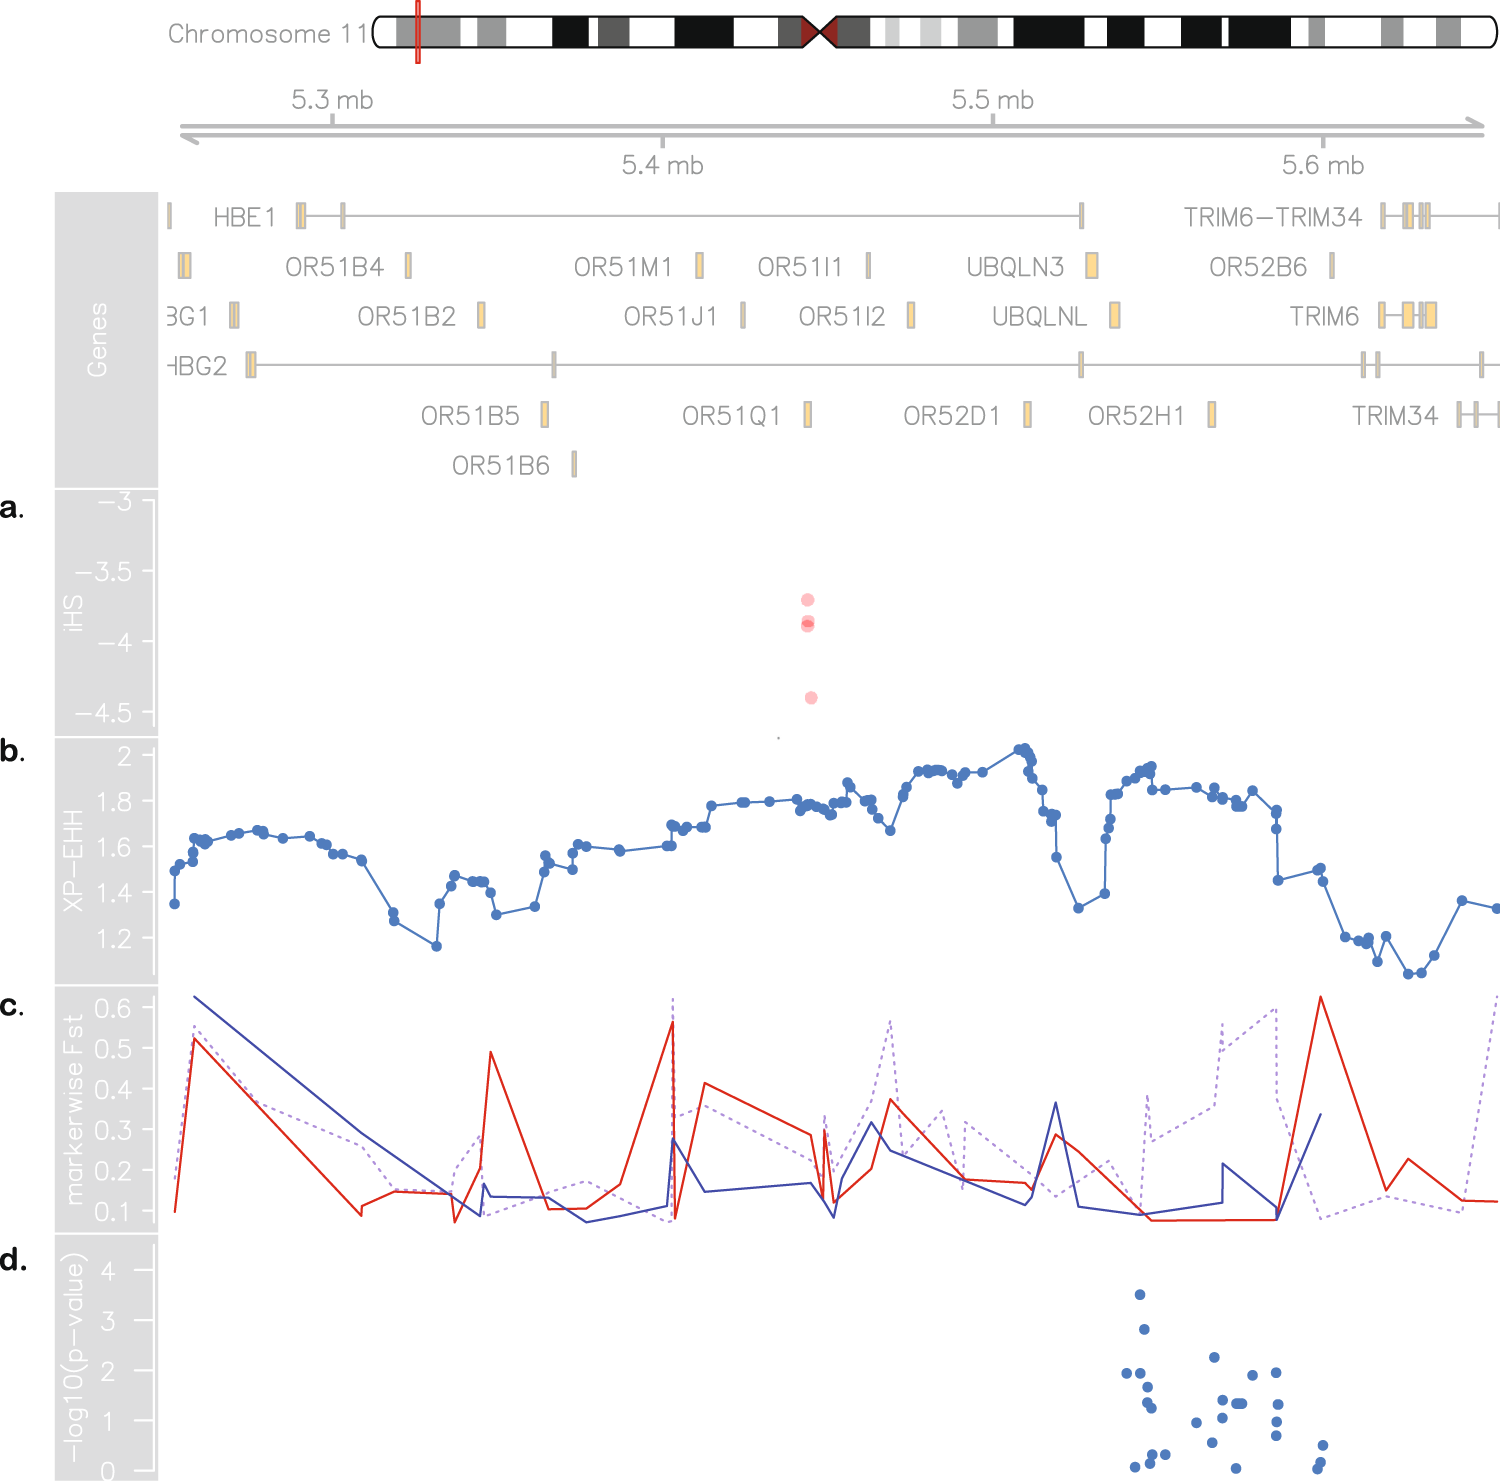
Figure 3. Evidence for positive selection in Brazilian sickle cell patients. At the top: chromosome 11 ideogram highlighting the region from 5.2 to 5.7 Mb, followed by genomic context. (a) Brazilian iHS values (values below −2 indicate positive selection). (b) XP-EHH between sickle cell anaemia cohorts from Brazil and US (values above 2 are considered signals of selection in one population but not in the other). (c) Pairwise SBR-SUS (dotted purple line), SBR-IBS (red line) and SBR-LWK (blue line) FST values. (d) Association between makers in the 5.45–5.59 Mb range and HbF levels in the Brazilian cohort.
An alternative explanation for the local ancestry results is that the signals are a by-product of malaria related selection acting on the sickle cell allele. A hypothetical higher incidence of malaria in Brazil compared to the United States throughout history (malaria was controlled for most of the United States of America territory from the beginning of the twentieth century on [21]24) could influence LD patterns and generate the aforementioned results. We, then, tested LD between the rs334 mutation region and the region under selection and found that they form independent blocks, not exceptionally linked at any marker. Moreover, FST values between affected and unaffected Brazilians are as high as 0.76 in this region, implying that the putative selection event acts strictly on SCA subjects and is related to the disease and not to the general population.
This study was limited by the relatively small sample sizes in SCA cohorts derived from just three sampling localities. These limitations make it difficult to extrapolate the results to larger and more broadly distributed sickle cell individuals from the two countries evaluated and also amplify statistical noise. Although assessed in regard of IBD, individuals might still have cryptic structure/consanguinity that would especially affect the LD patterns observed for Brazilian patients. Differences in gene flow, HbS allele frequency and HBB haplotype composition between sampled subjects from Recife and Campinas may have introduced variance not accounted in the analysis. Although genotyping rate is near 100% for markers included in ancestral analysis (see Methods), technical constraints may apply, as the inference of haplotype phase by population data is known to have greater switch error rates. Lo et al. evaluated major phasing algorithms and their accuracy through variation of panels and sample sizes, as well as by comparing trio and populational phasing and found SHAPEIT to yield a 3.52–6.51% switch error rate in small unrelated datasets (N from 15 to 32) [22]25, while Choi et al. found SHAPEIT switch error to be 2.8% when phasing 85 unrelated individuals from European origin [23]26. We would thus expect our data to fall into the range of approximately 3–6% switch error rate. The local ancestry inference might also be affected by the use of East Asian reference data as proxy of ancestral Americans, since it might inflate the estimates of haplotype contribution of that particular population [24]27.
Here, we quantified divergence between two small cohorts and found this to be a promising way to highlight regions of high divergence that might be of functional importance or to uncover candidate loci based on selection signals. The haplotype structure has important implications on the cis-acting factors leading to variation on HbF production. More generally, these findings underline that the five RFLP-haplotype classifications proposed do not account for population-specific demographic factors and, while still useful, should be analysed carefully.
Genetic studies struggle to deal with admixture and other complex population demographic characteristics in face of association to phenotypic traits. Admixture mapping, a tool to perform this task, has been recently developed and relies on regions of different allele frequency driven by contrasting ancestries. It has been suggested that admixture mapping may only be applicable when ancestral populations differ in the phenotype of interest [8]8, and this seems to be the case for SCA patients with regard to HbF production. Admixed mapping, nonetheless, has been applied when the ancestral populations are European and African [10][25][26][27][28]10,28,29,30,31. It is still a matter of debate whether HbF levels are influenced by European ancestry [8]8, whereas different ancestries inside the African continent have already been proven to be diverse regarding gamma-globin expression. Moreover, it is still unclear how different levels of admixture will translate to HbF production and other phenotypic traits. Sickle cell disease ancestry studies could lead to novel loci associated with phenotypic variability. Here we demonstrate that SCA samples from different locations may largely vary on the genomic and local ancestry on chromosome 11. Further studies in larger cohorts, sampled from different locations are welcomed to better describe the variation in ancestral background on genomic and HBB cluster levels. Also, more detailed migration history data and the advancement in fine structure inference methods will broaden our understanding of how patterns of gene flow, admixing, selection and linkage disequilibrium act on shaping genomic regions that impact important phenotypic human traits.
3. Conclution
In conclusion, we found the two different cohorts of SCA to differ in both genome-wide ancestral composition and locally to the causal locus region. Comparing admixed populations may be a strategy to reveal regions of local adaptation that would otherwise require a large association study to be unveiled.