Methanol, an alcohol with an odor similar to that of ethanol, has been described to exist in low concentrations in the human organism and occurs naturally at a low level in most spirits, without conferring health risk if it exists within the legal limits.
- Methanol
- Spirits
- Quantification
1. Introduction
Spirits are alcoholic beverages commonly consumed in European countries. Their raw materials are diverse and include fruits, cereals, honey, sugar cane, or grape pomace. The main aim of this work is to present and discuss the source, quality control, and legal limits of methanol in spirits produced using fruit and honey spirits.
2. Methanol: Source and Impact on Human Health
Methanol is an alcohol, a small molecule with a boiling point of 64.7 °C, which is formed naturally from pectic substances, which exist in plants and fruits, particularly in the solid parts of the fruits[1][2]. Pectin is a branched heteropolysaccharide consisting of long-chain galacturonan segments and other neutral sugars such as arabinose, xylose, rhamnose, and galactose. It contributes to the cell structure and forms a matrix with cellulose and hemicellulose fibers[3][4]. In healthy individuals’ methanol and formaldehyde, its short-lived oxidized products are naturally occurring compounds. The main sources of exogenous methanol in the healthy human organism are fruits, vegetables, and alcoholic beverages[5]. Indeed, methanol is usually present in alcoholic beverages (yet in much lower concentrations in the honey spirit) in a concentration that depends on the raw material used in their production [6].
When juices are extracted and during fermentation, the hydrolysis of chemical groups of pectic substances occurs naturally, through the action of pectin methylesterases (PME), enzymes that naturally exist in plants. Cleavage of methyl-ester bonds of the galacturonic acid units of the pectin backbone leads to the release of free methanol into the medium, which, being volatile, passes easily to the distillate during the distillation process [1].
In humans, methanol is metabolized by the alcohol dehydrogenase 1b (ADH1b) into toxic formaldehyde [7]. This metabolite is responsible for carcinogenesis and age-related damage to neurons in the brain[8].
Methanol and ethanol are very similar compounds from a biological point of view. Indeed, they have the same target structures, possessing a very similar organic effect[9]. However, while ethanol is oxidized to harmless acetate in the process including conversion to acetyl-coenzyme A and further oxidation via the Krebs cycle, formate is the last product of methanol oxidation. Formate is a chemical toxicant that can react with several target structures such as the mitochondrial cytochrome oxidase[9]. Besides that, formate is responsible for two typical manifestations of methanol poisoning: dysfunction of the retina followed by irreversible damage and metabolic acidosis [10][9]. Accumulation of methanol in the blood can cause hyperosmolality, and accumulation of its metabolites can cause an increase in the anion gap and a decrease in serum bicarbonate concentration and this abnormality is an important diagnostic clue in methanol intoxication. Furthermore, the accumulation of lactic and formic acids, formaldehyde, and ketones leads to metabolic acidosis and favors retinal damage [11].
Inhaled methanol is eliminated mainly by metabolism (70–97% of the absorbed dose); only a small fraction is eliminated unchanged in the urine and expired air (3–4%) [12]. The quantification of methanol and ethanol contents in the human breath after the consumption of different amounts of fruits and alcoholic beverages showed that methanol concentrations increased from a physiological level (0.4 to 2 ppm) a few hours after eating approximately 0.5 kg of fruits. Similar levels were found after drinking 100 mL brandy containing 24% ethanol and 0.19% volume of methanol[9].
v/v
v/v) methanol at 40% alcohol volume)[13].
The ingestion of alcoholic beverages, even those of high analytical quality, always results in ethanol, methanol, and formaldehyde contents increasing in the human blood. Recently, a review paper[10] devoted particular attention to lifestyle diseases related to ethanol and methanol, toxicology, and metabolic disruptions of situations where ethanol is inadvertently or criminally replaced by methanol.
3. Methanol Quantification in Spirits
3.1. Current Methods
Methanol is a volatile compound that should be well monitored in spirit drinks. The determination of methanol is usually carried out using high-performance gas-liquid chromatography[14]. Methanol concentrations expressed in grams or milligrams per liter (mg/L) or mg/L of 100% vol. alcohol is usually evaluated using the Internal Standard (IS) method[15][16]. The IS more frequently used are the 4-methyl-2-pentanol or 2-octanol as IS [17][18][19][20]. However, 1-octanol [21], 2-pentanol [22], or 4-nonanol [23] could also be used as the IS.
Because the introduction of the IS compound in low dose is not easy given its volatility, the method of External Standard (ES) is also used[24]. Nevertheless, in both methods, it is mandatory to determine alcohol strength by volume (%
v/v) of the analyzed sample[15][16].
3.2. Methanol Quantification by Vibrational Spectroscopy
Methanol content could also be detected by vibrational spectroscopy (namely NIR, FTIR ad RAMAN). This methodology has been used in numerous studies to forecast the chemical composition of different beverages due to the accessibility of quick results, the minimum sample preparation, and the consequent low associated costs[25][26]. Besides, the use of vibrational spectroscopy leading to a specific and characteristic spectrum for each sample or matrix to be connected to the molecular bonds of its chemical constituents [26] and different methodologies give additional information. As an example, in
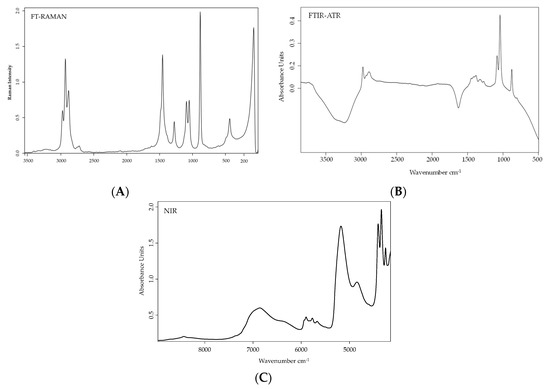
Figure 2.
A) FTIR-ATR [27]; (
B) FT-RAMAN [28] and (
C) NIR [29].
The NIR technique has been used to estimate the alcohol and methanol contents in brandies and other distilled beverages[30][31]. Nordon et al.[32] in their work made the comparison between Raman spectrometry and NIR to assess the alcohol strength of whiskies, vodkas, and other alcoholic drinks. Only a small number researchers used vibrational techniques to quantify or identify methanol content in spirits and are listed below separated by technique.
-
(a)
(a) -
Using FTIR-ATR:
-
Lachenmeier [130] applied the FTIR spectroscopy in combination with multivariate data analysis to assess the quantification of parameters density, ethanol, methanol, ethyl acetate, propanol-1, isobutanol, and 2-/3-methyl-1-butanol of spirit drinks. The calibration model obtained presented an r2 of 0.997 for cross-validation and 0.981 test-set validation;
-
Coldea et al. [131] applied FTIR spectroscopy and chemometrics techniques to evaluate the quality of fruit spirits traditionally produced in Romania. In this study, the methanol fingerprint was identified in the 1020 and 1112 cm-1. Using PLS regression, these authors found that the FTIR spectra could be useful for authenticity control of the provenience region and the type of the fruit spirit;
-
Anjos et al. [132] used FTIR-ATR in the spectral region of 4000 to 400 cm−1 to forecast the alcoholic strength, methanol content, acetaldehyde, and fusel alcohol content of grape mark and wine spirits, applying partial least square (PLS). For methanol content, a very good model was obtained using the peaks at 1085 and 1043 cm−1 corresponding to the C–O stretch absorption bands, with r2 of 99.2 and ratios of performance to deviation (RPD) of 11.1.
-
(b)
(b)-
Using RAMAN:
-
Boyaci et al. [133] proposed a method for direct quantification of ethanol and methanol in distilled alcoholic beverages. In this research, calibration models for ethanol and methanol concentrations in the ranges of 0–7 M and 0–10 M, respectively, were performed. An r2 value of 0.998 for ethanol and 0.998 for methanol for linear correlations were plotted. The aforementioned authors used the important bands of methanol at 1019 cm–1 that corresponded to C–O stretching;
-
Goes et al. [134] used Raman spectroscopy and a statistical procedure based on principal component analysis to determine the presence of methanol content in beverages;
-
Song et al. [
- assigned to the methanol C–O stretching vibration, to make their validation. In this study, the PLS model developed had an r
- 2
- between 0.9518 and 0.9734.
-
-
(c)
(c) -
Using NIR:
-
Yang et al. [31], applied multivariate calibration in data collected with two-dimensional NIR, to make the determination of methanol in white spirit. In this study, the N-way partial least squares technique was applied to the impure methanol solution; the obtained average relative error and root mean square error was 2.97 and 0.064%, respectively. They concluded that the adulteration level by methanol was taken in the region of 4300– 4450 cm
Yang et al. [128], applied multivariate calibration in data collected with two-dimensional NIR, to make the determination of methanol in white spirit. In this study, the N-way partial least squares technique was applied to the impure methanol solution; the obtained average relative error and root mean square error was 2.97 and 0.064%, respectively. They concluded that the adulteration level by methanol was taken in the region of 4300– 4450 cm−1
. - ] used handheld Raman spectroscopy, with an excitation laser emitting at 1064 nm to online detect methanol content in a spirit. For their analysis, they used the spectral information located at 1074.6 cm−1 (bending vibration of C-O-H). The prediction of methanol concentration was made with an r2 of 0.999. More recently, Ellis et al. [136] proposed a methodology for through-container detection of fake spirits and methanol quantification with handheld Raman spectroscopy. These authors used the peak at 1030 cm−1 assigned to the methanol C–O stretching vibration, to make their validation. In this study, the PLS model developed had an r2 between 0.9518 and 0.9734.
-
- Lachenmeier[33] applied the FTIR spectroscopy in combination with multivariate data analysis to assess the quantification of parameters density, ethanol, methanol, ethyl acetate, propanol-1, isobutanol, and 2-/3-methyl-1-butanol of spirit drinks. The calibration model obtained presented an r2 of 0.997 for cross-validation and 0.981 test-set validation;
-
Boyaci et al. [36] proposed a method for direct quantification of ethanol and methanol in distilled alcoholic beverages. In this research, calibration models for ethanol and methanol concentrations in the ranges of 0–7 M and 0–10 M, respectively, were performed. An r2 value of 0.998 for ethanol and 0.998 for methanol for linear correlations were plotted. The aforementioned authors used the important bands of methanol at 1019 cm–1 that corresponded to C–O stretching;Coldea et al. [34] applied FTIR spectroscopy and chemometrics techniques to evaluate the quality of fruit spirits traditionally produced in Romania. In this study, the methanol fingerprint was identified in the 1020 and 1112 cm-1. Using PLS regression, these authors found that the FTIR spectra could be useful for authenticity control of the provenience region and the type of the fruit spirit;
-
Anjos et al.[
-
Goes et al. [35] used FTIR-ATR in the spectral region of 4000 to 400 cm−1 to forecast the alcoholic strength, methanol content, acetaldehyde, and fusel alcohol content of grape mark and wine spirits, applying partial least square (PLS). For methanol content, a very good model was obtained using the peaks at 1085 and 1043 cm−1 corresponding to the C–O stretch absorption bands, with r2 of 99.2 and ratios of performance to deviation (RPD) of 11.1.
- ]
- used Raman spectroscopy and a statistical procedure based on principal component analysis to determine the presence of methanol content in beverages;
-
Song et al. [38] used handheld Raman spectroscopy, with an excitation laser emitting at 1064 nm to online detect methanol content in a spirit. For their analysis, they used the spectral information located at 1074.6 cm−1 (bending vibration of C-O-H). The prediction of methanol concentration was made with an r2 of 0.999. More recently, Ellis et al. [39] proposed a methodology for through-container detection of fake spirits and methanol quantification with handheld Raman spectroscopy. These authors used the peak at 1030 cm−1